Cities with the Largest Black / African American Community in California
RELATED REPORTS & OPTIONS
Black / African American
California
Compare Cities
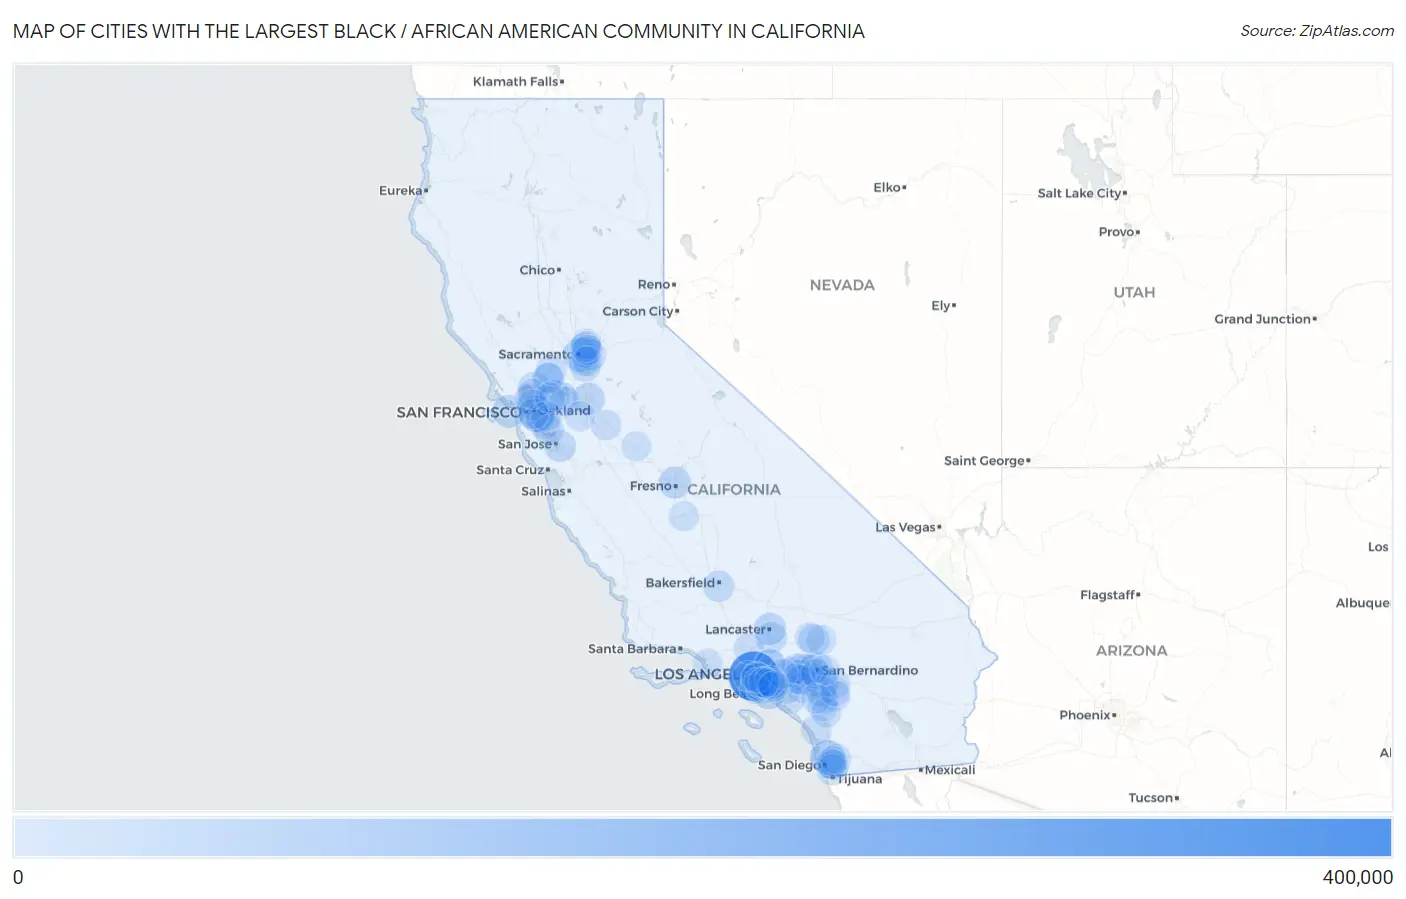
Map of Cities with the Largest Black / African American Community in California
0
400,000
Cities with the Largest Black / African American Community in California
| City | Black / African American | vs State | vs National | |
| 1. | Los Angeles | 332,173 | 2,202,587(15.08%)#1 | 41,288,572(0.80%)#8 |
| 2. | Oakland | 95,412 | 2,202,587(4.33%)#2 | 41,288,572(0.23%)#41 |
| 3. | San Diego | 81,231 | 2,202,587(3.69%)#3 | 41,288,572(0.20%)#53 |
| 4. | Sacramento | 65,978 | 2,202,587(3.00%)#4 | 41,288,572(0.16%)#67 |
| 5. | Long Beach | 55,623 | 2,202,587(2.53%)#5 | 41,288,572(0.13%)#81 |
| 6. | San Francisco | 44,058 | 2,202,587(2.00%)#6 | 41,288,572(0.11%)#103 |
| 7. | Inglewood | 42,225 | 2,202,587(1.92%)#7 | 41,288,572(0.10%)#106 |
| 8. | Stockton | 37,257 | 2,202,587(1.69%)#8 | 41,288,572(0.09%)#124 |
| 9. | Moreno Valley | 36,872 | 2,202,587(1.67%)#9 | 41,288,572(0.09%)#125 |
| 10. | Lancaster | 36,296 | 2,202,587(1.65%)#10 | 41,288,572(0.09%)#128 |
| 11. | Fresno | 35,576 | 2,202,587(1.62%)#11 | 41,288,572(0.09%)#129 |
| 12. | San Jose | 29,374 | 2,202,587(1.33%)#12 | 41,288,572(0.07%)#162 |
| 13. | San Bernardino | 27,295 | 2,202,587(1.24%)#13 | 41,288,572(0.07%)#182 |
| 14. | Bakersfield | 25,810 | 2,202,587(1.17%)#14 | 41,288,572(0.06%)#188 |
| 15. | Compton | 24,121 | 2,202,587(1.10%)#15 | 41,288,572(0.06%)#210 |
| 16. | Victorville | 23,080 | 2,202,587(1.05%)#16 | 41,288,572(0.06%)#225 |
| 17. | Vallejo | 22,944 | 2,202,587(1.04%)#17 | 41,288,572(0.06%)#227 |
| 18. | Hawthorne | 22,683 | 2,202,587(1.03%)#18 | 41,288,572(0.05%)#232 |
| 19. | Antioch | 22,446 | 2,202,587(1.02%)#19 | 41,288,572(0.05%)#236 |
| 20. | Carson | 21,222 | 2,202,587(0.96%)#20 | 41,288,572(0.05%)#246 |
| 21. | Richmond | 21,156 | 2,202,587(0.96%)#21 | 41,288,572(0.05%)#247 |
| 22. | Palmdale | 20,452 | 2,202,587(0.93%)#22 | 41,288,572(0.05%)#254 |
| 23. | Elk Grove | 19,805 | 2,202,587(0.90%)#23 | 41,288,572(0.05%)#260 |
| 24. | Fairfield | 18,273 | 2,202,587(0.83%)#24 | 41,288,572(0.04%)#285 |
| 25. | Riverside | 18,264 | 2,202,587(0.83%)#25 | 41,288,572(0.04%)#286 |
| 26. | Fontana | 17,343 | 2,202,587(0.79%)#26 | 41,288,572(0.04%)#300 |
| 27. | Rancho Cucamonga | 15,440 | 2,202,587(0.70%)#27 | 41,288,572(0.04%)#342 |
| 28. | Hayward | 14,482 | 2,202,587(0.66%)#28 | 41,288,572(0.04%)#363 |
| 29. | Chula Vista | 14,315 | 2,202,587(0.65%)#29 | 41,288,572(0.03%)#367 |
| 30. | Westmont | 12,882 | 2,202,587(0.58%)#30 | 41,288,572(0.03%)#420 |
| 31. | Rialto | 12,650 | 2,202,587(0.57%)#31 | 41,288,572(0.03%)#429 |
| 32. | Gardena | 11,959 | 2,202,587(0.54%)#32 | 41,288,572(0.03%)#454 |
| 33. | Pittsburg | 11,601 | 2,202,587(0.53%)#33 | 41,288,572(0.03%)#474 |
| 34. | Pasadena | 11,022 | 2,202,587(0.50%)#34 | 41,288,572(0.03%)#498 |
| 35. | Modesto | 10,031 | 2,202,587(0.46%)#35 | 41,288,572(0.02%)#554 |
| 36. | Ontario | 9,842 | 2,202,587(0.45%)#36 | 41,288,572(0.02%)#561 |
| 37. | Bellflower | 9,587 | 2,202,587(0.44%)#37 | 41,288,572(0.02%)#579 |
| 38. | Santa Clarita | 9,432 | 2,202,587(0.43%)#38 | 41,288,572(0.02%)#589 |
| 39. | Berkeley | 9,428 | 2,202,587(0.43%)#39 | 41,288,572(0.02%)#590 |
| 40. | Corona | 9,377 | 2,202,587(0.43%)#40 | 41,288,572(0.02%)#592 |
| 41. | San Leandro | 9,324 | 2,202,587(0.42%)#41 | 41,288,572(0.02%)#603 |
| 42. | West Rancho Dominguez | 9,198 | 2,202,587(0.42%)#42 | 41,288,572(0.02%)#610 |
| 43. | Anaheim | 9,047 | 2,202,587(0.41%)#43 | 41,288,572(0.02%)#622 |
| 44. | View Park Windsor Hills | 8,846 | 2,202,587(0.40%)#44 | 41,288,572(0.02%)#636 |
| 45. | Rancho Cordova | 8,623 | 2,202,587(0.39%)#45 | 41,288,572(0.02%)#650 |
| 46. | Vacaville | 8,524 | 2,202,587(0.39%)#46 | 41,288,572(0.02%)#659 |
| 47. | Arden Arcade | 8,071 | 2,202,587(0.37%)#47 | 41,288,572(0.02%)#698 |
| 48. | Altadena | 7,789 | 2,202,587(0.35%)#48 | 41,288,572(0.02%)#725 |
| 49. | Pomona | 7,750 | 2,202,587(0.35%)#49 | 41,288,572(0.02%)#731 |
| 50. | Hemet | 7,577 | 2,202,587(0.34%)#50 | 41,288,572(0.02%)#747 |
| 51. | Oceanside | 7,517 | 2,202,587(0.34%)#51 | 41,288,572(0.02%)#753 |
| 52. | Perris | 7,338 | 2,202,587(0.33%)#52 | 41,288,572(0.02%)#764 |
| 53. | Fremont | 7,256 | 2,202,587(0.33%)#53 | 41,288,572(0.02%)#773 |
| 54. | Menifee | 7,230 | 2,202,587(0.33%)#54 | 41,288,572(0.02%)#776 |
| 55. | Lakewood | 7,108 | 2,202,587(0.32%)#55 | 41,288,572(0.02%)#786 |
| 56. | El Cajon | 6,634 | 2,202,587(0.30%)#56 | 41,288,572(0.02%)#822 |
| 57. | Brentwood | 6,577 | 2,202,587(0.30%)#57 | 41,288,572(0.02%)#832 |
| 58. | Suisun City | 6,473 | 2,202,587(0.29%)#58 | 41,288,572(0.02%)#842 |
| 59. | Murrieta | 6,109 | 2,202,587(0.28%)#59 | 41,288,572(0.01%)#890 |
| 60. | Apple Valley | 6,091 | 2,202,587(0.28%)#60 | 41,288,572(0.01%)#891 |
| 61. | Chino | 6,060 | 2,202,587(0.28%)#61 | 41,288,572(0.01%)#898 |
| 62. | Irvine | 5,978 | 2,202,587(0.27%)#62 | 41,288,572(0.01%)#906 |
| 63. | Adelanto | 5,800 | 2,202,587(0.26%)#63 | 41,288,572(0.01%)#932 |
| 64. | Castro Valley | 5,711 | 2,202,587(0.26%)#64 | 41,288,572(0.01%)#945 |
| 65. | Upland | 5,683 | 2,202,587(0.26%)#65 | 41,288,572(0.01%)#950 |
| 66. | Lynwood | 5,661 | 2,202,587(0.26%)#66 | 41,288,572(0.01%)#953 |
| 67. | Beaumont | 5,486 | 2,202,587(0.25%)#67 | 41,288,572(0.01%)#977 |
| 68. | Tracy | 5,358 | 2,202,587(0.24%)#68 | 41,288,572(0.01%)#998 |
| 69. | Alameda | 5,323 | 2,202,587(0.24%)#69 | 41,288,572(0.01%)#1,002 |
| 70. | La Presa | 5,270 | 2,202,587(0.24%)#70 | 41,288,572(0.01%)#1,012 |
| 71. | Florin | 5,107 | 2,202,587(0.23%)#71 | 41,288,572(0.01%)#1,037 |
| 72. | Hercules | 5,084 | 2,202,587(0.23%)#72 | 41,288,572(0.01%)#1,043 |
| 73. | West Athens | 5,057 | 2,202,587(0.23%)#73 | 41,288,572(0.01%)#1,048 |
| 74. | Eastvale | 5,050 | 2,202,587(0.23%)#74 | 41,288,572(0.01%)#1,049 |
| 75. | Antelope | 4,953 | 2,202,587(0.22%)#75 | 41,288,572(0.01%)#1,064 |
| 76. | Colton | 4,911 | 2,202,587(0.22%)#76 | 41,288,572(0.01%)#1,072 |
| 77. | Torrance | 4,879 | 2,202,587(0.22%)#77 | 41,288,572(0.01%)#1,077 |
| 78. | Santa Monica | 4,854 | 2,202,587(0.22%)#78 | 41,288,572(0.01%)#1,081 |
| 79. | North Highlands | 4,763 | 2,202,587(0.22%)#79 | 41,288,572(0.01%)#1,098 |
| 80. | Paramount | 4,751 | 2,202,587(0.22%)#80 | 41,288,572(0.01%)#1,099 |
| 81. | Foothill Farms | 4,742 | 2,202,587(0.22%)#81 | 41,288,572(0.01%)#1,101 |
| 82. | Concord | 4,695 | 2,202,587(0.21%)#82 | 41,288,572(0.01%)#1,108 |
| 83. | La Mesa | 4,681 | 2,202,587(0.21%)#83 | 41,288,572(0.01%)#1,115 |
| 84. | West Covina | 4,668 | 2,202,587(0.21%)#84 | 41,288,572(0.01%)#1,119 |
| 85. | Norwalk | 4,617 | 2,202,587(0.21%)#85 | 41,288,572(0.01%)#1,129 |
| 86. | Carmichael | 4,588 | 2,202,587(0.21%)#86 | 41,288,572(0.01%)#1,134 |
| 87. | Lake Elsinore | 4,520 | 2,202,587(0.21%)#87 | 41,288,572(0.01%)#1,151 |
| 88. | Temecula | 4,322 | 2,202,587(0.20%)#88 | 41,288,572(0.01%)#1,194 |
| 89. | Ladera Heights | 4,310 | 2,202,587(0.20%)#89 | 41,288,572(0.01%)#1,196 |
| 90. | Downey | 4,285 | 2,202,587(0.19%)#90 | 41,288,572(0.01%)#1,204 |
| 91. | Lemon Grove | 4,255 | 2,202,587(0.19%)#91 | 41,288,572(0.01%)#1,216 |
| 92. | Spring Valley Cdp San Diego County | 4,238 | 2,202,587(0.19%)#92 | 41,288,572(0.01%)#1,221 |
| 93. | San Jacinto | 4,205 | 2,202,587(0.19%)#93 | 41,288,572(0.01%)#1,231 |
| 94. | Willowbrook | 4,169 | 2,202,587(0.19%)#94 | 41,288,572(0.01%)#1,239 |
| 95. | Cerritos | 4,158 | 2,202,587(0.19%)#95 | 41,288,572(0.01%)#1,241 |
| 96. | Vineyard | 4,093 | 2,202,587(0.19%)#96 | 41,288,572(0.01%)#1,251 |
| 97. | Highland | 4,090 | 2,202,587(0.19%)#97 | 41,288,572(0.01%)#1,253 |
| 98. | Hanford | 4,058 | 2,202,587(0.18%)#98 | 41,288,572(0.01%)#1,264 |
| 99. | Oxnard | 3,967 | 2,202,587(0.18%)#99 | 41,288,572(0.01%)#1,295 |
| 100. | Merced | 3,967 | 2,202,587(0.18%)#100 | 41,288,572(0.01%)#1,296 |
Common Questions
What are the Top 10 Cities with the Largest Black / African American Community in California?
Top 10 Cities with the Largest Black / African American Community in California are:
#1
332,173
#2
95,412
#3
81,231
#4
65,978
#5
55,623
#6
44,058
#7
42,225
#8
37,257
#9
36,872
#10
36,296
What city has the Largest Black / African American Community in California?
Los Angeles has the Largest Black / African American Community in California with 332,173.
What is the Total Black / African American Population in the State of California?
Total Black / African American Population in California is 2,202,587.
What is the Total Black / African American Population in the United States?
Total Black / African American Population in the United States is 41,288,572.