Cities with the Youngest Male Population in California
RELATED REPORTS & OPTIONS
Youngest Population | Male
California
Compare Cities
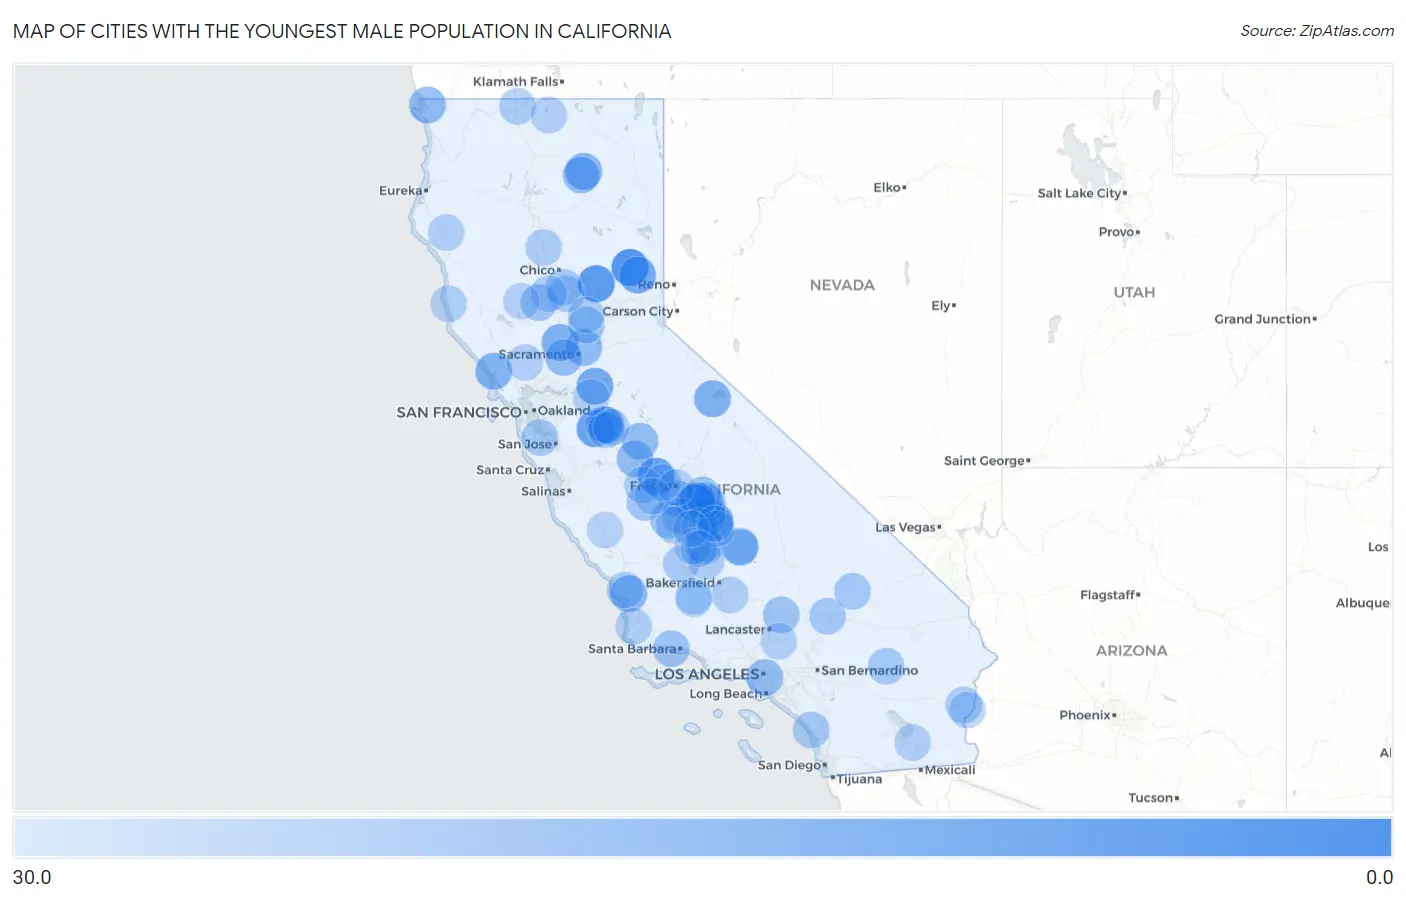
Map of Cities with the Youngest Male Population in California
30.0
0.0
Cities with the Youngest Male Population in California
| City | Median Age | vs State | vs National | |
| 1. | Delft Colony | 2.8 | 36.3(-33.5)#1 | 37.4(-34.6)#4 |
| 2. | Clio | 7.7 | 36.3(-28.6)#2 | 37.4(-29.7)#43 |
| 3. | Clipper Mills | 9.7 | 36.3(-26.6)#3 | 37.4(-27.7)#69 |
| 4. | Tonyville | 11.3 | 36.3(-25.0)#4 | 37.4(-26.1)#112 |
| 5. | Westley | 12.0 | 36.3(-24.3)#5 | 37.4(-25.4)#127 |
| 6. | La Vina | 12.1 | 36.3(-24.2)#6 | 37.4(-25.3)#132 |
| 7. | Linnell Camp | 13.7 | 36.3(-22.6)#7 | 37.4(-23.7)#184 |
| 8. | Calpine | 13.8 | 36.3(-22.5)#8 | 37.4(-23.6)#191 |
| 9. | Victor | 14.3 | 36.3(-22.0)#9 | 37.4(-23.1)#209 |
| 10. | Riverdale Park | 15.2 | 36.3(-21.1)#10 | 37.4(-22.2)#256 |
| 11. | Lee Vining | 15.8 | 36.3(-20.5)#11 | 37.4(-21.6)#288 |
| 12. | Yolo | 16.0 | 36.3(-20.3)#12 | 37.4(-21.4)#300 |
| 13. | Bodega | 16.5 | 36.3(-19.8)#13 | 37.4(-20.9)#318 |
| 14. | Edna | 17.3 | 36.3(-19.0)#14 | 37.4(-20.1)#364 |
| 15. | Mcarthur | 17.5 | 36.3(-18.8)#15 | 37.4(-19.9)#376 |
| 16. | Bret Harte | 18.4 | 36.3(-17.9)#16 | 37.4(-19.0)#451 |
| 17. | California Hot Springs | 18.8 | 36.3(-17.5)#17 | 37.4(-18.6)#496 |
| 18. | Smith River | 18.9 | 36.3(-17.4)#18 | 37.4(-18.5)#500 |
| 19. | Fall River Mills | 18.9 | 36.3(-17.4)#19 | 37.4(-18.5)#502 |
| 20. | California Polytechnic State University | 19.3 | 36.3(-17.0)#20 | 37.4(-18.1)#533 |
| 21. | Di Giorgio | 19.4 | 36.3(-16.9)#21 | 37.4(-18.0)#549 |
| 22. | Sonoma State University | 19.5 | 36.3(-16.8)#22 | 37.4(-17.9)#556 |
| 23. | Mcclellan Park | 19.5 | 36.3(-16.8)#23 | 37.4(-17.9)#558 |
| 24. | University Of California Merced | 19.5 | 36.3(-16.8)#24 | 37.4(-17.9)#559 |
| 25. | El Nido | 19.9 | 36.3(-16.4)#25 | 37.4(-17.5)#630 |
| 26. | University Of California Davis | 20.0 | 36.3(-16.3)#26 | 37.4(-17.4)#636 |
| 27. | Pepperdine University | 20.2 | 36.3(-16.1)#27 | 37.4(-17.2)#663 |
| 28. | Vernon | 20.2 | 36.3(-16.1)#28 | 37.4(-17.2)#672 |
| 29. | Monmouth | 20.3 | 36.3(-16.0)#29 | 37.4(-17.1)#693 |
| 30. | University Of California-Santa Barbara | 20.4 | 36.3(-15.9)#30 | 37.4(-17.0)#701 |
| 31. | Teviston | 20.9 | 36.3(-15.4)#31 | 37.4(-16.5)#777 |
| 32. | Oak Run | 20.9 | 36.3(-15.4)#32 | 37.4(-16.5)#778 |
| 33. | Isla Vista | 21.4 | 36.3(-14.9)#33 | 37.4(-16.0)#844 |
| 34. | Ivanhoe | 21.5 | 36.3(-14.8)#34 | 37.4(-15.9)#860 |
| 35. | Edwards Afb | 21.5 | 36.3(-14.8)#35 | 37.4(-15.9)#863 |
| 36. | Seville | 21.5 | 36.3(-14.8)#36 | 37.4(-15.9)#872 |
| 37. | Camp Pendleton Mainside | 21.6 | 36.3(-14.7)#37 | 37.4(-15.8)#883 |
| 38. | San Miguel Cdp San Luis Obispo County | 21.6 | 36.3(-14.7)#38 | 37.4(-15.8)#889 |
| 39. | Orange Cove | 21.7 | 36.3(-14.6)#39 | 37.4(-15.7)#907 |
| 40. | Maxwell | 21.7 | 36.3(-14.6)#40 | 37.4(-15.7)#916 |
| 41. | El Centro Naval Air Facility | 21.9 | 36.3(-14.4)#41 | 37.4(-15.5)#978 |
| 42. | Lemoore Station | 22.0 | 36.3(-14.3)#42 | 37.4(-15.4)#1,001 |
| 43. | Sheridan | 22.0 | 36.3(-14.3)#43 | 37.4(-15.4)#1,008 |
| 44. | Cantua Creek | 22.4 | 36.3(-13.9)#44 | 37.4(-15.0)#1,087 |
| 45. | Camp Pendleton South | 22.8 | 36.3(-13.5)#45 | 37.4(-14.6)#1,162 |
| 46. | Lenwood | 22.9 | 36.3(-13.4)#46 | 37.4(-14.5)#1,204 |
| 47. | Fort Irwin | 23.0 | 36.3(-13.3)#47 | 37.4(-14.4)#1,232 |
| 48. | Earlimart | 23.0 | 36.3(-13.3)#48 | 37.4(-14.4)#1,233 |
| 49. | Fort Hunter Liggett | 23.1 | 36.3(-13.2)#49 | 37.4(-14.3)#1,252 |
| 50. | Twentynine Palms | 23.2 | 36.3(-13.1)#50 | 37.4(-14.2)#1,262 |
| 51. | Stanford | 23.3 | 36.3(-13.0)#51 | 37.4(-14.1)#1,282 |
| 52. | Biggs | 23.3 | 36.3(-13.0)#52 | 37.4(-14.1)#1,284 |
| 53. | Lost Hills | 23.4 | 36.3(-12.9)#53 | 37.4(-14.0)#1,309 |
| 54. | Millerton | 23.7 | 36.3(-12.6)#54 | 37.4(-13.7)#1,372 |
| 55. | Richvale | 23.8 | 36.3(-12.5)#55 | 37.4(-13.6)#1,408 |
| 56. | Armona | 23.9 | 36.3(-12.4)#56 | 37.4(-13.5)#1,422 |
| 57. | Stratford | 23.9 | 36.3(-12.4)#57 | 37.4(-13.5)#1,425 |
| 58. | Mesa Verde | 23.9 | 36.3(-12.4)#58 | 37.4(-13.5)#1,427 |
| 59. | Hornbrook | 23.9 | 36.3(-12.4)#59 | 37.4(-13.5)#1,439 |
| 60. | Pine Flat | 24.0 | 36.3(-12.3)#60 | 37.4(-13.4)#1,467 |
| 61. | Beale Afb | 24.1 | 36.3(-12.2)#61 | 37.4(-13.3)#1,481 |
| 62. | El Adobe | 24.1 | 36.3(-12.2)#62 | 37.4(-13.3)#1,487 |
| 63. | Los Molinos | 24.2 | 36.3(-12.1)#63 | 37.4(-13.2)#1,496 |
| 64. | East Orosi | 24.2 | 36.3(-12.1)#64 | 37.4(-13.2)#1,499 |
| 65. | Mendota | 24.4 | 36.3(-11.9)#65 | 37.4(-13.0)#1,527 |
| 66. | Potomac Park | 24.4 | 36.3(-11.9)#66 | 37.4(-13.0)#1,530 |
| 67. | San Luis Obispo | 24.5 | 36.3(-11.8)#67 | 37.4(-12.9)#1,542 |
| 68. | Biola | 24.5 | 36.3(-11.8)#68 | 37.4(-12.9)#1,553 |
| 69. | Matheny | 24.5 | 36.3(-11.8)#69 | 37.4(-12.9)#1,555 |
| 70. | Vandenberg Afb | 24.6 | 36.3(-11.7)#70 | 37.4(-12.8)#1,576 |
| 71. | Monterey Park Tract | 24.6 | 36.3(-11.7)#71 | 37.4(-12.8)#1,593 |
| 72. | Princeton | 24.7 | 36.3(-11.6)#72 | 37.4(-12.7)#1,610 |
| 73. | Knights Ferry | 24.7 | 36.3(-11.6)#73 | 37.4(-12.7)#1,622 |
| 74. | Arvin | 24.8 | 36.3(-11.5)#74 | 37.4(-12.6)#1,626 |
| 75. | East Bakersfield | 24.8 | 36.3(-11.5)#75 | 37.4(-12.6)#1,630 |
| 76. | August | 24.8 | 36.3(-11.5)#76 | 37.4(-12.6)#1,631 |
| 77. | Little River | 24.8 | 36.3(-11.5)#77 | 37.4(-12.6)#1,645 |
| 78. | Mcfarland | 24.9 | 36.3(-11.4)#78 | 37.4(-12.5)#1,657 |
| 79. | San Joaquin | 24.9 | 36.3(-11.4)#79 | 37.4(-12.5)#1,658 |
| 80. | Westmorland | 24.9 | 36.3(-11.4)#80 | 37.4(-12.5)#1,661 |
| 81. | Stebbins | 24.9 | 36.3(-11.4)#81 | 37.4(-12.5)#1,668 |
| 82. | Miranda | 24.9 | 36.3(-11.4)#82 | 37.4(-12.5)#1,671 |
| 83. | Rutherford | 25.0 | 36.3(-11.3)#83 | 37.4(-12.4)#1,710 |
| 84. | Strathmore | 25.1 | 36.3(-11.2)#84 | 37.4(-12.3)#1,717 |
| 85. | Calwa | 25.1 | 36.3(-11.2)#85 | 37.4(-12.3)#1,720 |
| 86. | Ripley | 25.1 | 36.3(-11.2)#86 | 37.4(-12.3)#1,726 |
| 87. | Alpaugh | 25.2 | 36.3(-11.1)#87 | 37.4(-12.2)#1,740 |
| 88. | Keyes | 25.3 | 36.3(-11.0)#88 | 37.4(-12.1)#1,754 |
| 89. | Littlerock | 25.3 | 36.3(-11.0)#89 | 37.4(-12.1)#1,760 |
| 90. | Mount Hebron | 25.3 | 36.3(-11.0)#90 | 37.4(-12.1)#1,776 |
| 91. | Woody | 25.3 | 36.3(-11.0)#91 | 37.4(-12.1)#1,778 |
| 92. | Dinuba | 25.7 | 36.3(-10.6)#92 | 37.4(-11.7)#1,854 |
| 93. | Ford City | 25.7 | 36.3(-10.6)#93 | 37.4(-11.7)#1,862 |
| 94. | Waukena | 25.7 | 36.3(-10.6)#94 | 37.4(-11.7)#1,887 |
| 95. | Lindsay | 25.8 | 36.3(-10.5)#95 | 37.4(-11.6)#1,890 |
| 96. | Benton Park | 25.8 | 36.3(-10.5)#96 | 37.4(-11.6)#1,892 |
| 97. | South Taft | 25.8 | 36.3(-10.5)#97 | 37.4(-11.6)#1,897 |
| 98. | San Lucas | 25.8 | 36.3(-10.5)#98 | 37.4(-11.6)#1,913 |
| 99. | Allensworth | 25.9 | 36.3(-10.4)#99 | 37.4(-11.5)#1,947 |
| 100. | Lodoga | 25.9 | 36.3(-10.4)#100 | 37.4(-11.5)#1,958 |
Common Questions
What are the Top 10 Cities with the Youngest Male Population in California?
Top 10 Cities with the Youngest Male Population in California are:
#1
2.8
#2
7.7
#3
9.7
#4
11.3
#5
12.0
#6
12.1
#7
13.7
#8
13.8
#9
14.3
#10
15.2
What city has the Youngest Male Population in California?
Delft Colony has the Youngest Male Population in California with 2.8.
What is the Median Male Age in the State of California?
Median Male Age in California is 36.3.
What is the Median Male Age in the United States?
Median Male Age in the United States is 37.4.