Cities with the Most Immigrants from Singapore in California
RELATED REPORTS & OPTIONS
Singapore
California
Compare Cities
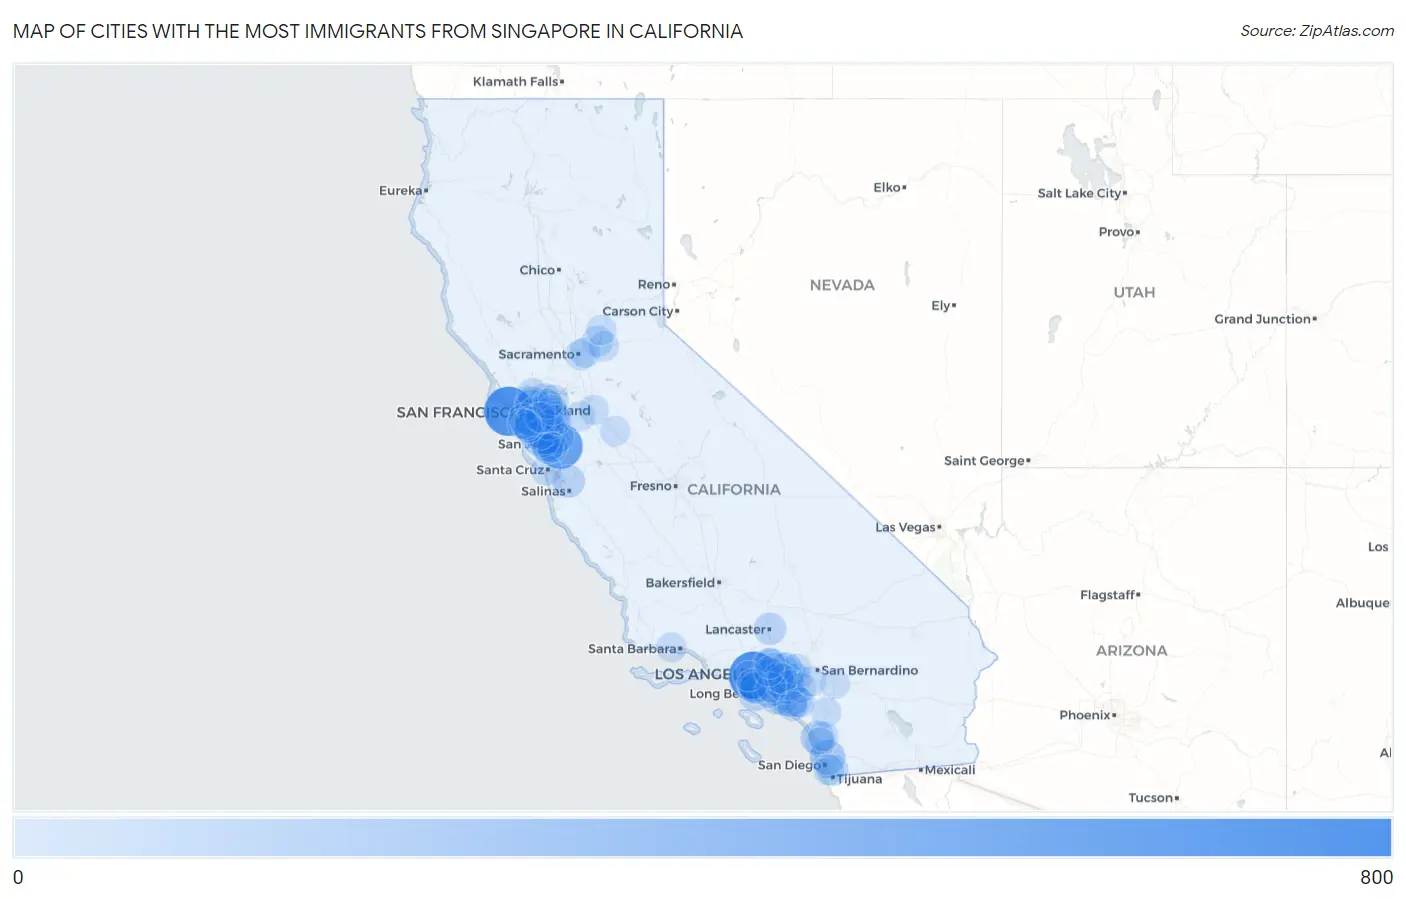
Map of Cities with the Most Immigrants from Singapore in California
0
800
Cities with the Most Immigrants from Singapore in California
| City | Singapore | vs State | vs National | |
| 1. | Los Angeles | 799 | 10,213(7.82%)#1 | 35,435(2.25%)#2 |
| 2. | San Francisco | 780 | 10,213(7.64%)#2 | 35,435(2.20%)#3 |
| 3. | San Jose | 630 | 10,213(6.17%)#3 | 35,435(1.78%)#4 |
| 4. | Fremont | 326 | 10,213(3.19%)#4 | 35,435(0.92%)#9 |
| 5. | Irvine | 261 | 10,213(2.56%)#5 | 35,435(0.74%)#12 |
| 6. | Berkeley | 251 | 10,213(2.46%)#6 | 35,435(0.71%)#14 |
| 7. | Santa Clara | 243 | 10,213(2.38%)#7 | 35,435(0.69%)#15 |
| 8. | San Diego | 229 | 10,213(2.24%)#8 | 35,435(0.65%)#17 |
| 9. | Oakland | 207 | 10,213(2.03%)#9 | 35,435(0.58%)#18 |
| 10. | Milpitas | 201 | 10,213(1.97%)#10 | 35,435(0.57%)#20 |
| 11. | Palo Alto | 200 | 10,213(1.96%)#11 | 35,435(0.56%)#23 |
| 12. | Pasadena | 197 | 10,213(1.93%)#12 | 35,435(0.56%)#26 |
| 13. | Carlsbad | 162 | 10,213(1.59%)#13 | 35,435(0.46%)#29 |
| 14. | Sunnyvale | 156 | 10,213(1.53%)#14 | 35,435(0.44%)#31 |
| 15. | San Mateo | 140 | 10,213(1.37%)#15 | 35,435(0.40%)#37 |
| 16. | Cupertino | 138 | 10,213(1.35%)#16 | 35,435(0.39%)#39 |
| 17. | Foster City | 138 | 10,213(1.35%)#17 | 35,435(0.39%)#40 |
| 18. | Redwood City | 124 | 10,213(1.21%)#18 | 35,435(0.35%)#45 |
| 19. | Rancho Palos Verdes | 113 | 10,213(1.11%)#19 | 35,435(0.32%)#46 |
| 20. | Prunedale | 110 | 10,213(1.08%)#20 | 35,435(0.31%)#48 |
| 21. | Lancaster | 109 | 10,213(1.07%)#21 | 35,435(0.31%)#50 |
| 22. | Redondo Beach | 107 | 10,213(1.05%)#22 | 35,435(0.30%)#54 |
| 23. | Arcadia | 99 | 10,213(0.97%)#23 | 35,435(0.28%)#59 |
| 24. | San Carlos | 87 | 10,213(0.85%)#24 | 35,435(0.25%)#71 |
| 25. | Chula Vista | 81 | 10,213(0.79%)#25 | 35,435(0.23%)#78 |
| 26. | Newark | 78 | 10,213(0.76%)#26 | 35,435(0.22%)#80 |
| 27. | Huntington Beach | 75 | 10,213(0.73%)#27 | 35,435(0.21%)#83 |
| 28. | San Ramon | 75 | 10,213(0.73%)#28 | 35,435(0.21%)#85 |
| 29. | Burlingame | 68 | 10,213(0.67%)#29 | 35,435(0.19%)#93 |
| 30. | Mountain View | 67 | 10,213(0.66%)#30 | 35,435(0.19%)#96 |
| 31. | Hayward | 63 | 10,213(0.62%)#31 | 35,435(0.18%)#105 |
| 32. | Cypress | 63 | 10,213(0.62%)#32 | 35,435(0.18%)#106 |
| 33. | Los Altos | 63 | 10,213(0.62%)#33 | 35,435(0.18%)#107 |
| 34. | Lake Forest | 62 | 10,213(0.61%)#34 | 35,435(0.17%)#109 |
| 35. | Alameda | 61 | 10,213(0.60%)#35 | 35,435(0.17%)#112 |
| 36. | Pleasant Hill | 61 | 10,213(0.60%)#36 | 35,435(0.17%)#113 |
| 37. | Pomona | 58 | 10,213(0.57%)#37 | 35,435(0.16%)#118 |
| 38. | Albany | 57 | 10,213(0.56%)#38 | 35,435(0.16%)#122 |
| 39. | Granite Bay | 56 | 10,213(0.55%)#39 | 35,435(0.16%)#124 |
| 40. | Diamond Bar | 54 | 10,213(0.53%)#40 | 35,435(0.15%)#129 |
| 41. | Torrance | 52 | 10,213(0.51%)#41 | 35,435(0.15%)#132 |
| 42. | Santa Cruz | 52 | 10,213(0.51%)#42 | 35,435(0.15%)#133 |
| 43. | Costa Mesa | 51 | 10,213(0.50%)#43 | 35,435(0.14%)#135 |
| 44. | Long Beach | 50 | 10,213(0.49%)#44 | 35,435(0.14%)#139 |
| 45. | Hercules | 50 | 10,213(0.49%)#45 | 35,435(0.14%)#140 |
| 46. | Anaheim | 49 | 10,213(0.48%)#46 | 35,435(0.14%)#141 |
| 47. | Sacramento | 47 | 10,213(0.46%)#47 | 35,435(0.13%)#147 |
| 48. | La Habra | 46 | 10,213(0.45%)#48 | 35,435(0.13%)#153 |
| 49. | Menlo Park | 46 | 10,213(0.45%)#49 | 35,435(0.13%)#154 |
| 50. | Monterey Park | 45 | 10,213(0.44%)#50 | 35,435(0.13%)#157 |
| 51. | Fullerton | 44 | 10,213(0.43%)#51 | 35,435(0.12%)#159 |
| 52. | Chino | 44 | 10,213(0.43%)#52 | 35,435(0.12%)#160 |
| 53. | Manhattan Beach | 44 | 10,213(0.43%)#53 | 35,435(0.12%)#161 |
| 54. | National City | 42 | 10,213(0.41%)#54 | 35,435(0.12%)#167 |
| 55. | Hermosa Beach | 42 | 10,213(0.41%)#55 | 35,435(0.12%)#168 |
| 56. | Ashland | 41 | 10,213(0.40%)#56 | 35,435(0.12%)#172 |
| 57. | Daly City | 39 | 10,213(0.38%)#57 | 35,435(0.11%)#179 |
| 58. | Alamo | 39 | 10,213(0.38%)#58 | 35,435(0.11%)#181 |
| 59. | Eastern Goleta Valley | 38 | 10,213(0.37%)#59 | 35,435(0.11%)#182 |
| 60. | Atherton | 38 | 10,213(0.37%)#60 | 35,435(0.11%)#183 |
| 61. | Arden Arcade | 37 | 10,213(0.36%)#61 | 35,435(0.10%)#185 |
| 62. | Dublin | 37 | 10,213(0.36%)#62 | 35,435(0.10%)#186 |
| 63. | Union City | 37 | 10,213(0.36%)#63 | 35,435(0.10%)#187 |
| 64. | Azusa | 37 | 10,213(0.36%)#64 | 35,435(0.10%)#189 |
| 65. | El Dorado Hills | 37 | 10,213(0.36%)#65 | 35,435(0.10%)#190 |
| 66. | Auburn | 37 | 10,213(0.36%)#66 | 35,435(0.10%)#192 |
| 67. | El Segundo | 36 | 10,213(0.35%)#67 | 35,435(0.10%)#199 |
| 68. | Hillsborough | 36 | 10,213(0.35%)#68 | 35,435(0.10%)#201 |
| 69. | South San Francisco | 34 | 10,213(0.33%)#69 | 35,435(0.10%)#209 |
| 70. | Glendora | 34 | 10,213(0.33%)#70 | 35,435(0.10%)#210 |
| 71. | Pacifica | 34 | 10,213(0.33%)#71 | 35,435(0.10%)#211 |
| 72. | Clayton | 34 | 10,213(0.33%)#72 | 35,435(0.10%)#214 |
| 73. | Santa Monica | 33 | 10,213(0.32%)#73 | 35,435(0.09%)#216 |
| 74. | Strawberry Cdp Marin County | 33 | 10,213(0.32%)#74 | 35,435(0.09%)#219 |
| 75. | Pleasanton | 32 | 10,213(0.31%)#75 | 35,435(0.09%)#221 |
| 76. | Goleta | 32 | 10,213(0.31%)#76 | 35,435(0.09%)#225 |
| 77. | Saratoga | 32 | 10,213(0.31%)#77 | 35,435(0.09%)#226 |
| 78. | Tracy | 30 | 10,213(0.29%)#78 | 35,435(0.08%)#231 |
| 79. | Turlock | 30 | 10,213(0.29%)#79 | 35,435(0.08%)#232 |
| 80. | Temecula | 28 | 10,213(0.27%)#80 | 35,435(0.08%)#245 |
| 81. | San Marcos | 27 | 10,213(0.26%)#81 | 35,435(0.08%)#251 |
| 82. | Upland | 27 | 10,213(0.26%)#82 | 35,435(0.08%)#252 |
| 83. | Yorba Linda | 27 | 10,213(0.26%)#83 | 35,435(0.08%)#254 |
| 84. | Danville | 27 | 10,213(0.26%)#84 | 35,435(0.08%)#255 |
| 85. | Corona | 26 | 10,213(0.25%)#85 | 35,435(0.07%)#259 |
| 86. | Walnut Creek | 26 | 10,213(0.25%)#86 | 35,435(0.07%)#260 |
| 87. | Encinitas | 26 | 10,213(0.25%)#87 | 35,435(0.07%)#261 |
| 88. | Hacienda Heights | 26 | 10,213(0.25%)#88 | 35,435(0.07%)#262 |
| 89. | Rowland Heights | 26 | 10,213(0.25%)#89 | 35,435(0.07%)#264 |
| 90. | Manteca | 25 | 10,213(0.24%)#90 | 35,435(0.07%)#267 |
| 91. | Lakewood | 25 | 10,213(0.24%)#91 | 35,435(0.07%)#268 |
| 92. | Beaumont | 25 | 10,213(0.24%)#92 | 35,435(0.07%)#270 |
| 93. | Campbell | 25 | 10,213(0.24%)#93 | 35,435(0.07%)#271 |
| 94. | Millbrae | 25 | 10,213(0.24%)#94 | 35,435(0.07%)#272 |
| 95. | Rancho Santa Margarita | 24 | 10,213(0.23%)#95 | 35,435(0.07%)#280 |
| 96. | Aliso Viejo | 23 | 10,213(0.23%)#96 | 35,435(0.06%)#289 |
| 97. | Riverside | 22 | 10,213(0.22%)#97 | 35,435(0.06%)#295 |
| 98. | San Leandro | 22 | 10,213(0.22%)#98 | 35,435(0.06%)#297 |
| 99. | Alhambra | 22 | 10,213(0.22%)#99 | 35,435(0.06%)#298 |
| 100. | Altadena | 22 | 10,213(0.22%)#100 | 35,435(0.06%)#300 |
Common Questions
What are the Top 10 Cities with the Most Immigrants from Singapore in California?
Top 10 Cities with the Most Immigrants from Singapore in California are:
#1
799
#2
780
#3
630
#4
326
#5
261
#6
251
#7
243
#8
229
#9
207
#10
201
What city has the Most Immigrants from Singapore in California?
Los Angeles has the Most Immigrants from Singapore in California with 799.
What is the Total Immigrants from Singapore in the State of California?
Total Immigrants from Singapore in California is 10,213.
What is the Total Immigrants from Singapore in the United States?
Total Immigrants from Singapore in the United States is 35,435.