Cities with the Highest Percentage of Population Employed in Computer, Engineering & Science in California
RELATED REPORTS & OPTIONS
Computer, Engineering & Science
California
Compare Cities
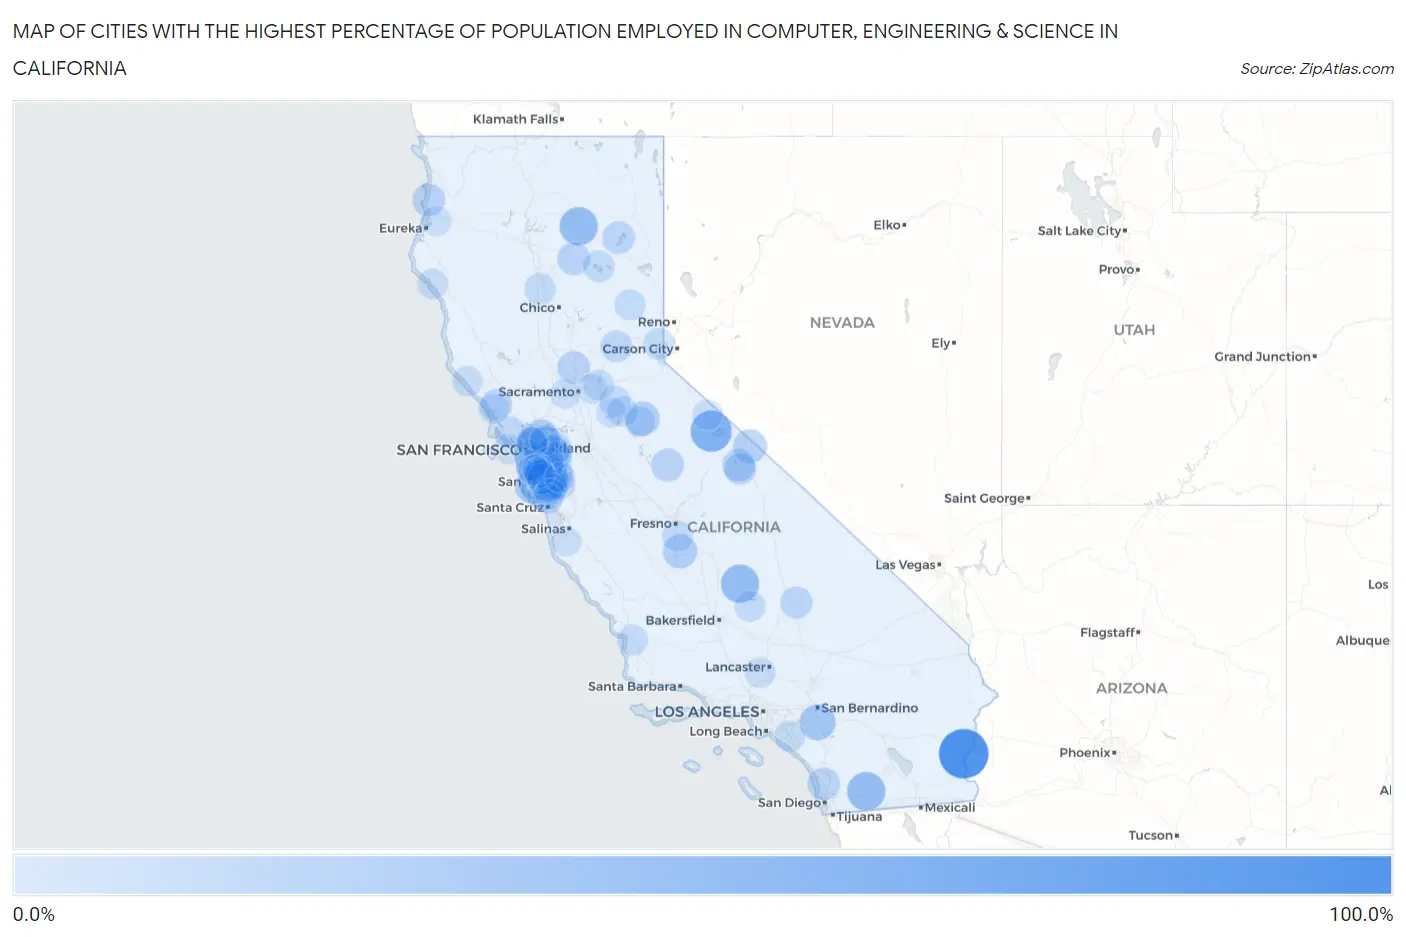
Map of Cities with the Highest Percentage of Population Employed in Computer, Engineering & Science in California
0.0%
100.0%
Cities with the Highest Percentage of Population Employed in Computer, Engineering & Science in California
| City | % Employed | vs State | vs National | |
| 1. | Palo Verde | 100.0% | 8.0%(+92.0)#1 | 6.8%(+93.2)#7 |
| 2. | Goodmanville | 100.0% | 8.0%(+92.0)#2 | 6.8%(+93.2)#10 |
| 3. | Mono City | 63.1% | 8.0%(+55.1)#3 | 6.8%(+56.3)#38 |
| 4. | Mount Laguna | 50.0% | 8.0%(+42.0)#4 | 6.8%(+43.2)#69 |
| 5. | Hat Creek | 50.0% | 8.0%(+42.0)#5 | 6.8%(+43.2)#70 |
| 6. | California Hot Springs | 50.0% | 8.0%(+42.0)#6 | 6.8%(+43.2)#72 |
| 7. | Cupertino | 40.7% | 8.0%(+32.7)#7 | 6.8%(+33.9)#113 |
| 8. | Sunnyvale | 39.9% | 8.0%(+31.9)#8 | 6.8%(+33.1)#118 |
| 9. | March Arb | 38.8% | 8.0%(+30.8)#9 | 6.8%(+32.0)#122 |
| 10. | Mountain View | 37.0% | 8.0%(+29.0)#10 | 6.8%(+30.2)#135 |
| 11. | Loma Mar | 35.9% | 8.0%(+27.9)#11 | 6.8%(+29.1)#147 |
| 12. | Stones Landing | 35.6% | 8.0%(+27.6)#12 | 6.8%(+28.8)#150 |
| 13. | Avery | 33.0% | 8.0%(+25.0)#13 | 6.8%(+26.2)#169 |
| 14. | Grangeville | 32.9% | 8.0%(+25.0)#14 | 6.8%(+26.2)#171 |
| 15. | Foster City | 32.9% | 8.0%(+25.0)#15 | 6.8%(+26.2)#172 |
| 16. | La Honda | 32.9% | 8.0%(+24.9)#16 | 6.8%(+26.1)#173 |
| 17. | Santa Clara | 32.7% | 8.0%(+24.8)#17 | 6.8%(+26.0)#175 |
| 18. | Alhambra Valley | 31.3% | 8.0%(+23.3)#18 | 6.8%(+24.5)#198 |
| 19. | Fremont | 31.0% | 8.0%(+23.0)#19 | 6.8%(+24.2)#205 |
| 20. | Benton | 30.8% | 8.0%(+22.8)#20 | 6.8%(+24.0)#209 |
| 21. | Palo Alto | 29.8% | 8.0%(+21.9)#21 | 6.8%(+23.1)#226 |
| 22. | Mountain Meadows | 28.8% | 8.0%(+20.8)#22 | 6.8%(+22.0)#240 |
| 23. | Milpitas | 28.4% | 8.0%(+20.5)#23 | 6.8%(+21.7)#253 |
| 24. | Bear Valley Cdp Alpine County | 28.3% | 8.0%(+20.3)#24 | 6.8%(+21.5)#256 |
| 25. | Dublin | 28.1% | 8.0%(+20.1)#25 | 6.8%(+21.3)#261 |
| 26. | Williams Canyon | 27.8% | 8.0%(+19.8)#26 | 6.8%(+21.0)#267 |
| 27. | Big Lagoon | 27.3% | 8.0%(+19.3)#27 | 6.8%(+20.5)#279 |
| 28. | Loyola | 27.1% | 8.0%(+19.2)#28 | 6.8%(+20.4)#283 |
| 29. | Mineral | 27.1% | 8.0%(+19.1)#29 | 6.8%(+20.3)#284 |
| 30. | Midpines | 27.0% | 8.0%(+19.1)#30 | 6.8%(+20.3)#286 |
| 31. | Petaluma Center | 26.9% | 8.0%(+19.0)#31 | 6.8%(+20.2)#288 |
| 32. | Los Altos | 26.8% | 8.0%(+18.8)#32 | 6.8%(+20.0)#293 |
| 33. | Sunny Slopes | 26.7% | 8.0%(+18.7)#33 | 6.8%(+19.9)#296 |
| 34. | Nicolaus | 26.5% | 8.0%(+18.6)#34 | 6.8%(+19.8)#298 |
| 35. | Fairbanks Ranch | 25.8% | 8.0%(+17.8)#35 | 6.8%(+19.0)#315 |
| 36. | Saratoga | 25.7% | 8.0%(+17.8)#36 | 6.8%(+18.9)#316 |
| 37. | Spaulding | 25.5% | 8.0%(+17.5)#37 | 6.8%(+18.7)#323 |
| 38. | Castle Hill | 24.6% | 8.0%(+16.6)#38 | 6.8%(+17.8)#342 |
| 39. | Ridgecrest | 24.5% | 8.0%(+16.5)#39 | 6.8%(+17.7)#345 |
| 40. | Occidental | 24.0% | 8.0%(+16.1)#40 | 6.8%(+17.3)#362 |
| 41. | Belmont | 23.5% | 8.0%(+15.5)#41 | 6.8%(+16.7)#378 |
| 42. | Swall Meadows | 23.3% | 8.0%(+15.3)#42 | 6.8%(+16.5)#383 |
| 43. | Dutch Flat | 23.1% | 8.0%(+15.1)#43 | 6.8%(+16.3)#396 |
| 44. | San Ramon | 23.1% | 8.0%(+15.1)#44 | 6.8%(+16.3)#398 |
| 45. | Brisbane | 22.6% | 8.0%(+14.6)#45 | 6.8%(+15.8)#419 |
| 46. | Fruitdale | 22.2% | 8.0%(+14.2)#46 | 6.8%(+15.4)#435 |
| 47. | Pleasanton | 22.1% | 8.0%(+14.1)#47 | 6.8%(+15.3)#439 |
| 48. | Menlo Park | 22.0% | 8.0%(+14.1)#48 | 6.8%(+15.3)#441 |
| 49. | Lagunitas Forest Knolls | 21.8% | 8.0%(+13.9)#49 | 6.8%(+15.1)#455 |
| 50. | West Menlo Park | 21.3% | 8.0%(+13.4)#50 | 6.8%(+14.6)#480 |
| 51. | Kensington | 21.2% | 8.0%(+13.2)#51 | 6.8%(+14.4)#491 |
| 52. | Lake Almanor Peninsula | 21.2% | 8.0%(+13.2)#52 | 6.8%(+14.4)#493 |
| 53. | Richfield | 21.2% | 8.0%(+13.2)#53 | 6.8%(+14.4)#494 |
| 54. | Camino Tassajara | 20.7% | 8.0%(+12.7)#54 | 6.8%(+13.9)#524 |
| 55. | Carnelian Bay | 20.5% | 8.0%(+12.6)#55 | 6.8%(+13.8)#531 |
| 56. | Boulder Creek | 20.2% | 8.0%(+12.3)#56 | 6.8%(+13.5)#547 |
| 57. | Emeryville | 20.1% | 8.0%(+12.2)#57 | 6.8%(+13.4)#549 |
| 58. | Drytown | 20.0% | 8.0%(+12.0)#58 | 6.8%(+13.2)#554 |
| 59. | Bodfish | 19.6% | 8.0%(+11.7)#59 | 6.8%(+12.9)#581 |
| 60. | Campbell | 19.5% | 8.0%(+11.5)#60 | 6.8%(+12.7)#592 |
| 61. | Clio | 19.4% | 8.0%(+11.5)#61 | 6.8%(+12.7)#595 |
| 62. | Monmouth | 19.4% | 8.0%(+11.4)#62 | 6.8%(+12.6)#602 |
| 63. | Albany | 19.3% | 8.0%(+11.3)#63 | 6.8%(+12.5)#608 |
| 64. | Los Berros | 19.0% | 8.0%(+11.1)#64 | 6.8%(+12.3)#628 |
| 65. | Newark | 19.0% | 8.0%(+11.0)#65 | 6.8%(+12.2)#637 |
| 66. | Irvine | 18.9% | 8.0%(+11.0)#66 | 6.8%(+12.2)#644 |
| 67. | Berkeley | 18.5% | 8.0%(+10.5)#67 | 6.8%(+11.7)#678 |
| 68. | Leona Valley | 18.4% | 8.0%(+10.4)#68 | 6.8%(+11.6)#694 |
| 69. | San Jose | 18.3% | 8.0%(+10.3)#69 | 6.8%(+11.5)#702 |
| 70. | Union City | 18.2% | 8.0%(+10.3)#70 | 6.8%(+11.5)#705 |
| 71. | Shelter Cove | 18.0% | 8.0%(+10.1)#71 | 6.8%(+11.3)#726 |
| 72. | San Mateo | 17.9% | 8.0%(+9.93)#72 | 6.8%(+11.1)#740 |
| 73. | Mokelumne Hill | 17.8% | 8.0%(+9.83)#73 | 6.8%(+11.0)#747 |
| 74. | Sea Ranch | 17.8% | 8.0%(+9.80)#74 | 6.8%(+11.0)#749 |
| 75. | Los Altos Hills | 17.7% | 8.0%(+9.75)#75 | 6.8%(+10.9)#756 |
| 76. | Folsom | 17.6% | 8.0%(+9.66)#76 | 6.8%(+10.9)#763 |
| 77. | Forest Meadows | 17.6% | 8.0%(+9.65)#77 | 6.8%(+10.9)#764 |
| 78. | El Centro Naval Air Facility | 17.5% | 8.0%(+9.58)#78 | 6.8%(+10.8)#768 |
| 79. | Green Valley Cdp Los Angeles County | 17.5% | 8.0%(+9.53)#79 | 6.8%(+10.7)#776 |
| 80. | Acalanes Ridge | 17.5% | 8.0%(+9.49)#80 | 6.8%(+10.7)#780 |
| 81. | San Carlos | 17.4% | 8.0%(+9.41)#81 | 6.8%(+10.6)#791 |
| 82. | Choctaw Valley | 17.2% | 8.0%(+9.28)#82 | 6.8%(+10.5)#803 |
| 83. | Highlands | 17.2% | 8.0%(+9.25)#83 | 6.8%(+10.5)#806 |
| 84. | Redwood City | 17.0% | 8.0%(+9.06)#84 | 6.8%(+10.3)#825 |
| 85. | Los Gatos | 17.0% | 8.0%(+9.04)#85 | 6.8%(+10.2)#830 |
| 86. | Bridgeport | 17.0% | 8.0%(+9.01)#86 | 6.8%(+10.2)#835 |
| 87. | Elfin Forest | 16.9% | 8.0%(+8.96)#87 | 6.8%(+10.2)#843 |
| 88. | Zayante | 16.9% | 8.0%(+8.89)#88 | 6.8%(+10.1)#854 |
| 89. | Stanford | 16.7% | 8.0%(+8.72)#89 | 6.8%(+9.92)#870 |
| 90. | Bodega | 16.5% | 8.0%(+8.51)#90 | 6.8%(+9.71)#896 |
| 91. | Atherton | 16.2% | 8.0%(+8.24)#91 | 6.8%(+9.44)#931 |
| 92. | Buena Vista | 16.1% | 8.0%(+8.17)#92 | 6.8%(+9.37)#943 |
| 93. | Blue Lake | 16.0% | 8.0%(+8.00)#93 | 6.8%(+9.20)#963 |
| 94. | Lexington Hills | 15.9% | 8.0%(+7.95)#94 | 6.8%(+9.15)#968 |
| 95. | Ridgecrest Heights | 15.9% | 8.0%(+7.91)#95 | 6.8%(+9.11)#980 |
| 96. | Gold River | 15.8% | 8.0%(+7.88)#96 | 6.8%(+9.08)#984 |
| 97. | San Francisco | 15.7% | 8.0%(+7.71)#97 | 6.8%(+8.91)#1,011 |
| 98. | East Foothills | 15.6% | 8.0%(+7.61)#98 | 6.8%(+8.81)#1,022 |
| 99. | Carmel Valley Village | 15.6% | 8.0%(+7.60)#99 | 6.8%(+8.80)#1,026 |
| 100. | Davis | 15.4% | 8.0%(+7.45)#100 | 6.8%(+8.65)#1,052 |
Common Questions
What are the Top 10 Cities with the Highest Percentage of Population Employed in Computer, Engineering & Science in California?
Top 10 Cities with the Highest Percentage of Population Employed in Computer, Engineering & Science in California are:
#1
100.0%
#2
63.1%
#3
50.0%
#4
50.0%
#5
50.0%
#6
40.7%
#7
39.9%
#8
38.8%
#9
37.0%
#10
35.9%
What city has the Highest Percentage of Population Employed in Computer, Engineering & Science in California?
Palo Verde has the Highest Percentage of Population Employed in Computer, Engineering & Science in California with 100.0%.
What is the Percentage of Population Employed in Computer, Engineering & Science in the State of California?
Percentage of Population Employed in Computer, Engineering & Science in California is 8.0%.
What is the Percentage of Population Employed in Computer, Engineering & Science in the United States?
Percentage of Population Employed in Computer, Engineering & Science in the United States is 6.8%.