Cities with the Most Immigrants from Hong Kong in California
RELATED REPORTS & OPTIONS
Hong Kong
California
Compare Cities
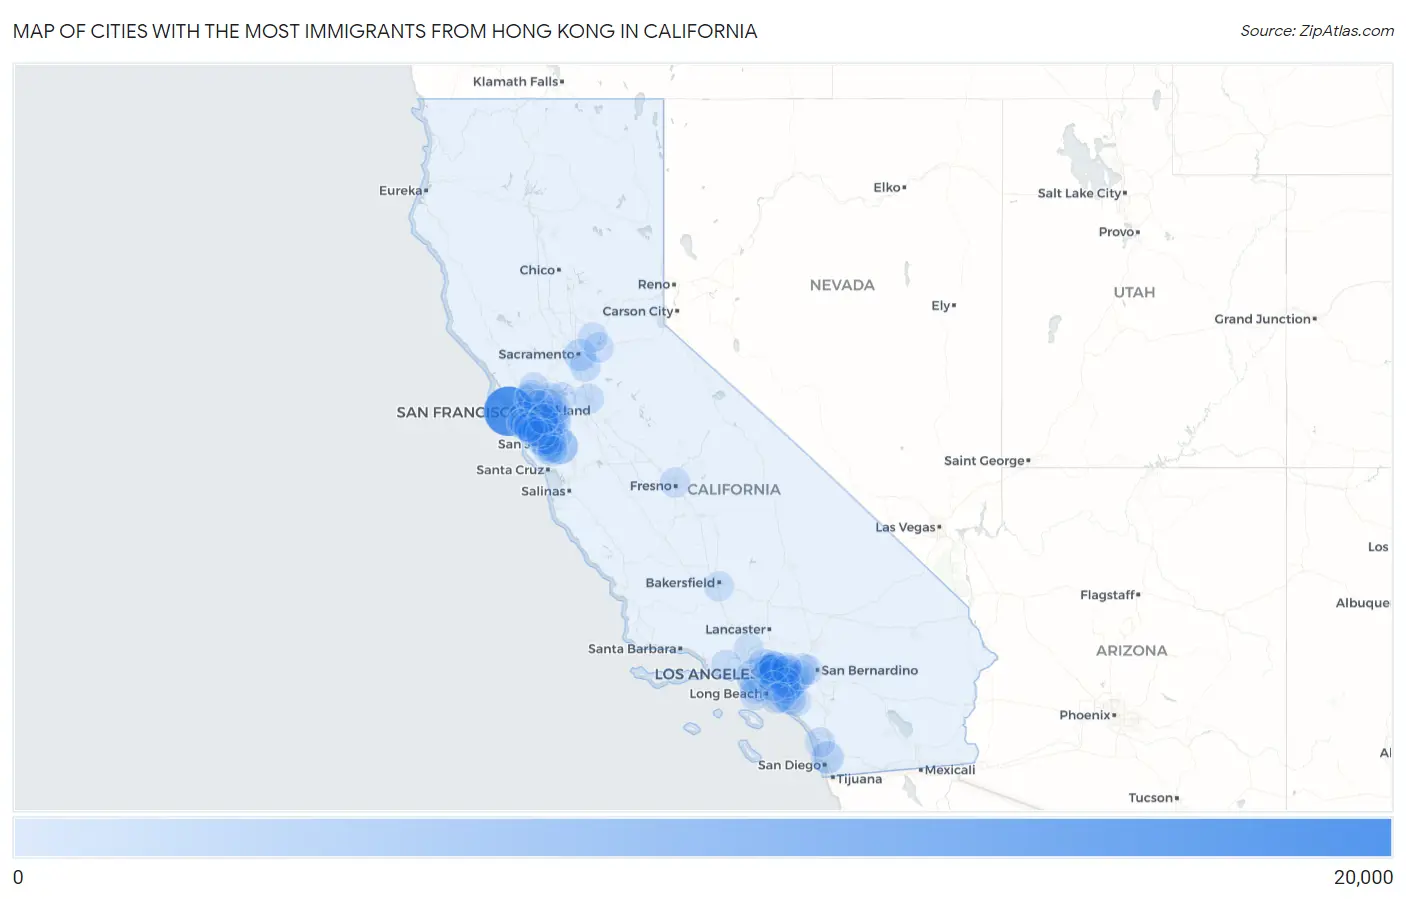
Map of Cities with the Most Immigrants from Hong Kong in California
0
20,000
Cities with the Most Immigrants from Hong Kong in California
| City | Hong Kong | vs State | vs National | |
| 1. | San Francisco | 15,201 | 105,215(14.45%)#1 | 239,302(6.35%)#2 |
| 2. | San Jose | 4,468 | 105,215(4.25%)#2 | 239,302(1.87%)#3 |
| 3. | Los Angeles | 3,557 | 105,215(3.38%)#3 | 239,302(1.49%)#4 |
| 4. | Daly City | 3,036 | 105,215(2.89%)#4 | 239,302(1.27%)#5 |
| 5. | Fremont | 2,946 | 105,215(2.80%)#5 | 239,302(1.23%)#6 |
| 6. | Alhambra | 2,414 | 105,215(2.29%)#6 | 239,302(1.01%)#9 |
| 7. | Monterey Park | 2,413 | 105,215(2.29%)#7 | 239,302(1.01%)#10 |
| 8. | San Diego | 1,913 | 105,215(1.82%)#8 | 239,302(0.80%)#11 |
| 9. | Oakland | 1,911 | 105,215(1.82%)#9 | 239,302(0.80%)#12 |
| 10. | Arcadia | 1,703 | 105,215(1.62%)#10 | 239,302(0.71%)#14 |
| 11. | Sacramento | 1,693 | 105,215(1.61%)#11 | 239,302(0.71%)#15 |
| 12. | Irvine | 1,545 | 105,215(1.47%)#12 | 239,302(0.65%)#17 |
| 13. | Hayward | 1,413 | 105,215(1.34%)#13 | 239,302(0.59%)#18 |
| 14. | South San Francisco | 1,402 | 105,215(1.33%)#14 | 239,302(0.59%)#19 |
| 15. | San Leandro | 1,370 | 105,215(1.30%)#15 | 239,302(0.57%)#20 |
| 16. | Rowland Heights | 1,191 | 105,215(1.13%)#16 | 239,302(0.50%)#22 |
| 17. | Alameda | 1,188 | 105,215(1.13%)#17 | 239,302(0.50%)#23 |
| 18. | Millbrae | 1,136 | 105,215(1.08%)#18 | 239,302(0.47%)#24 |
| 19. | San Ramon | 1,086 | 105,215(1.03%)#19 | 239,302(0.45%)#27 |
| 20. | San Mateo | 1,084 | 105,215(1.03%)#20 | 239,302(0.45%)#28 |
| 21. | Cupertino | 1,083 | 105,215(1.03%)#21 | 239,302(0.45%)#29 |
| 22. | Diamond Bar | 1,051 | 105,215(1.00%)#22 | 239,302(0.44%)#30 |
| 23. | Sunnyvale | 1,023 | 105,215(0.97%)#23 | 239,302(0.43%)#31 |
| 24. | Union City | 980 | 105,215(0.93%)#24 | 239,302(0.41%)#35 |
| 25. | San Bruno | 970 | 105,215(0.92%)#25 | 239,302(0.41%)#36 |
| 26. | San Gabriel | 954 | 105,215(0.91%)#26 | 239,302(0.40%)#37 |
| 27. | East San Gabriel | 917 | 105,215(0.87%)#27 | 239,302(0.38%)#38 |
| 28. | Rosemead | 891 | 105,215(0.85%)#28 | 239,302(0.37%)#39 |
| 29. | West Covina | 877 | 105,215(0.83%)#29 | 239,302(0.37%)#40 |
| 30. | Milpitas | 875 | 105,215(0.83%)#30 | 239,302(0.37%)#41 |
| 31. | Chino Hills | 869 | 105,215(0.83%)#31 | 239,302(0.36%)#42 |
| 32. | Hacienda Heights | 862 | 105,215(0.82%)#32 | 239,302(0.36%)#43 |
| 33. | Temple City | 860 | 105,215(0.82%)#33 | 239,302(0.36%)#44 |
| 34. | Palo Alto | 819 | 105,215(0.78%)#34 | 239,302(0.34%)#45 |
| 35. | Richmond | 814 | 105,215(0.77%)#35 | 239,302(0.34%)#46 |
| 36. | Walnut | 783 | 105,215(0.74%)#36 | 239,302(0.33%)#47 |
| 37. | Elk Grove | 782 | 105,215(0.74%)#37 | 239,302(0.33%)#48 |
| 38. | Santa Clara | 775 | 105,215(0.74%)#38 | 239,302(0.32%)#49 |
| 39. | Castro Valley | 764 | 105,215(0.73%)#39 | 239,302(0.32%)#50 |
| 40. | El Monte | 712 | 105,215(0.68%)#40 | 239,302(0.30%)#52 |
| 41. | Mountain View | 605 | 105,215(0.58%)#41 | 239,302(0.25%)#55 |
| 42. | Rancho Cucamonga | 595 | 105,215(0.57%)#42 | 239,302(0.25%)#58 |
| 43. | Dublin | 578 | 105,215(0.55%)#43 | 239,302(0.24%)#60 |
| 44. | Saratoga | 572 | 105,215(0.54%)#44 | 239,302(0.24%)#61 |
| 45. | Los Altos | 563 | 105,215(0.54%)#45 | 239,302(0.24%)#62 |
| 46. | Foster City | 544 | 105,215(0.52%)#46 | 239,302(0.23%)#64 |
| 47. | Newark | 488 | 105,215(0.46%)#47 | 239,302(0.20%)#67 |
| 48. | Burlingame | 485 | 105,215(0.46%)#48 | 239,302(0.20%)#68 |
| 49. | Berkeley | 448 | 105,215(0.43%)#49 | 239,302(0.19%)#69 |
| 50. | Pacifica | 444 | 105,215(0.42%)#50 | 239,302(0.19%)#71 |
| 51. | Baldwin Park | 423 | 105,215(0.40%)#51 | 239,302(0.18%)#72 |
| 52. | Pasadena | 418 | 105,215(0.40%)#52 | 239,302(0.17%)#73 |
| 53. | San Lorenzo | 416 | 105,215(0.40%)#53 | 239,302(0.17%)#74 |
| 54. | Rancho Palos Verdes | 415 | 105,215(0.39%)#54 | 239,302(0.17%)#75 |
| 55. | San Marino | 410 | 105,215(0.39%)#55 | 239,302(0.17%)#77 |
| 56. | Chino | 406 | 105,215(0.39%)#56 | 239,302(0.17%)#78 |
| 57. | Torrance | 401 | 105,215(0.38%)#57 | 239,302(0.17%)#79 |
| 58. | Stockton | 395 | 105,215(0.38%)#58 | 239,302(0.17%)#80 |
| 59. | Redwood City | 384 | 105,215(0.36%)#59 | 239,302(0.16%)#83 |
| 60. | South Pasadena | 368 | 105,215(0.35%)#60 | 239,302(0.15%)#85 |
| 61. | Tustin | 357 | 105,215(0.34%)#61 | 239,302(0.15%)#87 |
| 62. | Orange | 355 | 105,215(0.34%)#62 | 239,302(0.15%)#88 |
| 63. | Pleasanton | 350 | 105,215(0.33%)#63 | 239,302(0.15%)#90 |
| 64. | Pinole | 348 | 105,215(0.33%)#64 | 239,302(0.15%)#91 |
| 65. | Concord | 347 | 105,215(0.33%)#65 | 239,302(0.15%)#92 |
| 66. | Covina | 335 | 105,215(0.32%)#66 | 239,302(0.14%)#94 |
| 67. | Belmont | 335 | 105,215(0.32%)#67 | 239,302(0.14%)#95 |
| 68. | Folsom | 331 | 105,215(0.31%)#68 | 239,302(0.14%)#97 |
| 69. | Lake Forest | 319 | 105,215(0.30%)#69 | 239,302(0.13%)#100 |
| 70. | Blackhawk | 291 | 105,215(0.28%)#70 | 239,302(0.12%)#106 |
| 71. | Yorba Linda | 286 | 105,215(0.27%)#71 | 239,302(0.12%)#108 |
| 72. | Campbell | 284 | 105,215(0.27%)#72 | 239,302(0.12%)#109 |
| 73. | Anaheim | 271 | 105,215(0.26%)#73 | 239,302(0.11%)#112 |
| 74. | Walnut Creek | 262 | 105,215(0.25%)#74 | 239,302(0.11%)#115 |
| 75. | Montebello | 256 | 105,215(0.24%)#75 | 239,302(0.11%)#117 |
| 76. | Fresno | 252 | 105,215(0.24%)#76 | 239,302(0.11%)#118 |
| 77. | Los Gatos | 250 | 105,215(0.24%)#77 | 239,302(0.10%)#119 |
| 78. | Ontario | 243 | 105,215(0.23%)#78 | 239,302(0.10%)#121 |
| 79. | San Carlos | 242 | 105,215(0.23%)#79 | 239,302(0.10%)#123 |
| 80. | South El Monte | 237 | 105,215(0.23%)#80 | 239,302(0.10%)#127 |
| 81. | Bakersfield | 235 | 105,215(0.22%)#81 | 239,302(0.10%)#129 |
| 82. | Huntington Beach | 223 | 105,215(0.21%)#82 | 239,302(0.09%)#134 |
| 83. | Glendale | 215 | 105,215(0.20%)#83 | 239,302(0.09%)#138 |
| 84. | Encinitas | 215 | 105,215(0.20%)#84 | 239,302(0.09%)#140 |
| 85. | Santa Clarita | 211 | 105,215(0.20%)#85 | 239,302(0.09%)#142 |
| 86. | Fontana | 210 | 105,215(0.20%)#86 | 239,302(0.09%)#145 |
| 87. | Glendora | 208 | 105,215(0.20%)#87 | 239,302(0.09%)#146 |
| 88. | Brea | 208 | 105,215(0.20%)#88 | 239,302(0.09%)#147 |
| 89. | Thousand Oaks | 207 | 105,215(0.20%)#89 | 239,302(0.09%)#148 |
| 90. | San Dimas | 206 | 105,215(0.20%)#90 | 239,302(0.09%)#151 |
| 91. | Rocklin | 204 | 105,215(0.19%)#91 | 239,302(0.09%)#154 |
| 92. | Sierra Madre | 203 | 105,215(0.19%)#92 | 239,302(0.08%)#156 |
| 93. | Antioch | 201 | 105,215(0.19%)#93 | 239,302(0.08%)#157 |
| 94. | Vallejo | 200 | 105,215(0.19%)#94 | 239,302(0.08%)#158 |
| 95. | Orinda | 194 | 105,215(0.18%)#95 | 239,302(0.08%)#161 |
| 96. | Cerritos | 189 | 105,215(0.18%)#96 | 239,302(0.08%)#164 |
| 97. | Menlo Park | 189 | 105,215(0.18%)#97 | 239,302(0.08%)#165 |
| 98. | Hillsborough | 189 | 105,215(0.18%)#98 | 239,302(0.08%)#166 |
| 99. | Fountain Valley | 186 | 105,215(0.18%)#99 | 239,302(0.08%)#168 |
| 100. | Cherryland | 184 | 105,215(0.17%)#100 | 239,302(0.08%)#170 |
Common Questions
What are the Top 10 Cities with the Most Immigrants from Hong Kong in California?
Top 10 Cities with the Most Immigrants from Hong Kong in California are:
#1
15,201
#2
4,468
#3
3,557
#4
3,036
#5
2,946
#6
2,414
#7
2,413
#8
1,913
#9
1,911
#10
1,703
What city has the Most Immigrants from Hong Kong in California?
San Francisco has the Most Immigrants from Hong Kong in California with 15,201.
What is the Total Immigrants from Hong Kong in the State of California?
Total Immigrants from Hong Kong in California is 105,215.
What is the Total Immigrants from Hong Kong in the United States?
Total Immigrants from Hong Kong in the United States is 239,302.