Cities with the Highest Percentage of Population Employed in Personal Care and Service in California
RELATED REPORTS & OPTIONS
Personal Care and Service
California
Compare Cities
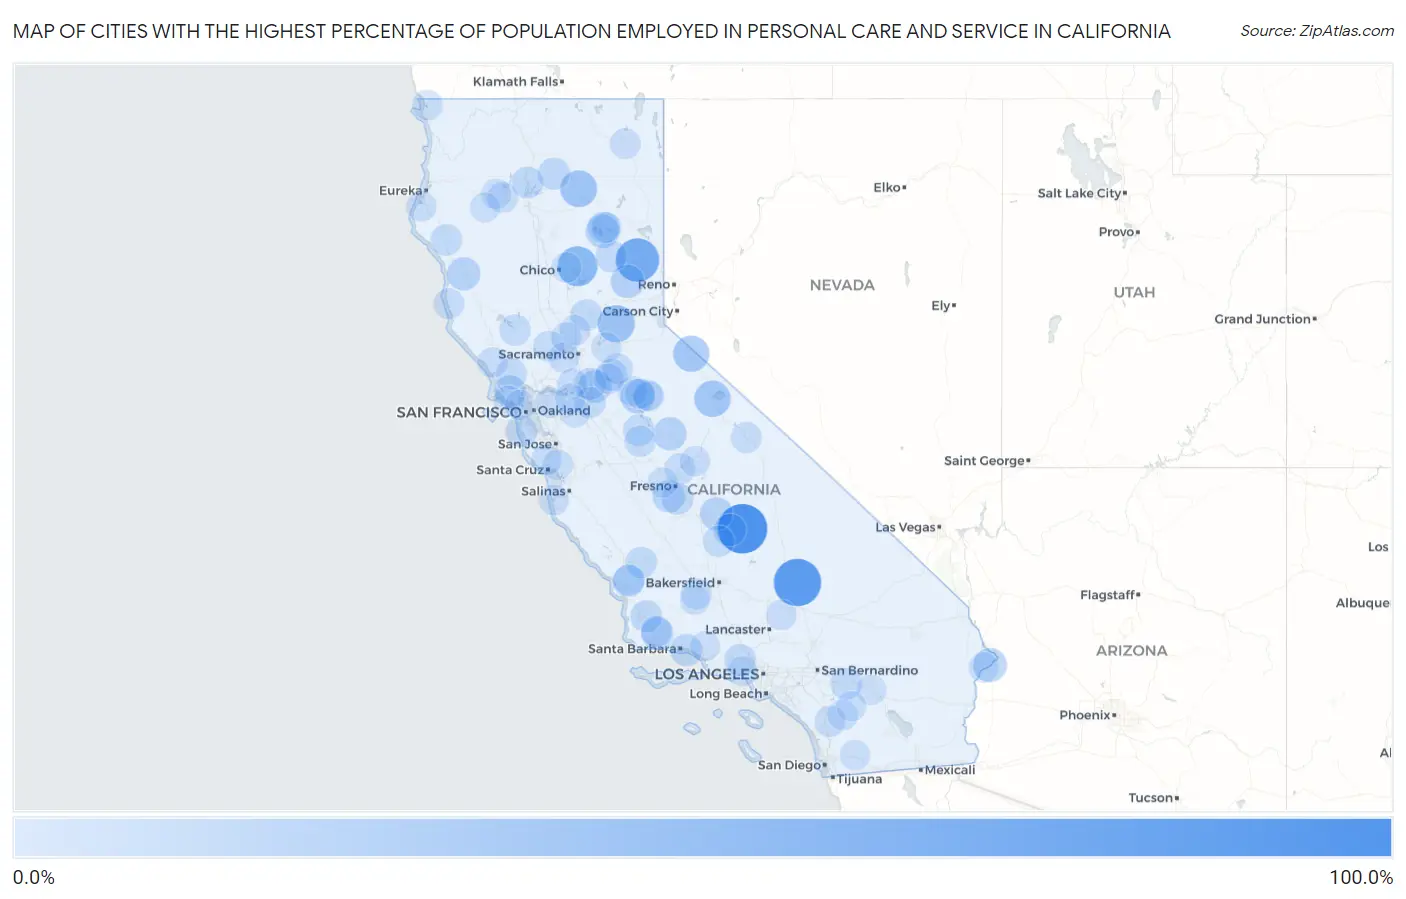
Map of Cities with the Highest Percentage of Population Employed in Personal Care and Service in California
0.0%
100.0%
Cities with the Highest Percentage of Population Employed in Personal Care and Service in California
| City | % Employed | vs State | vs National | |
| 1. | Camp Nelson | 89.0% | 2.7%(+86.3)#1 | 2.6%(+86.5)#14 |
| 2. | Johannesburg | 79.4% | 2.7%(+76.7)#2 | 2.6%(+76.8)#16 |
| 3. | Lake Davis | 61.7% | 2.7%(+59.0)#3 | 2.6%(+59.2)#28 |
| 4. | Concow | 47.2% | 2.7%(+44.5)#4 | 2.6%(+44.7)#47 |
| 5. | Foresthill | 35.5% | 2.7%(+32.8)#5 | 2.6%(+32.9)#83 |
| 6. | Hat Creek | 33.3% | 2.7%(+30.6)#6 | 2.6%(+30.8)#97 |
| 7. | Lee Vining | 31.6% | 2.7%(+28.9)#7 | 2.6%(+29.0)#107 |
| 8. | Coleville | 31.0% | 2.7%(+28.2)#8 | 2.6%(+28.4)#112 |
| 9. | Tuttletown | 23.4% | 2.7%(+20.7)#9 | 2.6%(+20.9)#182 |
| 10. | Bluewater | 21.4% | 2.7%(+18.7)#10 | 2.6%(+18.9)#223 |
| 11. | East Shore | 20.6% | 2.7%(+17.9)#11 | 2.6%(+18.0)#239 |
| 12. | Sierra City | 20.0% | 2.7%(+17.3)#12 | 2.6%(+17.4)#253 |
| 13. | Bootjack | 18.8% | 2.7%(+16.1)#13 | 2.6%(+16.2)#276 |
| 14. | Laytonville | 18.7% | 2.7%(+16.0)#14 | 2.6%(+16.2)#278 |
| 15. | Rivergrove | 18.5% | 2.7%(+15.8)#15 | 2.6%(+16.0)#284 |
| 16. | Lindcove | 18.2% | 2.7%(+15.5)#16 | 2.6%(+15.6)#300 |
| 17. | Victor | 17.2% | 2.7%(+14.4)#17 | 2.6%(+14.6)#330 |
| 18. | Williams Canyon | 16.7% | 2.7%(+14.0)#18 | 2.6%(+14.1)#355 |
| 19. | Raisin City | 15.7% | 2.7%(+13.0)#19 | 2.6%(+13.2)#398 |
| 20. | Springville | 15.6% | 2.7%(+12.9)#20 | 2.6%(+13.0)#405 |
| 21. | Ballard | 14.5% | 2.7%(+11.8)#21 | 2.6%(+11.9)#451 |
| 22. | Summerland | 14.5% | 2.7%(+11.7)#22 | 2.6%(+11.9)#455 |
| 23. | Nicasio | 14.0% | 2.7%(+11.3)#23 | 2.6%(+11.4)#488 |
| 24. | Big Bend | 13.6% | 2.7%(+10.9)#24 | 2.6%(+11.1)#515 |
| 25. | Moss Beach | 13.5% | 2.7%(+10.8)#25 | 2.6%(+11.0)#524 |
| 26. | Lakehead | 13.3% | 2.7%(+10.6)#26 | 2.6%(+10.7)#532 |
| 27. | Acampo | 13.1% | 2.7%(+10.4)#27 | 2.6%(+10.6)#550 |
| 28. | Clear Creek | 13.1% | 2.7%(+10.4)#28 | 2.6%(+10.5)#553 |
| 29. | Garey | 13.0% | 2.7%(+10.3)#29 | 2.6%(+10.5)#558 |
| 30. | Buena Vista | 13.0% | 2.7%(+10.3)#30 | 2.6%(+10.4)#562 |
| 31. | Monmouth | 12.9% | 2.7%(+10.2)#31 | 2.6%(+10.3)#567 |
| 32. | East Quincy | 12.5% | 2.7%(+9.83)#32 | 2.6%(+9.98)#601 |
| 33. | Santa Susana | 12.5% | 2.7%(+9.77)#33 | 2.6%(+9.92)#614 |
| 34. | Cabazon | 12.3% | 2.7%(+9.59)#34 | 2.6%(+9.75)#629 |
| 35. | Santa Margarita | 12.1% | 2.7%(+9.37)#35 | 2.6%(+9.52)#655 |
| 36. | Shandon | 11.9% | 2.7%(+9.15)#36 | 2.6%(+9.30)#677 |
| 37. | Snelling | 11.9% | 2.7%(+9.15)#37 | 2.6%(+9.30)#679 |
| 38. | Redway | 11.6% | 2.7%(+8.84)#38 | 2.6%(+8.99)#709 |
| 39. | Beale Afb | 11.4% | 2.7%(+8.69)#39 | 2.6%(+8.84)#727 |
| 40. | Terra Bella | 11.4% | 2.7%(+8.65)#40 | 2.6%(+8.80)#729 |
| 41. | Lower Lake | 10.9% | 2.7%(+8.17)#41 | 2.6%(+8.32)#798 |
| 42. | Garden Farms | 10.8% | 2.7%(+8.08)#42 | 2.6%(+8.23)#816 |
| 43. | Los Olivos | 10.6% | 2.7%(+7.85)#43 | 2.6%(+8.00)#839 |
| 44. | Taft Mosswood | 10.3% | 2.7%(+7.56)#44 | 2.6%(+7.71)#877 |
| 45. | University Of California Merced | 10.2% | 2.7%(+7.51)#45 | 2.6%(+7.66)#894 |
| 46. | Penngrove | 10.1% | 2.7%(+7.43)#46 | 2.6%(+7.58)#905 |
| 47. | Mesa | 9.8% | 2.7%(+7.06)#47 | 2.6%(+7.21)#971 |
| 48. | Esparto | 9.7% | 2.7%(+6.95)#48 | 2.6%(+7.10)#993 |
| 49. | Lewiston | 9.7% | 2.7%(+6.95)#49 | 2.6%(+7.10)#994 |
| 50. | Valley Acres | 9.6% | 2.7%(+6.93)#50 | 2.6%(+7.08)#1,001 |
| 51. | Friant | 9.3% | 2.7%(+6.63)#51 | 2.6%(+6.78)#1,069 |
| 52. | Bolinas | 9.3% | 2.7%(+6.62)#52 | 2.6%(+6.77)#1,072 |
| 53. | Sonoma State University | 9.3% | 2.7%(+6.61)#53 | 2.6%(+6.76)#1,073 |
| 54. | Mono Vista | 9.3% | 2.7%(+6.58)#54 | 2.6%(+6.73)#1,081 |
| 55. | Little River | 9.2% | 2.7%(+6.47)#55 | 2.6%(+6.62)#1,103 |
| 56. | Lompico | 9.0% | 2.7%(+6.31)#56 | 2.6%(+6.46)#1,141 |
| 57. | Sutter Creek | 8.9% | 2.7%(+6.16)#57 | 2.6%(+6.31)#1,178 |
| 58. | Trabuco Canyon | 8.8% | 2.7%(+6.13)#58 | 2.6%(+6.28)#1,189 |
| 59. | Pala | 8.8% | 2.7%(+6.08)#59 | 2.6%(+6.23)#1,203 |
| 60. | Meyers | 8.6% | 2.7%(+5.89)#60 | 2.6%(+6.04)#1,256 |
| 61. | Camanche North Shore | 8.3% | 2.7%(+5.59)#61 | 2.6%(+5.75)#1,345 |
| 62. | Smith River | 8.2% | 2.7%(+5.49)#62 | 2.6%(+5.64)#1,369 |
| 63. | California Pines | 8.2% | 2.7%(+5.48)#63 | 2.6%(+5.63)#1,374 |
| 64. | North Gate | 8.0% | 2.7%(+5.27)#64 | 2.6%(+5.42)#1,443 |
| 65. | Highlands | 7.9% | 2.7%(+5.22)#65 | 2.6%(+5.37)#1,461 |
| 66. | Carmel By The Sea | 7.9% | 2.7%(+5.16)#66 | 2.6%(+5.31)#1,484 |
| 67. | University Of California Davis | 7.9% | 2.7%(+5.15)#67 | 2.6%(+5.30)#1,485 |
| 68. | Monte Rio | 7.8% | 2.7%(+5.12)#68 | 2.6%(+5.27)#1,500 |
| 69. | Auberry | 7.6% | 2.7%(+4.90)#69 | 2.6%(+5.05)#1,587 |
| 70. | Edwards Afb | 7.6% | 2.7%(+4.85)#70 | 2.6%(+5.00)#1,609 |
| 71. | Ferndale | 7.6% | 2.7%(+4.84)#71 | 2.6%(+4.99)#1,614 |
| 72. | Isleton | 7.5% | 2.7%(+4.78)#72 | 2.6%(+4.93)#1,637 |
| 73. | East Nicolaus | 7.5% | 2.7%(+4.75)#73 | 2.6%(+4.90)#1,647 |
| 74. | Pepperdine University | 7.4% | 2.7%(+4.71)#74 | 2.6%(+4.86)#1,656 |
| 75. | Sage | 7.3% | 2.7%(+4.61)#75 | 2.6%(+4.76)#1,687 |
| 76. | Aguanga | 7.3% | 2.7%(+4.59)#76 | 2.6%(+4.74)#1,696 |
| 77. | California Polytechnic State University | 7.3% | 2.7%(+4.59)#77 | 2.6%(+4.74)#1,699 |
| 78. | Knights Landing | 7.2% | 2.7%(+4.47)#78 | 2.6%(+4.63)#1,739 |
| 79. | Weaverville | 7.0% | 2.7%(+4.25)#79 | 2.6%(+4.40)#1,845 |
| 80. | Marin City | 7.0% | 2.7%(+4.24)#80 | 2.6%(+4.39)#1,853 |
| 81. | Westwood | 6.9% | 2.7%(+4.22)#81 | 2.6%(+4.37)#1,865 |
| 82. | Angels | 6.9% | 2.7%(+4.21)#82 | 2.6%(+4.36)#1,874 |
| 83. | Day Valley | 6.9% | 2.7%(+4.20)#83 | 2.6%(+4.36)#1,876 |
| 84. | Butte Creek Canyon | 6.9% | 2.7%(+4.20)#84 | 2.6%(+4.35)#1,885 |
| 85. | Thousand Palms | 6.9% | 2.7%(+4.15)#85 | 2.6%(+4.31)#1,904 |
| 86. | Knightsen | 6.9% | 2.7%(+4.15)#86 | 2.6%(+4.30)#1,907 |
| 87. | Topanga | 6.9% | 2.7%(+4.14)#87 | 2.6%(+4.29)#1,917 |
| 88. | Taft | 6.7% | 2.7%(+4.04)#88 | 2.6%(+4.19)#1,964 |
| 89. | Biola | 6.7% | 2.7%(+4.01)#89 | 2.6%(+4.16)#1,979 |
| 90. | Soulsbyville | 6.7% | 2.7%(+3.95)#90 | 2.6%(+4.10)#2,015 |
| 91. | Anza | 6.7% | 2.7%(+3.94)#91 | 2.6%(+4.09)#2,016 |
| 92. | Happy Valley | 6.6% | 2.7%(+3.91)#92 | 2.6%(+4.06)#2,024 |
| 93. | Mountain House | 6.6% | 2.7%(+3.86)#93 | 2.6%(+4.01)#2,054 |
| 94. | Meiners Oaks | 6.6% | 2.7%(+3.84)#94 | 2.6%(+3.99)#2,070 |
| 95. | Descanso | 6.5% | 2.7%(+3.77)#95 | 2.6%(+3.92)#2,114 |
| 96. | El Macero | 6.4% | 2.7%(+3.72)#96 | 2.6%(+3.87)#2,143 |
| 97. | Hayfork | 6.4% | 2.7%(+3.72)#97 | 2.6%(+3.87)#2,144 |
| 98. | Cameron Park | 6.4% | 2.7%(+3.69)#98 | 2.6%(+3.84)#2,166 |
| 99. | Big River | 6.4% | 2.7%(+3.68)#99 | 2.6%(+3.83)#2,173 |
| 100. | Columbia | 6.4% | 2.7%(+3.67)#100 | 2.6%(+3.82)#2,179 |
Common Questions
What are the Top 10 Cities with the Highest Percentage of Population Employed in Personal Care and Service in California?
Top 10 Cities with the Highest Percentage of Population Employed in Personal Care and Service in California are:
#1
89.0%
#2
79.4%
#3
61.7%
#4
47.2%
#5
35.5%
#6
33.3%
#7
31.6%
#8
31.0%
#9
23.4%
#10
21.4%
What city has the Highest Percentage of Population Employed in Personal Care and Service in California?
Camp Nelson has the Highest Percentage of Population Employed in Personal Care and Service in California with 89.0%.
What is the Percentage of Population Employed in Personal Care and Service in the State of California?
Percentage of Population Employed in Personal Care and Service in California is 2.7%.
What is the Percentage of Population Employed in Personal Care and Service in the United States?
Percentage of Population Employed in Personal Care and Service in the United States is 2.6%.