Cities with the Highest Percentage of Population Employed in Firefighting & Prevention in California
RELATED REPORTS & OPTIONS
Firefighting & Prevention
California
Compare Cities
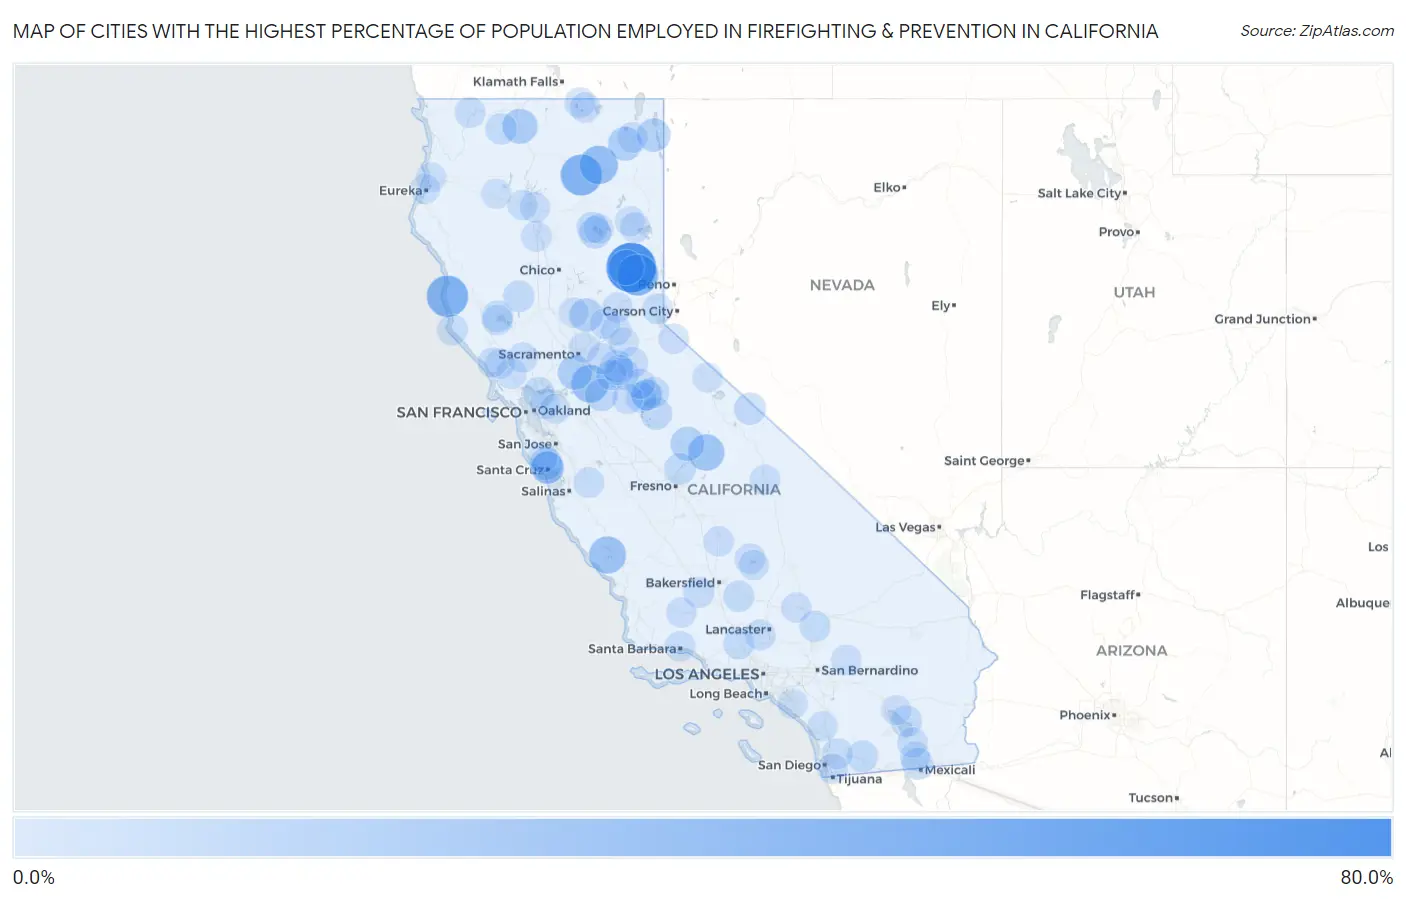
Map of Cities with the Highest Percentage of Population Employed in Firefighting & Prevention in California
0.0%
80.0%
Cities with the Highest Percentage of Population Employed in Firefighting & Prevention in California
| City | % Employed | vs State | vs National | |
| 1. | C Road | 76.0% | 1.3%(+74.7)#1 | 1.2%(+74.8)#7 |
| 2. | Kep'el | 50.0% | 1.3%(+48.7)#2 | 1.2%(+48.8)#20 |
| 3. | Caspar | 45.1% | 1.3%(+43.8)#3 | 1.2%(+43.9)#22 |
| 4. | Fall River Mills | 43.9% | 1.3%(+42.6)#4 | 1.2%(+42.7)#24 |
| 5. | Calpine | 43.8% | 1.3%(+42.5)#5 | 1.2%(+42.6)#25 |
| 6. | Bieber | 33.3% | 1.3%(+32.1)#6 | 1.2%(+32.1)#44 |
| 7. | Acampo | 30.3% | 1.3%(+29.1)#7 | 1.2%(+29.1)#54 |
| 8. | Oak Shores | 28.9% | 1.3%(+27.6)#8 | 1.2%(+27.7)#56 |
| 9. | Big Creek | 26.1% | 1.3%(+24.8)#9 | 1.2%(+24.9)#65 |
| 10. | Graeagle | 23.3% | 1.3%(+22.1)#10 | 1.2%(+22.1)#87 |
| 11. | Grenada | 20.7% | 1.3%(+19.4)#11 | 1.2%(+19.5)#105 |
| 12. | Courtland | 18.9% | 1.3%(+17.6)#12 | 1.2%(+17.7)#130 |
| 13. | California Pines | 17.2% | 1.3%(+15.9)#13 | 1.2%(+16.0)#151 |
| 14. | Bass Lake | 17.1% | 1.3%(+15.8)#14 | 1.2%(+15.9)#153 |
| 15. | Beale Afb | 16.2% | 1.3%(+15.0)#15 | 1.2%(+15.0)#171 |
| 16. | Cedarville | 15.9% | 1.3%(+14.7)#16 | 1.2%(+14.7)#178 |
| 17. | Paradise Park | 14.3% | 1.3%(+13.0)#17 | 1.2%(+13.1)#221 |
| 18. | Mount Hermon | 12.0% | 1.3%(+10.7)#18 | 1.2%(+10.8)#306 |
| 19. | Mokelumne Hill | 11.9% | 1.3%(+10.6)#19 | 1.2%(+10.7)#313 |
| 20. | Linden | 11.8% | 1.3%(+10.5)#20 | 1.2%(+10.6)#323 |
| 21. | Spring Valley Cdp Lake County | 11.6% | 1.3%(+10.3)#21 | 1.2%(+10.4)#337 |
| 22. | Pasatiempo | 10.7% | 1.3%(+9.39)#22 | 1.2%(+9.48)#382 |
| 23. | Lake Almanor West | 10.5% | 1.3%(+9.25)#23 | 1.2%(+9.34)#391 |
| 24. | Benton | 10.3% | 1.3%(+8.98)#24 | 1.2%(+9.07)#404 |
| 25. | Amador City | 10.0% | 1.3%(+8.72)#25 | 1.2%(+8.81)#415 |
| 26. | Greeley Hill | 9.8% | 1.3%(+8.51)#26 | 1.2%(+8.60)#438 |
| 27. | Heber | 9.2% | 1.3%(+7.93)#27 | 1.2%(+8.02)#482 |
| 28. | Friant | 8.8% | 1.3%(+7.52)#28 | 1.2%(+7.61)#526 |
| 29. | Pine Valley | 8.6% | 1.3%(+7.30)#29 | 1.2%(+7.39)#546 |
| 30. | Bombay Beach | 8.3% | 1.3%(+7.06)#30 | 1.2%(+7.15)#572 |
| 31. | Stonyford | 8.3% | 1.3%(+7.06)#31 | 1.2%(+7.15)#575 |
| 32. | Chester | 8.3% | 1.3%(+7.03)#32 | 1.2%(+7.12)#577 |
| 33. | Fort Jones | 8.2% | 1.3%(+6.88)#33 | 1.2%(+6.97)#598 |
| 34. | North Lakeport | 7.8% | 1.3%(+6.54)#34 | 1.2%(+6.63)#645 |
| 35. | Mono Vista | 7.3% | 1.3%(+6.06)#35 | 1.2%(+6.14)#704 |
| 36. | Port Costa | 7.2% | 1.3%(+5.97)#36 | 1.2%(+6.06)#716 |
| 37. | Bear Valley Springs | 7.2% | 1.3%(+5.96)#37 | 1.2%(+6.05)#719 |
| 38. | Yosemite West | 7.1% | 1.3%(+5.87)#38 | 1.2%(+5.96)#738 |
| 39. | Mi Wuk Village | 6.7% | 1.3%(+5.47)#39 | 1.2%(+5.56)#802 |
| 40. | Hasley Canyon | 6.7% | 1.3%(+5.43)#40 | 1.2%(+5.52)#810 |
| 41. | Silver Lakes | 6.7% | 1.3%(+5.43)#41 | 1.2%(+5.52)#811 |
| 42. | Eucalyptus Hills | 6.6% | 1.3%(+5.32)#42 | 1.2%(+5.41)#835 |
| 43. | Leona Valley | 6.5% | 1.3%(+5.23)#43 | 1.2%(+5.32)#850 |
| 44. | Dustin Acres | 6.5% | 1.3%(+5.18)#44 | 1.2%(+5.27)#860 |
| 45. | Sonora | 6.4% | 1.3%(+5.15)#45 | 1.2%(+5.24)#869 |
| 46. | Phoenix Lake | 6.4% | 1.3%(+5.08)#46 | 1.2%(+5.17)#881 |
| 47. | Rancho Murieta | 6.3% | 1.3%(+5.04)#47 | 1.2%(+5.13)#888 |
| 48. | Point Arena | 6.1% | 1.3%(+4.81)#48 | 1.2%(+4.90)#928 |
| 49. | Alturas | 6.0% | 1.3%(+4.68)#49 | 1.2%(+4.77)#969 |
| 50. | Happy Camp | 5.9% | 1.3%(+4.67)#50 | 1.2%(+4.76)#971 |
| 51. | Tres Pinos | 5.9% | 1.3%(+4.63)#51 | 1.2%(+4.72)#981 |
| 52. | Lakeport | 5.9% | 1.3%(+4.63)#52 | 1.2%(+4.72)#983 |
| 53. | Dollar Point | 5.7% | 1.3%(+4.46)#53 | 1.2%(+4.55)#1,028 |
| 54. | Wofford Heights | 5.7% | 1.3%(+4.46)#54 | 1.2%(+4.55)#1,029 |
| 55. | Buckhorn | 5.7% | 1.3%(+4.46)#55 | 1.2%(+4.55)#1,032 |
| 56. | Independence | 5.6% | 1.3%(+4.28)#56 | 1.2%(+4.37)#1,081 |
| 57. | Tulelake | 5.5% | 1.3%(+4.25)#57 | 1.2%(+4.34)#1,090 |
| 58. | Westmorland | 5.5% | 1.3%(+4.19)#58 | 1.2%(+4.28)#1,112 |
| 59. | Penngrove | 5.4% | 1.3%(+4.11)#59 | 1.2%(+4.20)#1,136 |
| 60. | Mission Canyon | 5.3% | 1.3%(+4.01)#60 | 1.2%(+4.10)#1,175 |
| 61. | Buena Vista | 5.2% | 1.3%(+3.91)#61 | 1.2%(+4.00)#1,206 |
| 62. | Newell | 5.2% | 1.3%(+3.91)#62 | 1.2%(+4.00)#1,211 |
| 63. | Terra Bella | 5.1% | 1.3%(+3.84)#63 | 1.2%(+3.93)#1,230 |
| 64. | Georgetown | 5.1% | 1.3%(+3.80)#64 | 1.2%(+3.89)#1,241 |
| 65. | Big Bear City | 5.1% | 1.3%(+3.79)#65 | 1.2%(+3.88)#1,250 |
| 66. | Red Bluff | 5.0% | 1.3%(+3.75)#66 | 1.2%(+3.84)#1,264 |
| 67. | Alta | 5.0% | 1.3%(+3.71)#67 | 1.2%(+3.80)#1,279 |
| 68. | Meadow Vista | 5.0% | 1.3%(+3.68)#68 | 1.2%(+3.77)#1,289 |
| 69. | Palo Cedro | 4.9% | 1.3%(+3.67)#69 | 1.2%(+3.76)#1,293 |
| 70. | Sage | 4.9% | 1.3%(+3.63)#70 | 1.2%(+3.72)#1,308 |
| 71. | Copperopolis | 4.9% | 1.3%(+3.60)#71 | 1.2%(+3.69)#1,322 |
| 72. | Forest Meadows | 4.9% | 1.3%(+3.59)#72 | 1.2%(+3.68)#1,325 |
| 73. | Jackson | 4.8% | 1.3%(+3.53)#73 | 1.2%(+3.62)#1,354 |
| 74. | Mcclellan Park | 4.8% | 1.3%(+3.49)#74 | 1.2%(+3.58)#1,368 |
| 75. | Bonita | 4.7% | 1.3%(+3.37)#75 | 1.2%(+3.46)#1,424 |
| 76. | Alpine Village | 4.6% | 1.3%(+3.35)#76 | 1.2%(+3.44)#1,432 |
| 77. | Bonsall | 4.5% | 1.3%(+3.24)#77 | 1.2%(+3.33)#1,491 |
| 78. | Janesville | 4.5% | 1.3%(+3.23)#78 | 1.2%(+3.32)#1,498 |
| 79. | Graton | 4.5% | 1.3%(+3.23)#79 | 1.2%(+3.32)#1,505 |
| 80. | Shasta | 4.5% | 1.3%(+3.21)#80 | 1.2%(+3.30)#1,511 |
| 81. | Deer Park | 4.4% | 1.3%(+3.10)#81 | 1.2%(+3.19)#1,574 |
| 82. | Boron | 4.4% | 1.3%(+3.09)#82 | 1.2%(+3.18)#1,578 |
| 83. | New Cuyama | 4.3% | 1.3%(+3.03)#83 | 1.2%(+3.12)#1,615 |
| 84. | Squirrel Mountain Valley | 4.3% | 1.3%(+3.00)#84 | 1.2%(+3.09)#1,633 |
| 85. | Boulder Creek | 4.2% | 1.3%(+2.92)#85 | 1.2%(+3.01)#1,671 |
| 86. | Bridgeport | 4.1% | 1.3%(+2.85)#86 | 1.2%(+2.94)#1,709 |
| 87. | Weaverville | 4.1% | 1.3%(+2.84)#87 | 1.2%(+2.93)#1,712 |
| 88. | North Shore | 4.1% | 1.3%(+2.82)#88 | 1.2%(+2.91)#1,729 |
| 89. | Mckinleyville | 4.1% | 1.3%(+2.79)#89 | 1.2%(+2.88)#1,749 |
| 90. | Saranap | 4.0% | 1.3%(+2.76)#90 | 1.2%(+2.85)#1,767 |
| 91. | Laguna Woods | 4.0% | 1.3%(+2.71)#91 | 1.2%(+2.80)#1,809 |
| 92. | California Polytechnic State University | 3.9% | 1.3%(+2.66)#92 | 1.2%(+2.75)#1,829 |
| 93. | Lake Almanor Peninsula | 3.8% | 1.3%(+2.57)#93 | 1.2%(+2.66)#1,887 |
| 94. | Samoa | 3.8% | 1.3%(+2.52)#94 | 1.2%(+2.61)#1,928 |
| 95. | Camino | 3.7% | 1.3%(+2.46)#95 | 1.2%(+2.55)#1,979 |
| 96. | Imperial | 3.7% | 1.3%(+2.46)#96 | 1.2%(+2.55)#1,980 |
| 97. | Blackhawk | 3.7% | 1.3%(+2.42)#97 | 1.2%(+2.51)#2,023 |
| 98. | Marysville | 3.7% | 1.3%(+2.41)#98 | 1.2%(+2.50)#2,033 |
| 99. | Johnstonville | 3.7% | 1.3%(+2.39)#99 | 1.2%(+2.48)#2,054 |
| 100. | Monte Rio | 3.7% | 1.3%(+2.38)#100 | 1.2%(+2.47)#2,063 |
Common Questions
What are the Top 10 Cities with the Highest Percentage of Population Employed in Firefighting & Prevention in California?
Top 10 Cities with the Highest Percentage of Population Employed in Firefighting & Prevention in California are:
#1
76.0%
#2
45.1%
#3
43.9%
#4
43.8%
#5
33.3%
#6
30.3%
#7
28.9%
#8
26.1%
#9
23.3%
#10
20.7%
What city has the Highest Percentage of Population Employed in Firefighting & Prevention in California?
C Road has the Highest Percentage of Population Employed in Firefighting & Prevention in California with 76.0%.
What is the Percentage of Population Employed in Firefighting & Prevention in the State of California?
Percentage of Population Employed in Firefighting & Prevention in California is 1.3%.
What is the Percentage of Population Employed in Firefighting & Prevention in the United States?
Percentage of Population Employed in Firefighting & Prevention in the United States is 1.2%.