Cities with the Highest Percentage of Icelander Population in California
RELATED REPORTS & OPTIONS
Icelander
California
Compare Cities
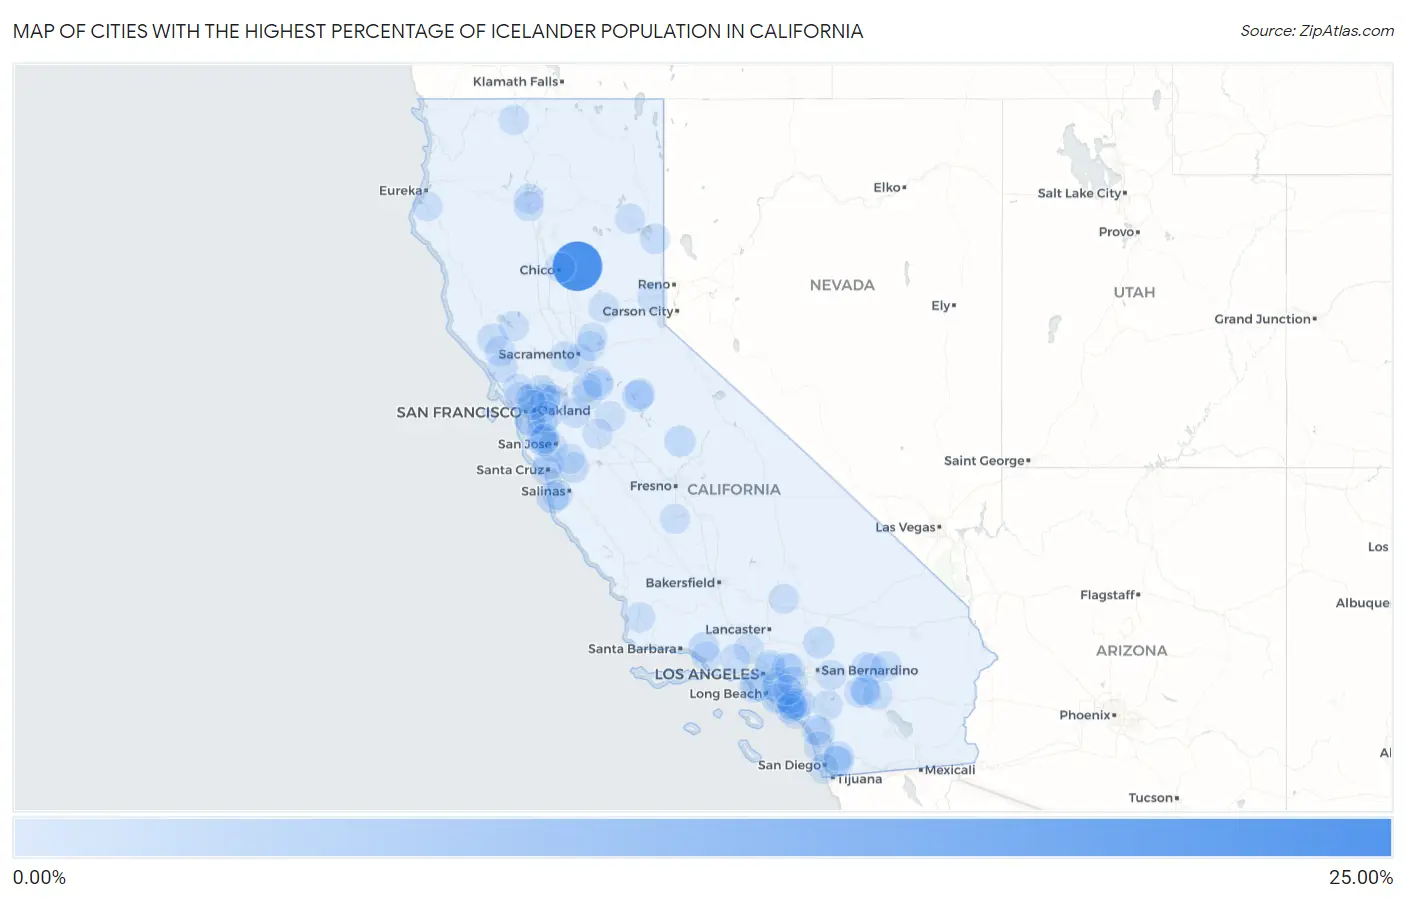
Map of Cities with the Highest Percentage of Icelander Population in California
0.00%
25.00%
Cities with the Highest Percentage of Icelander Population in California
| City | Icelander | vs State | vs National | |
| 1. | Concow | 20.90% | 0.017%(+20.9)#1 | 0.016%(+20.9)#5 |
| 2. | Bayview Cdp Humboldt County | 2.57% | 0.017%(+2.56)#2 | 0.016%(+2.56)#43 |
| 3. | Del Monte Forest | 1.81% | 0.017%(+1.80)#3 | 0.016%(+1.80)#63 |
| 4. | Tuttletown | 1.48% | 0.017%(+1.46)#4 | 0.016%(+1.46)#78 |
| 5. | Ahwahnee | 1.21% | 0.017%(+1.20)#5 | 0.016%(+1.20)#95 |
| 6. | Spring Valley Lake | 1.19% | 0.017%(+1.17)#6 | 0.016%(+1.17)#96 |
| 7. | Brisbane | 0.88% | 0.017%(+0.866)#7 | 0.016%(+0.867)#143 |
| 8. | Mira Monte | 0.76% | 0.017%(+0.744)#8 | 0.016%(+0.745)#171 |
| 9. | Scotts Valley | 0.62% | 0.017%(+0.604)#9 | 0.016%(+0.605)#201 |
| 10. | Herlong | 0.55% | 0.017%(+0.530)#10 | 0.016%(+0.531)#220 |
| 11. | Gilroy | 0.48% | 0.017%(+0.465)#11 | 0.016%(+0.467)#244 |
| 12. | Pacheco | 0.30% | 0.017%(+0.281)#12 | 0.016%(+0.282)#349 |
| 13. | Healdsburg | 0.27% | 0.017%(+0.253)#13 | 0.016%(+0.254)#373 |
| 14. | Cloverdale | 0.26% | 0.017%(+0.240)#14 | 0.016%(+0.241)#388 |
| 15. | Sebastopol | 0.25% | 0.017%(+0.237)#15 | 0.016%(+0.238)#393 |
| 16. | Joshua Tree | 0.25% | 0.017%(+0.235)#16 | 0.016%(+0.236)#395 |
| 17. | Columbia | 0.25% | 0.017%(+0.229)#17 | 0.016%(+0.230)#403 |
| 18. | Santa Cruz | 0.23% | 0.017%(+0.218)#18 | 0.016%(+0.219)#417 |
| 19. | Lake Shastina | 0.23% | 0.017%(+0.216)#19 | 0.016%(+0.217)#420 |
| 20. | Mountain House | 0.21% | 0.017%(+0.191)#20 | 0.016%(+0.192)#448 |
| 21. | Dogtown | 0.21% | 0.017%(+0.189)#21 | 0.016%(+0.190)#451 |
| 22. | El Sobrante Cdp Contra Costa County | 0.20% | 0.017%(+0.183)#22 | 0.016%(+0.184)#465 |
| 23. | Lawndale | 0.19% | 0.017%(+0.173)#23 | 0.016%(+0.175)#483 |
| 24. | Susanville | 0.18% | 0.017%(+0.168)#24 | 0.016%(+0.169)#494 |
| 25. | Hermosa Beach | 0.18% | 0.017%(+0.167)#25 | 0.016%(+0.169)#495 |
| 26. | Riverbank | 0.17% | 0.017%(+0.157)#26 | 0.016%(+0.158)#509 |
| 27. | Rancho San Diego | 0.17% | 0.017%(+0.153)#27 | 0.016%(+0.154)#513 |
| 28. | Patterson | 0.16% | 0.017%(+0.144)#28 | 0.016%(+0.145)#541 |
| 29. | Dana Point | 0.15% | 0.017%(+0.135)#29 | 0.016%(+0.136)#551 |
| 30. | Clearlake | 0.15% | 0.017%(+0.134)#30 | 0.016%(+0.135)#555 |
| 31. | La Canada Flintridge | 0.14% | 0.017%(+0.126)#31 | 0.016%(+0.127)#575 |
| 32. | Truckee | 0.14% | 0.017%(+0.120)#32 | 0.016%(+0.121)#592 |
| 33. | Shasta Lake | 0.14% | 0.017%(+0.118)#33 | 0.016%(+0.120)#595 |
| 34. | Lincoln Village | 0.13% | 0.017%(+0.116)#34 | 0.016%(+0.117)#599 |
| 35. | Palo Alto | 0.13% | 0.017%(+0.114)#35 | 0.016%(+0.115)#605 |
| 36. | Lemon Hill | 0.12% | 0.017%(+0.105)#36 | 0.016%(+0.106)#627 |
| 37. | French Valley | 0.12% | 0.017%(+0.100)#37 | 0.016%(+0.101)#636 |
| 38. | Mission Viejo | 0.11% | 0.017%(+0.096)#38 | 0.016%(+0.097)#646 |
| 39. | Santa Clarita | 0.10% | 0.017%(+0.088)#39 | 0.016%(+0.089)#664 |
| 40. | Yreka | 0.10% | 0.017%(+0.085)#40 | 0.016%(+0.087)#669 |
| 41. | Yucca Valley | 0.10% | 0.017%(+0.085)#41 | 0.016%(+0.086)#671 |
| 42. | Grass Valley | 0.10% | 0.017%(+0.084)#42 | 0.016%(+0.085)#675 |
| 43. | Lockeford | 0.097% | 0.017%(+0.080)#43 | 0.016%(+0.081)#682 |
| 44. | Fortuna | 0.088% | 0.017%(+0.071)#44 | 0.016%(+0.072)#709 |
| 45. | Casa De Oro Mount Helix | 0.080% | 0.017%(+0.063)#45 | 0.016%(+0.064)#742 |
| 46. | Benicia | 0.078% | 0.017%(+0.061)#46 | 0.016%(+0.062)#749 |
| 47. | Fountain Valley | 0.074% | 0.017%(+0.057)#47 | 0.016%(+0.058)#763 |
| 48. | Huntington Beach | 0.072% | 0.017%(+0.056)#48 | 0.016%(+0.057)#767 |
| 49. | San Marino | 0.072% | 0.017%(+0.056)#49 | 0.016%(+0.057)#768 |
| 50. | Clayton | 0.072% | 0.017%(+0.056)#50 | 0.016%(+0.057)#769 |
| 51. | Rancho Santa Margarita | 0.071% | 0.017%(+0.055)#51 | 0.016%(+0.056)#774 |
| 52. | San Lorenzo | 0.071% | 0.017%(+0.054)#52 | 0.016%(+0.055)#779 |
| 53. | East Whittier | 0.068% | 0.017%(+0.052)#53 | 0.016%(+0.053)#792 |
| 54. | California City | 0.067% | 0.017%(+0.050)#54 | 0.016%(+0.051)#800 |
| 55. | Menlo Park | 0.066% | 0.017%(+0.049)#55 | 0.016%(+0.050)#803 |
| 56. | Vista | 0.064% | 0.017%(+0.047)#56 | 0.016%(+0.048)#814 |
| 57. | Simi Valley | 0.063% | 0.017%(+0.047)#57 | 0.016%(+0.048)#817 |
| 58. | Laguna Woods | 0.063% | 0.017%(+0.046)#58 | 0.016%(+0.047)#820 |
| 59. | Morgan Hill | 0.062% | 0.017%(+0.045)#59 | 0.016%(+0.046)#823 |
| 60. | Lodi | 0.062% | 0.017%(+0.045)#60 | 0.016%(+0.046)#827 |
| 61. | Oceanside | 0.062% | 0.017%(+0.045)#61 | 0.016%(+0.046)#828 |
| 62. | Pleasant Hill | 0.061% | 0.017%(+0.044)#62 | 0.016%(+0.045)#833 |
| 63. | Twentynine Palms | 0.061% | 0.017%(+0.044)#63 | 0.016%(+0.045)#836 |
| 64. | Pasadena | 0.060% | 0.017%(+0.044)#64 | 0.016%(+0.045)#840 |
| 65. | Moraga | 0.059% | 0.017%(+0.043)#65 | 0.016%(+0.044)#844 |
| 66. | Rancho Mirage | 0.058% | 0.017%(+0.041)#66 | 0.016%(+0.042)#854 |
| 67. | Campbell | 0.055% | 0.017%(+0.039)#67 | 0.016%(+0.040)#865 |
| 68. | Irvine | 0.055% | 0.017%(+0.038)#68 | 0.016%(+0.039)#868 |
| 69. | Solana Beach | 0.054% | 0.017%(+0.037)#69 | 0.016%(+0.038)#872 |
| 70. | Glendora | 0.054% | 0.017%(+0.037)#70 | 0.016%(+0.038)#874 |
| 71. | Buena Park | 0.051% | 0.017%(+0.035)#71 | 0.016%(+0.036)#890 |
| 72. | La Verne | 0.051% | 0.017%(+0.035)#72 | 0.016%(+0.036)#893 |
| 73. | Palm Springs | 0.051% | 0.017%(+0.035)#73 | 0.016%(+0.036)#894 |
| 74. | Chico | 0.051% | 0.017%(+0.034)#74 | 0.016%(+0.035)#896 |
| 75. | San Buenaventura Ventura | 0.050% | 0.017%(+0.033)#75 | 0.016%(+0.034)#898 |
| 76. | Redding | 0.049% | 0.017%(+0.033)#76 | 0.016%(+0.034)#901 |
| 77. | Orcutt | 0.048% | 0.017%(+0.031)#77 | 0.016%(+0.033)#908 |
| 78. | Davis | 0.046% | 0.017%(+0.029)#78 | 0.016%(+0.031)#922 |
| 79. | Chino Hills | 0.046% | 0.017%(+0.029)#79 | 0.016%(+0.030)#924 |
| 80. | Los Altos | 0.045% | 0.017%(+0.028)#80 | 0.016%(+0.029)#930 |
| 81. | Eastern Goleta Valley | 0.044% | 0.017%(+0.027)#81 | 0.016%(+0.028)#936 |
| 82. | Coronado | 0.042% | 0.017%(+0.026)#82 | 0.016%(+0.027)#947 |
| 83. | Winter Gardens | 0.042% | 0.017%(+0.026)#83 | 0.016%(+0.027)#949 |
| 84. | South San Francisco | 0.041% | 0.017%(+0.024)#84 | 0.016%(+0.026)#959 |
| 85. | San Rafael | 0.039% | 0.017%(+0.023)#85 | 0.016%(+0.024)#975 |
| 86. | Yucaipa | 0.039% | 0.017%(+0.022)#86 | 0.016%(+0.023)#979 |
| 87. | Castro Valley | 0.038% | 0.017%(+0.022)#87 | 0.016%(+0.023)#981 |
| 88. | Citrus Heights | 0.037% | 0.017%(+0.020)#88 | 0.016%(+0.021)#994 |
| 89. | Mountain View | 0.037% | 0.017%(+0.020)#89 | 0.016%(+0.021)#995 |
| 90. | Laguna Beach | 0.035% | 0.017%(+0.018)#90 | 0.016%(+0.019)#1,005 |
| 91. | Aliso Viejo | 0.035% | 0.017%(+0.018)#91 | 0.016%(+0.019)#1,008 |
| 92. | Orange | 0.034% | 0.017%(+0.017)#92 | 0.016%(+0.018)#1,014 |
| 93. | Lemoore | 0.033% | 0.017%(+0.017)#93 | 0.016%(+0.018)#1,018 |
| 94. | Monterey | 0.033% | 0.017%(+0.017)#94 | 0.016%(+0.018)#1,019 |
| 95. | Novato | 0.032% | 0.017%(+0.015)#95 | 0.016%(+0.016)#1,028 |
| 96. | Berkeley | 0.031% | 0.017%(+0.015)#96 | 0.016%(+0.016)#1,035 |
| 97. | Richmond | 0.030% | 0.017%(+0.014)#97 | 0.016%(+0.015)#1,044 |
| 98. | Rocklin | 0.029% | 0.017%(+0.013)#98 | 0.016%(+0.014)#1,050 |
| 99. | Indio | 0.029% | 0.017%(+0.012)#99 | 0.016%(+0.013)#1,051 |
| 100. | Cathedral City | 0.029% | 0.017%(+0.012)#100 | 0.016%(+0.013)#1,053 |
Common Questions
What are the Top 10 Cities with the Highest Percentage of Icelander Population in California?
Top 10 Cities with the Highest Percentage of Icelander Population in California are:
#1
20.90%
#2
1.81%
#3
1.48%
#4
1.21%
#5
1.19%
#6
0.88%
#7
0.76%
#8
0.62%
#9
0.55%
#10
0.48%
What city has the Highest Percentage of Icelander Population in California?
Concow has the Highest Percentage of Icelander Population in California with 20.90%.
What is the Percentage of Icelander Population in the State of California?
Percentage of Icelander Population in California is 0.017%.
What is the Percentage of Icelander Population in the United States?
Percentage of Icelander Population in the United States is 0.016%.