Cities with the Highest Percentage of Population Employed in Installation, Maintenance & Repair in Maryland
RELATED REPORTS & OPTIONS
Installation, Maintenance & Repair
Maryland
Compare Cities
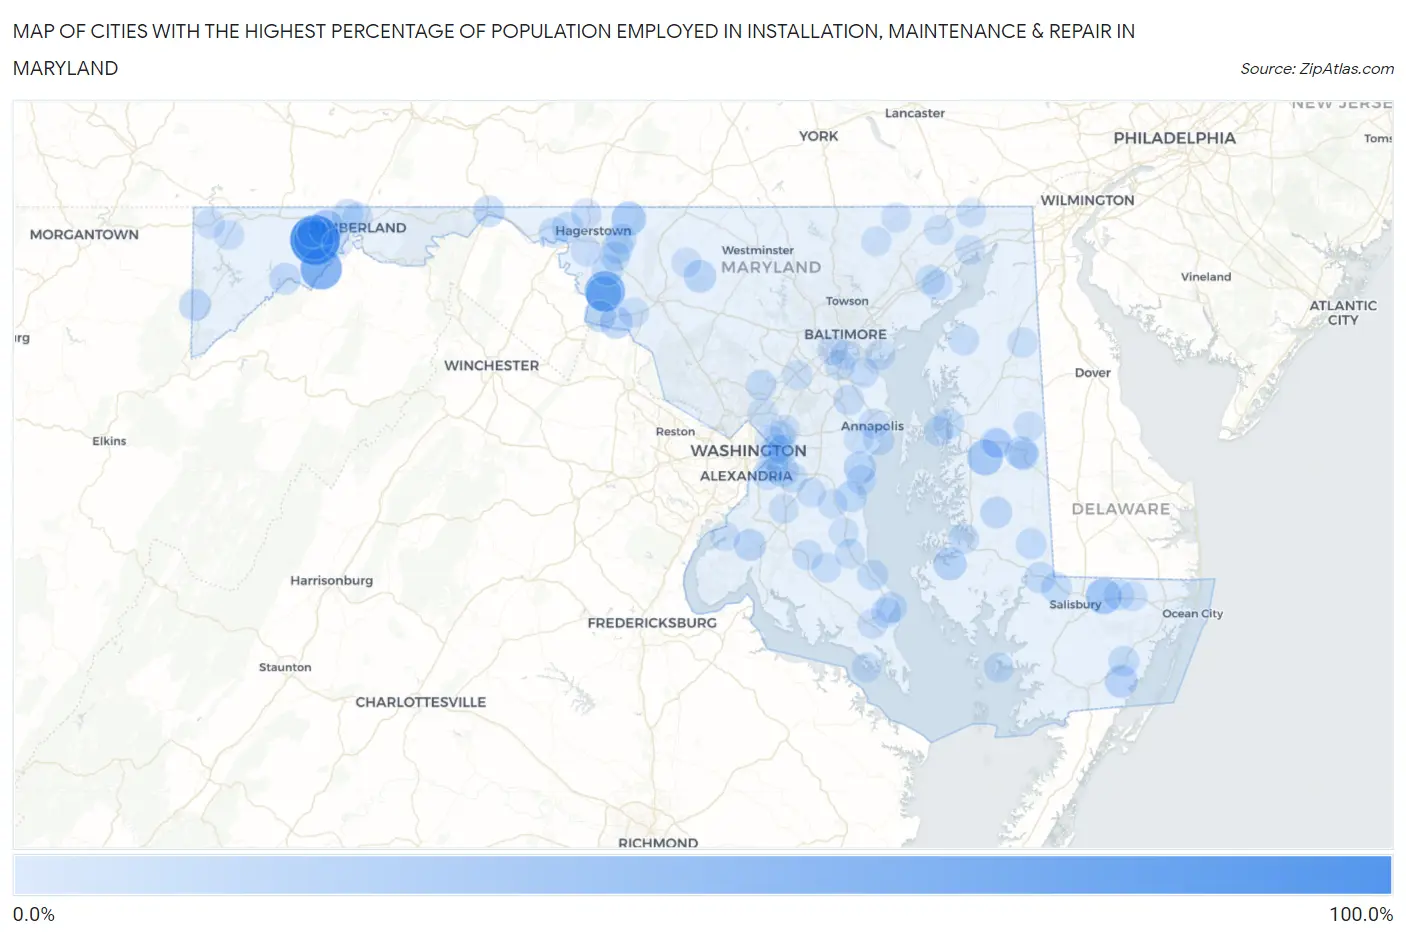
Map of Cities with the Highest Percentage of Population Employed in Installation, Maintenance & Repair in Maryland
0.0%
100.0%
Cities with the Highest Percentage of Population Employed in Installation, Maintenance & Repair in Maryland
| City | % Employed | vs State | vs National | |
| 1. | National | 100.0% | 2.8%(+97.2)#1 | 3.1%(+96.9)#14 |
| 2. | Danville | 59.7% | 2.8%(+56.9)#2 | 3.1%(+56.7)#45 |
| 3. | Rohrersville | 53.8% | 2.8%(+51.1)#3 | 3.1%(+50.8)#60 |
| 4. | Woodland | 51.7% | 2.8%(+48.9)#4 | 3.1%(+48.7)#66 |
| 5. | Parsonsburg | 31.9% | 2.8%(+29.1)#5 | 3.1%(+28.8)#252 |
| 6. | Cordova | 30.9% | 2.8%(+28.1)#6 | 3.1%(+27.8)#267 |
| 7. | Trego Rohrersville Station | 30.8% | 2.8%(+28.0)#7 | 3.1%(+27.7)#268 |
| 8. | Eckhart Mines | 29.6% | 2.8%(+26.8)#8 | 3.1%(+26.5)#292 |
| 9. | Greensburg | 25.0% | 2.8%(+22.2)#9 | 3.1%(+21.9)#414 |
| 10. | Crumpton | 20.3% | 2.8%(+17.5)#10 | 3.1%(+17.2)#658 |
| 11. | Church Creek | 19.1% | 2.8%(+16.4)#11 | 3.1%(+16.1)#726 |
| 12. | Girdletree | 17.9% | 2.8%(+15.1)#12 | 3.1%(+14.8)#831 |
| 13. | Rosemont | 16.9% | 2.8%(+14.1)#13 | 3.1%(+13.9)#907 |
| 14. | Libertytown | 16.6% | 2.8%(+13.8)#14 | 3.1%(+13.6)#956 |
| 15. | Galesville | 16.4% | 2.8%(+13.6)#15 | 3.1%(+13.3)#980 |
| 16. | West Denton | 16.3% | 2.8%(+13.5)#16 | 3.1%(+13.3)#985 |
| 17. | Crellin | 14.2% | 2.8%(+11.4)#17 | 3.1%(+11.1)#1,301 |
| 18. | Pomfret | 14.0% | 2.8%(+11.2)#18 | 3.1%(+10.9)#1,332 |
| 19. | Morningside | 13.5% | 2.8%(+10.7)#19 | 3.1%(+10.4)#1,452 |
| 20. | Corriganville | 13.3% | 2.8%(+10.5)#20 | 3.1%(+10.2)#1,503 |
| 21. | Garretts Mill | 13.2% | 2.8%(+10.4)#21 | 3.1%(+10.1)#1,520 |
| 22. | Choptank | 13.0% | 2.8%(+10.2)#22 | 3.1%(+9.98)#1,561 |
| 23. | Bloomington | 12.9% | 2.8%(+10.1)#23 | 3.1%(+9.84)#1,596 |
| 24. | Hancock | 12.0% | 2.8%(+9.24)#24 | 3.1%(+8.97)#1,815 |
| 25. | Bagtown | 12.0% | 2.8%(+9.19)#25 | 3.1%(+8.92)#1,836 |
| 26. | Silver Hill | 11.8% | 2.8%(+8.97)#26 | 3.1%(+8.70)#1,889 |
| 27. | Boonsboro | 11.5% | 2.8%(+8.75)#27 | 3.1%(+8.48)#1,959 |
| 28. | Friendship | 11.5% | 2.8%(+8.68)#28 | 3.1%(+8.41)#1,993 |
| 29. | Wilson Conococheague | 11.1% | 2.8%(+8.33)#29 | 3.1%(+8.06)#2,093 |
| 30. | Mardela Springs | 10.7% | 2.8%(+7.95)#30 | 3.1%(+7.68)#2,230 |
| 31. | Chesapeake Ranch Estates | 10.0% | 2.8%(+7.22)#31 | 3.1%(+6.95)#2,537 |
| 32. | Landover Hills | 9.7% | 2.8%(+6.95)#32 | 3.1%(+6.67)#2,707 |
| 33. | Highland Beach | 9.7% | 2.8%(+6.88)#33 | 3.1%(+6.61)#2,754 |
| 34. | St Leonard | 9.6% | 2.8%(+6.78)#34 | 3.1%(+6.51)#2,804 |
| 35. | Brookview | 9.5% | 2.8%(+6.73)#35 | 3.1%(+6.46)#2,833 |
| 36. | Hebron | 9.5% | 2.8%(+6.69)#36 | 3.1%(+6.42)#2,845 |
| 37. | Queenstown | 9.3% | 2.8%(+6.48)#37 | 3.1%(+6.21)#2,958 |
| 38. | Jugtown | 9.1% | 2.8%(+6.30)#38 | 3.1%(+6.02)#3,068 |
| 39. | Spencerville | 9.0% | 2.8%(+6.22)#39 | 3.1%(+5.95)#3,109 |
| 40. | Snow Hill | 9.0% | 2.8%(+6.17)#40 | 3.1%(+5.90)#3,140 |
| 41. | Maryland Park | 8.3% | 2.8%(+5.54)#41 | 3.1%(+5.27)#3,631 |
| 42. | Arden On The Severn | 8.3% | 2.8%(+5.49)#42 | 3.1%(+5.22)#3,690 |
| 43. | Worton | 8.2% | 2.8%(+5.45)#43 | 3.1%(+5.18)#3,722 |
| 44. | Bowmans Addition | 8.2% | 2.8%(+5.36)#44 | 3.1%(+5.09)#3,800 |
| 45. | Pittsville | 8.1% | 2.8%(+5.34)#45 | 3.1%(+5.06)#3,822 |
| 46. | Denton | 7.7% | 2.8%(+4.87)#46 | 3.1%(+4.60)#4,239 |
| 47. | Algonquin | 7.5% | 2.8%(+4.67)#47 | 3.1%(+4.40)#4,472 |
| 48. | Ferndale | 7.4% | 2.8%(+4.58)#48 | 3.1%(+4.31)#4,543 |
| 49. | Charlton | 7.4% | 2.8%(+4.58)#49 | 3.1%(+4.31)#4,549 |
| 50. | Lansdowne | 7.3% | 2.8%(+4.54)#50 | 3.1%(+4.27)#4,600 |
| 51. | Hughesville | 7.3% | 2.8%(+4.53)#51 | 3.1%(+4.26)#4,611 |
| 52. | Midlothian | 7.3% | 2.8%(+4.48)#52 | 3.1%(+4.21)#4,678 |
| 53. | Mount Lena | 7.3% | 2.8%(+4.47)#53 | 3.1%(+4.19)#4,698 |
| 54. | Millington | 6.9% | 2.8%(+4.10)#54 | 3.1%(+3.83)#5,104 |
| 55. | California | 6.9% | 2.8%(+4.06)#55 | 3.1%(+3.79)#5,167 |
| 56. | Maugansville | 6.6% | 2.8%(+3.85)#56 | 3.1%(+3.58)#5,482 |
| 57. | Perryman | 6.6% | 2.8%(+3.78)#57 | 3.1%(+3.51)#5,571 |
| 58. | St James | 6.6% | 2.8%(+3.78)#58 | 3.1%(+3.51)#5,582 |
| 59. | Drum Point | 6.4% | 2.8%(+3.65)#59 | 3.1%(+3.38)#5,776 |
| 60. | Coral Hills | 6.4% | 2.8%(+3.62)#60 | 3.1%(+3.35)#5,809 |
| 61. | Naval Academy | 6.2% | 2.8%(+3.42)#61 | 3.1%(+3.15)#6,110 |
| 62. | Colmar Manor | 6.2% | 2.8%(+3.38)#62 | 3.1%(+3.11)#6,181 |
| 63. | Riviera Beach | 6.1% | 2.8%(+3.29)#63 | 3.1%(+3.01)#6,327 |
| 64. | Grasonville | 6.0% | 2.8%(+3.24)#64 | 3.1%(+2.97)#6,400 |
| 65. | Jefferson | 6.0% | 2.8%(+3.23)#65 | 3.1%(+2.95)#6,427 |
| 66. | Golden Beach | 6.0% | 2.8%(+3.22)#66 | 3.1%(+2.95)#6,429 |
| 67. | Melwood | 6.0% | 2.8%(+3.22)#67 | 3.1%(+2.94)#6,431 |
| 68. | Deal Island | 6.0% | 2.8%(+3.16)#68 | 3.1%(+2.88)#6,529 |
| 69. | Queen Anne | 5.9% | 2.8%(+3.09)#69 | 3.1%(+2.81)#6,669 |
| 70. | Accident | 5.8% | 2.8%(+3.03)#70 | 3.1%(+2.76)#6,761 |
| 71. | Fairmount Heights | 5.8% | 2.8%(+2.96)#71 | 3.1%(+2.69)#6,902 |
| 72. | Dunkirk | 5.7% | 2.8%(+2.90)#72 | 3.1%(+2.63)#7,008 |
| 73. | Romancoke | 5.7% | 2.8%(+2.87)#73 | 3.1%(+2.60)#7,067 |
| 74. | Temple Hills | 5.5% | 2.8%(+2.75)#74 | 3.1%(+2.48)#7,315 |
| 75. | Piney Point | 5.5% | 2.8%(+2.75)#75 | 3.1%(+2.47)#7,324 |
| 76. | Woodsboro | 5.5% | 2.8%(+2.68)#76 | 3.1%(+2.41)#7,439 |
| 77. | Riverside | 5.5% | 2.8%(+2.67)#77 | 3.1%(+2.39)#7,471 |
| 78. | Hillsboro | 5.4% | 2.8%(+2.58)#78 | 3.1%(+2.31)#7,657 |
| 79. | Edgewater | 5.4% | 2.8%(+2.57)#79 | 3.1%(+2.30)#7,672 |
| 80. | Huntingtown | 5.4% | 2.8%(+2.57)#80 | 3.1%(+2.30)#7,676 |
| 81. | Peppermill Village | 5.3% | 2.8%(+2.55)#81 | 3.1%(+2.28)#7,714 |
| 82. | Potomac Heights | 5.3% | 2.8%(+2.53)#82 | 3.1%(+2.26)#7,749 |
| 83. | Edgemere | 5.3% | 2.8%(+2.46)#83 | 3.1%(+2.19)#7,907 |
| 84. | Willards | 5.2% | 2.8%(+2.41)#84 | 3.1%(+2.14)#7,988 |
| 85. | Cresaptown | 5.1% | 2.8%(+2.35)#85 | 3.1%(+2.08)#8,117 |
| 86. | Friendsville | 5.1% | 2.8%(+2.33)#86 | 3.1%(+2.06)#8,160 |
| 87. | Greensboro | 5.1% | 2.8%(+2.30)#87 | 3.1%(+2.02)#8,233 |
| 88. | Brooklyn Park | 5.1% | 2.8%(+2.29)#88 | 3.1%(+2.01)#8,257 |
| 89. | Croom | 5.1% | 2.8%(+2.27)#89 | 3.1%(+1.99)#8,310 |
| 90. | Savage | 5.0% | 2.8%(+2.24)#90 | 3.1%(+1.97)#8,365 |
| 91. | Perryville | 5.0% | 2.8%(+2.23)#91 | 3.1%(+1.96)#8,395 |
| 92. | New Carrollton | 5.0% | 2.8%(+2.17)#92 | 3.1%(+1.90)#8,533 |
| 93. | Hillandale | 4.9% | 2.8%(+2.13)#93 | 3.1%(+1.86)#8,644 |
| 94. | Rising Sun | 4.9% | 2.8%(+2.09)#94 | 3.1%(+1.82)#8,741 |
| 95. | Pylesville | 4.9% | 2.8%(+2.08)#95 | 3.1%(+1.80)#8,785 |
| 96. | Deale | 4.9% | 2.8%(+2.06)#96 | 3.1%(+1.79)#8,817 |
| 97. | Darlington | 4.8% | 2.8%(+2.03)#97 | 3.1%(+1.76)#8,887 |
| 98. | Brandywine | 4.8% | 2.8%(+2.02)#98 | 3.1%(+1.75)#8,914 |
| 99. | Jarrettsville | 4.8% | 2.8%(+2.01)#99 | 3.1%(+1.74)#8,944 |
| 100. | Prince Frederick | 4.8% | 2.8%(+1.98)#100 | 3.1%(+1.71)#8,995 |
Common Questions
What are the Top 10 Cities with the Highest Percentage of Population Employed in Installation, Maintenance & Repair in Maryland?
Top 10 Cities with the Highest Percentage of Population Employed in Installation, Maintenance & Repair in Maryland are:
#1
100.0%
#2
59.7%
#3
53.8%
#4
51.7%
#5
31.9%
#6
30.9%
#7
30.8%
#8
29.6%
#9
25.0%
#10
19.1%
What city has the Highest Percentage of Population Employed in Installation, Maintenance & Repair in Maryland?
National has the Highest Percentage of Population Employed in Installation, Maintenance & Repair in Maryland with 100.0%.
What is the Percentage of Population Employed in Installation, Maintenance & Repair in the State of Maryland?
Percentage of Population Employed in Installation, Maintenance & Repair in Maryland is 2.8%.
What is the Percentage of Population Employed in Installation, Maintenance & Repair in the United States?
Percentage of Population Employed in Installation, Maintenance & Repair in the United States is 3.1%.