Arizona Map & Demographics
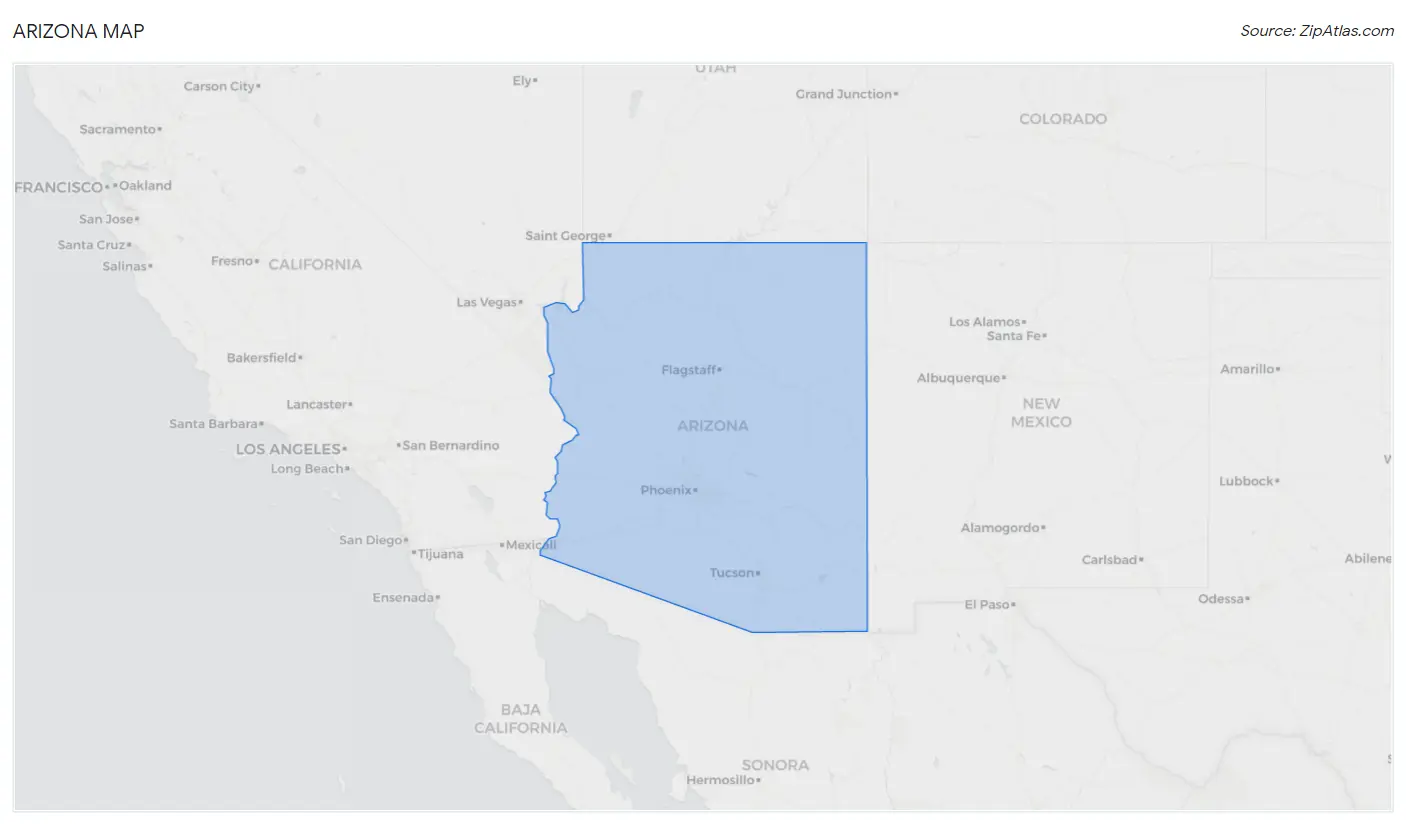
Arizona Map
Arizona Overview
Feb 14, 1912
INCORPORATED
113,990
TOTAL AREA [ SQ MI ]
113,595
LAND AREA [ SQ MI ]
396
WATER AREA [ SQ MI ]
4,100
ELEVATION AVG [ FT ]
12,633
ELEVATION HIGH [ FT ]
70
ELEVATION LOW [ FT ]
63.1
POP DENSITY [ PPL / SQ MI ]
$38,334
PER CAPITA INCOME
$86,737
AVG FAMILY INCOME
$72,581
AVG HOUSEHOLD INCOME
22.5%
WAGE / INCOME GAP [ % ]
77.5¢/ $1
WAGE / INCOME GAP [ $ ]
$11,744
FAMILY INCOME DEFICIT
0.46
INEQUALITY / GINI INDEX
85142
LARGEST ZIP CODE
Phoenix
LARGEST CITY
Maricopa County
LARGEST COUNTY
7,172,282
TOTAL POPULATION
3,588,510
MALE POPULATION
3,583,772
FEMALE POPULATION
100.13
MALES / 100 FEMALES
99.87
FEMALES / 100 MALES
38.4
MEDIAN AGE
3.1
AVG FAMILY SIZE
2.6
AVG HOUSEHOLD SIZE
3,487,472
LABOR FORCE [ PEOPLE ]
60.5%
PERCENT IN LABOR FORCE
5.4%
UNEMPLOYMENT RATE
Income in Arizona
Income Overview in Arizona
Per Capita Income in Arizona is $38,334, while median incomes of families and households are $86,737 and $72,581 respectively.
| Characteristic | Number | Measure |
| Per Capita Income | 7,172,282 | $38,334 |
| Median Family Income | 1,780,293 | $86,737 |
| Mean Family Income | 1,780,293 | $113,131 |
| Median Household Income | 2,739,136 | $72,581 |
| Mean Household Income | 2,739,136 | $98,569 |
| Income Deficit | 1,780,293 | $11,744 |
| Wage / Income Gap (%) | 7,172,282 | 22.55% |
| Wage / Income Gap ($) | 7,172,282 | 77.45¢ per $1 |
| Gini / Inequality Index | 7,172,282 | 0.46 |
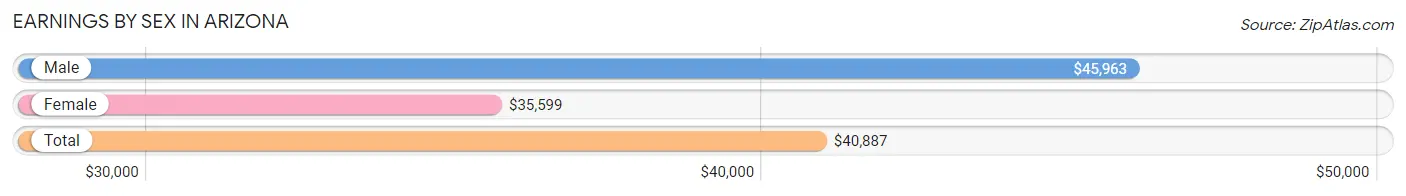
Earnings by Sex in Arizona
Average Earnings in Arizona are $40,887, $45,963 for men and $35,599 for women, a difference of 22.6%.
| Sex | Number | Average Earnings |
| Male | 1,955,429 (53.8%) | $45,963 |
| Female | 1,675,904 (46.2%) | $35,599 |
| Total | 3,631,333 (100.0%) | $40,887 |
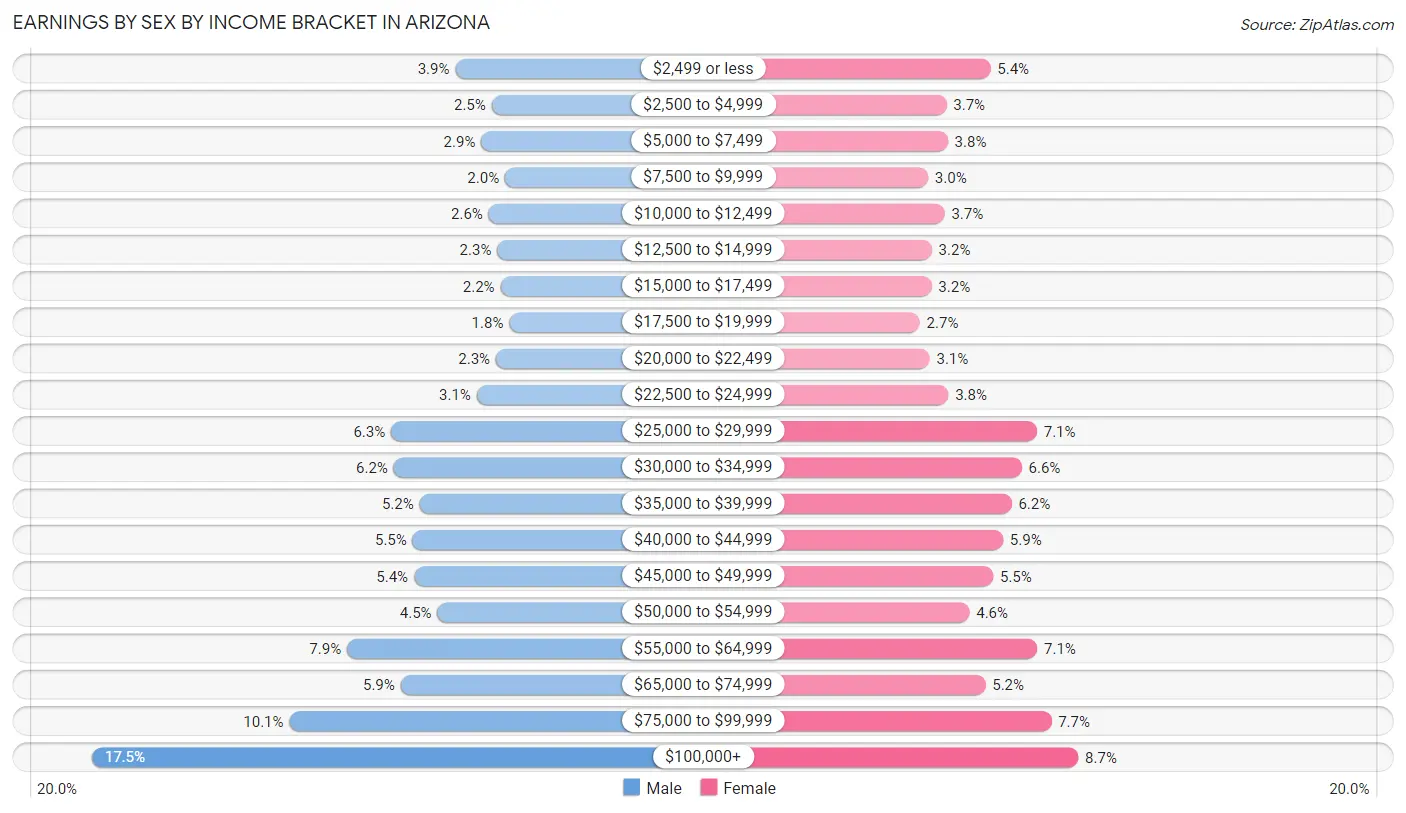
Earnings by Sex by Income Bracket in Arizona
The most common earnings brackets in Arizona are $100,000+ for men (341,792 | 17.5%) and $100,000+ for women (145,362 | 8.7%).
| Income | Male | Female |
| $2,499 or less | 75,442 (3.9%) | 90,124 (5.4%) |
| $2,500 to $4,999 | 48,875 (2.5%) | 62,574 (3.7%) |
| $5,000 to $7,499 | 56,478 (2.9%) | 63,335 (3.8%) |
| $7,500 to $9,999 | 39,064 (2.0%) | 50,882 (3.0%) |
| $10,000 to $12,499 | 51,082 (2.6%) | 61,332 (3.7%) |
| $12,500 to $14,999 | 44,718 (2.3%) | 53,302 (3.2%) |
| $15,000 to $17,499 | 42,395 (2.2%) | 53,170 (3.2%) |
| $17,500 to $19,999 | 35,964 (1.8%) | 45,815 (2.7%) |
| $20,000 to $22,499 | 45,833 (2.3%) | 52,023 (3.1%) |
| $22,500 to $24,999 | 59,915 (3.1%) | 63,631 (3.8%) |
| $25,000 to $29,999 | 122,667 (6.3%) | 119,328 (7.1%) |
| $30,000 to $34,999 | 120,714 (6.2%) | 109,834 (6.6%) |
| $35,000 to $39,999 | 101,755 (5.2%) | 103,396 (6.2%) |
| $40,000 to $44,999 | 106,680 (5.5%) | 98,058 (5.9%) |
| $45,000 to $49,999 | 105,849 (5.4%) | 91,911 (5.5%) |
| $50,000 to $54,999 | 88,595 (4.5%) | 77,004 (4.6%) |
| $55,000 to $64,999 | 154,933 (7.9%) | 119,444 (7.1%) |
| $65,000 to $74,999 | 115,638 (5.9%) | 87,029 (5.2%) |
| $75,000 to $99,999 | 197,040 (10.1%) | 128,350 (7.7%) |
| $100,000+ | 341,792 (17.5%) | 145,362 (8.7%) |
| Total | 1,955,429 (100.0%) | 1,675,904 (100.0%) |
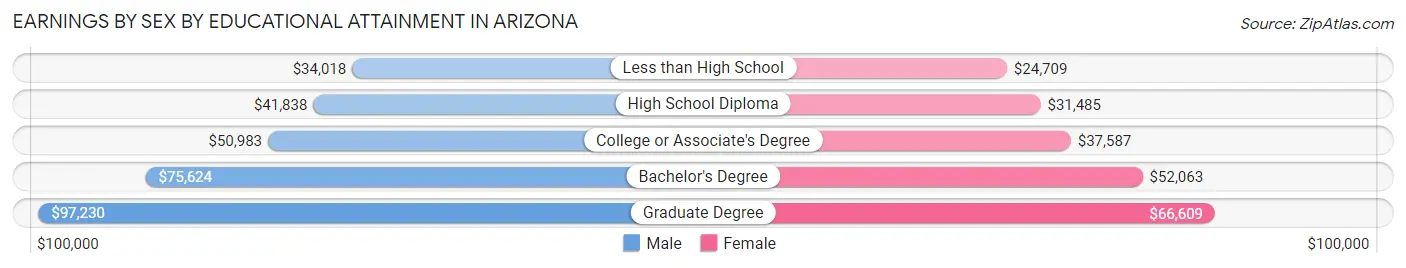
Earnings by Sex by Educational Attainment in Arizona
Average earnings in Arizona are $52,764 for men and $40,843 for women, a difference of 22.6%. Men with an educational attainment of graduate degree enjoy the highest average annual earnings of $97,230, while those with less than high school education earn the least with $34,018. Women with an educational attainment of graduate degree earn the most with the average annual earnings of $66,609, while those with less than high school education have the smallest earnings of $24,709.
| Educational Attainment | Male Income | Female Income |
| Less than High School | $34,018 | $24,709 |
| High School Diploma | $41,838 | $31,485 |
| College or Associate's Degree | $50,983 | $37,587 |
| Bachelor's Degree | $75,624 | $52,063 |
| Graduate Degree | $97,230 | $66,609 |
| Total | $52,764 | $40,843 |
Family Income in Arizona
Family Income Brackets in Arizona
According to the Arizona family income data, there are 363,180 families falling into the $100,000 to $149,999 income range, which is the most common income bracket and makes up 20.4% of all families. Conversely, the $10,000 to $14,999 income bracket is the least frequent group with only 30,265 families (1.7%) belonging to this category.
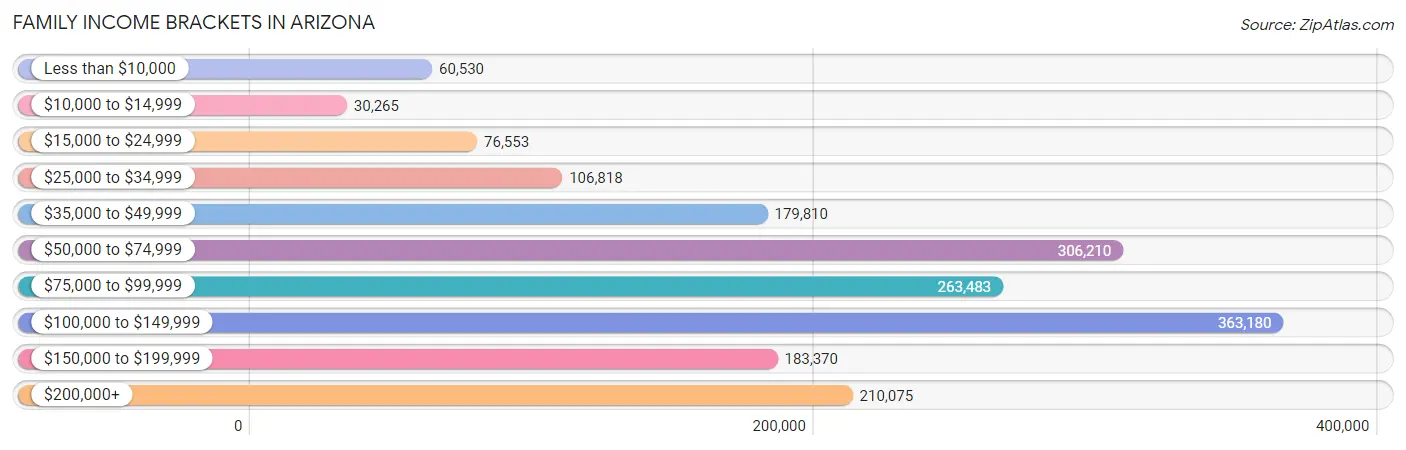
| Income Bracket | # Families | % Families |
| Less than $10,000 | 60,530 | 3.4% |
| $10,000 to $14,999 | 30,265 | 1.7% |
| $15,000 to $24,999 | 76,553 | 4.3% |
| $25,000 to $34,999 | 106,818 | 6.0% |
| $35,000 to $49,999 | 179,810 | 10.1% |
| $50,000 to $74,999 | 306,210 | 17.2% |
| $75,000 to $99,999 | 263,483 | 14.8% |
| $100,000 to $149,999 | 363,180 | 20.4% |
| $150,000 to $199,999 | 183,370 | 10.3% |
| $200,000+ | 210,075 | 11.8% |
Family Income by Famaliy Size in Arizona
4-person families (296,664 | 16.7%) account for the highest median family income in Arizona with $101,783 per family, while 2-person families (857,295 | 48.1%) have the highest median income of $39,574 per family member.
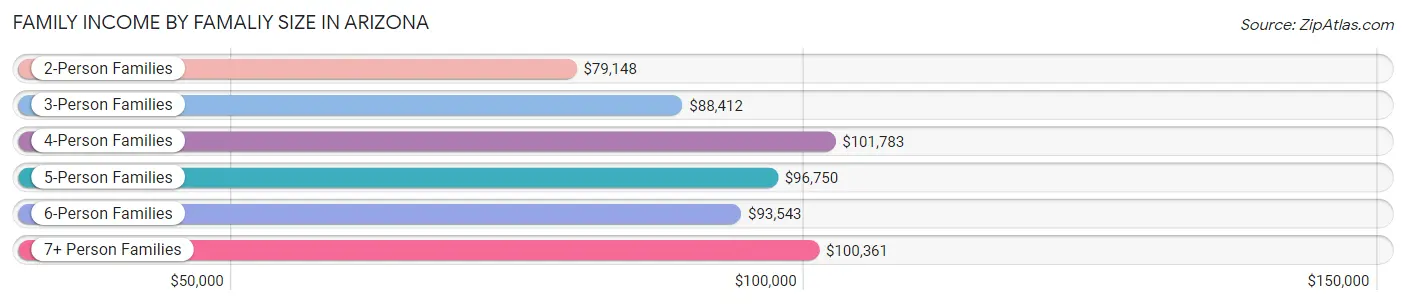
| Income Bracket | # Families | Median Income |
| 2-Person Families | 857,295 (48.1%) | $79,148 |
| 3-Person Families | 356,460 (20.0%) | $88,412 |
| 4-Person Families | 296,664 (16.7%) | $101,783 |
| 5-Person Families | 154,387 (8.7%) | $96,750 |
| 6-Person Families | 69,440 (3.9%) | $93,543 |
| 7+ Person Families | 46,047 (2.6%) | $100,361 |
| Total | 1,780,293 (100.0%) | $86,737 |
Family Income by Number of Earners in Arizona
The median family income in Arizona is $86,737, with families comprising 3+ earners (196,236) having the highest median family income of $135,208, while families with no earners (329,699) have the lowest median family income of $56,107, accounting for 11.0% and 18.5% of families, respectively.
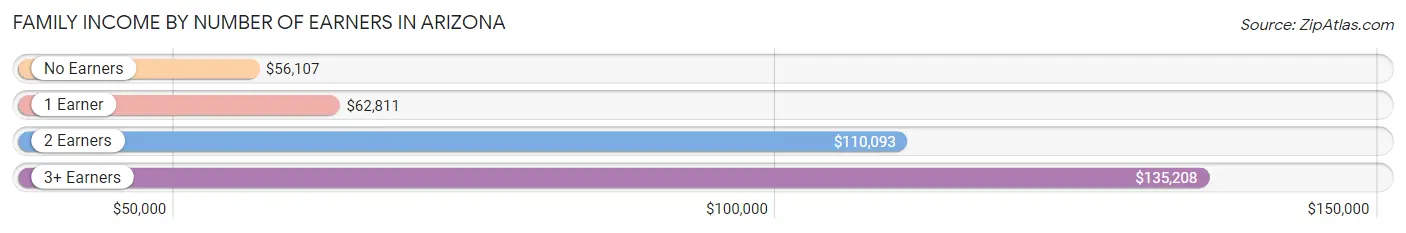
| Number of Earners | # Families | Median Income |
| No Earners | 329,699 (18.5%) | $56,107 |
| 1 Earner | 579,079 (32.5%) | $62,811 |
| 2 Earners | 675,279 (37.9%) | $110,093 |
| 3+ Earners | 196,236 (11.0%) | $135,208 |
| Total | 1,780,293 (100.0%) | $86,737 |
Household Income in Arizona
Household Income Brackets in Arizona
With 482,088 households falling in the category, the $50,000 to $74,999 income range is the most frequent in Arizona, accounting for 17.6% of all households. In contrast, only 84,913 households (3.1%) fall into the $10,000 to $14,999 income bracket, making it the least populous group.
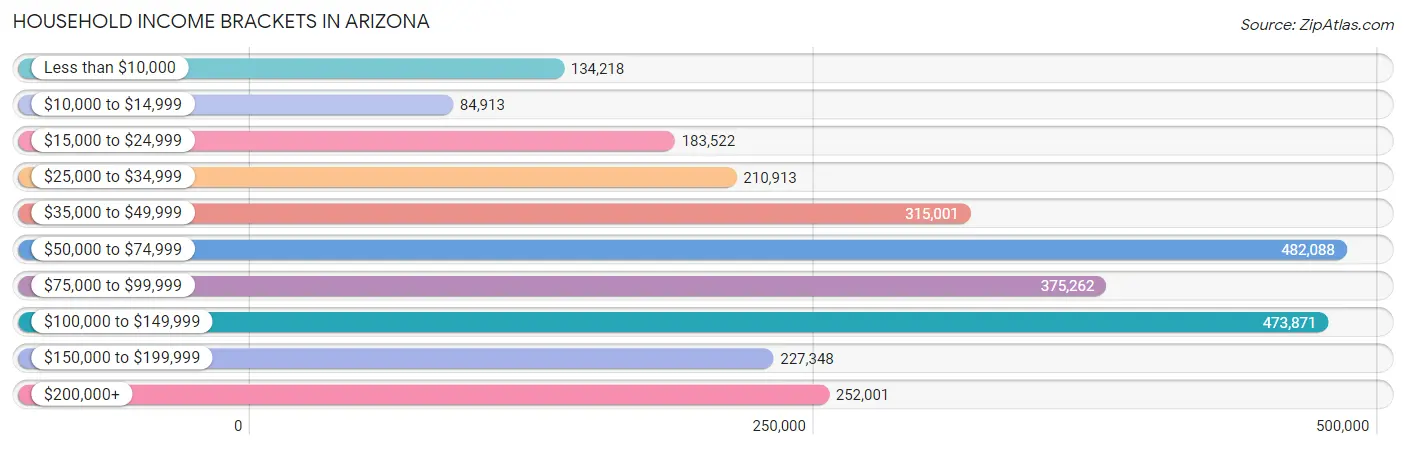
| Income Bracket | # Households | % Households |
| Less than $10,000 | 134,218 | 4.9% |
| $10,000 to $14,999 | 84,913 | 3.1% |
| $15,000 to $24,999 | 183,522 | 6.7% |
| $25,000 to $34,999 | 210,913 | 7.7% |
| $35,000 to $49,999 | 315,001 | 11.5% |
| $50,000 to $74,999 | 482,088 | 17.6% |
| $75,000 to $99,999 | 375,262 | 13.7% |
| $100,000 to $149,999 | 473,871 | 17.3% |
| $150,000 to $199,999 | 227,348 | 8.3% |
| $200,000+ | 252,001 | 9.2% |
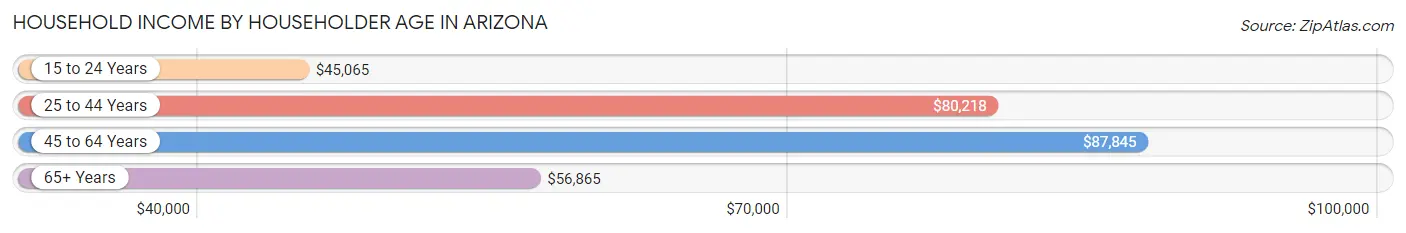
Household Income by Householder Age in Arizona
The median household income in Arizona is $72,581, with the highest median household income of $87,845 found in the 45 to 64 years age bracket for the primary householder. A total of 945,636 households (34.5%) fall into this category. Meanwhile, the 15 to 24 years age bracket for the primary householder has the lowest median household income of $45,065, with 127,289 households (4.6%) in this group.
| Income Bracket | # Households | Median Income |
| 15 to 24 Years | 127,289 (4.6%) | $45,065 |
| 25 to 44 Years | 871,604 (31.8%) | $80,218 |
| 45 to 64 Years | 945,636 (34.5%) | $87,845 |
| 65+ Years | 794,607 (29.0%) | $56,865 |
| Total | 2,739,136 (100.0%) | $72,581 |
Poverty in Arizona
Income Below Poverty by Sex and Age in Arizona
With 12.1% poverty level for males and 14.0% for females among the residents of Arizona, under 5 year old males and 18 to 24 year old females are the most vulnerable to poverty, with 39,209 males (19.4%) and 66,220 females (21.0%) in their respective age groups living below the poverty level.
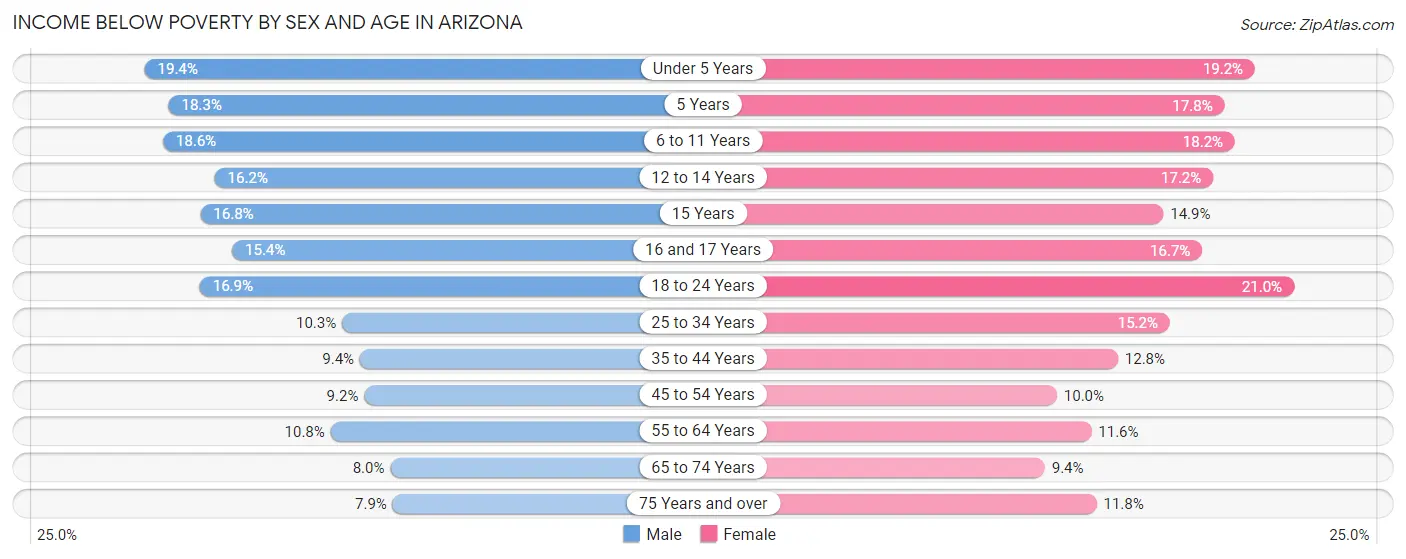
| Age Bracket | Male | Female |
| Under 5 Years | 39,209 (19.4%) | 37,016 (19.2%) |
| 5 Years | 7,633 (18.3%) | 7,128 (17.8%) |
| 6 to 11 Years | 50,492 (18.6%) | 47,117 (18.2%) |
| 12 to 14 Years | 22,923 (16.2%) | 23,673 (17.2%) |
| 15 Years | 8,380 (16.8%) | 6,974 (14.9%) |
| 16 and 17 Years | 14,426 (15.4%) | 15,061 (16.7%) |
| 18 to 24 Years | 57,113 (16.9%) | 66,220 (21.0%) |
| 25 to 34 Years | 50,373 (10.3%) | 71,441 (15.2%) |
| 35 to 44 Years | 41,731 (9.4%) | 55,437 (12.8%) |
| 45 to 54 Years | 38,190 (9.2%) | 41,543 (10.0%) |
| 55 to 64 Years | 44,461 (10.8%) | 51,174 (11.6%) |
| 65 to 74 Years | 27,902 (8.0%) | 36,990 (9.4%) |
| 75 Years and over | 19,239 (7.9%) | 35,030 (11.8%) |
| Total | 422,072 (12.1%) | 494,804 (14.0%) |
Income Above Poverty by Sex and Age in Arizona
According to the poverty statistics in Arizona, males aged 75 years and over and females aged 65 to 74 years are the age groups that are most secure financially, with 92.1% of males and 90.6% of females in these age groups living above the poverty line.
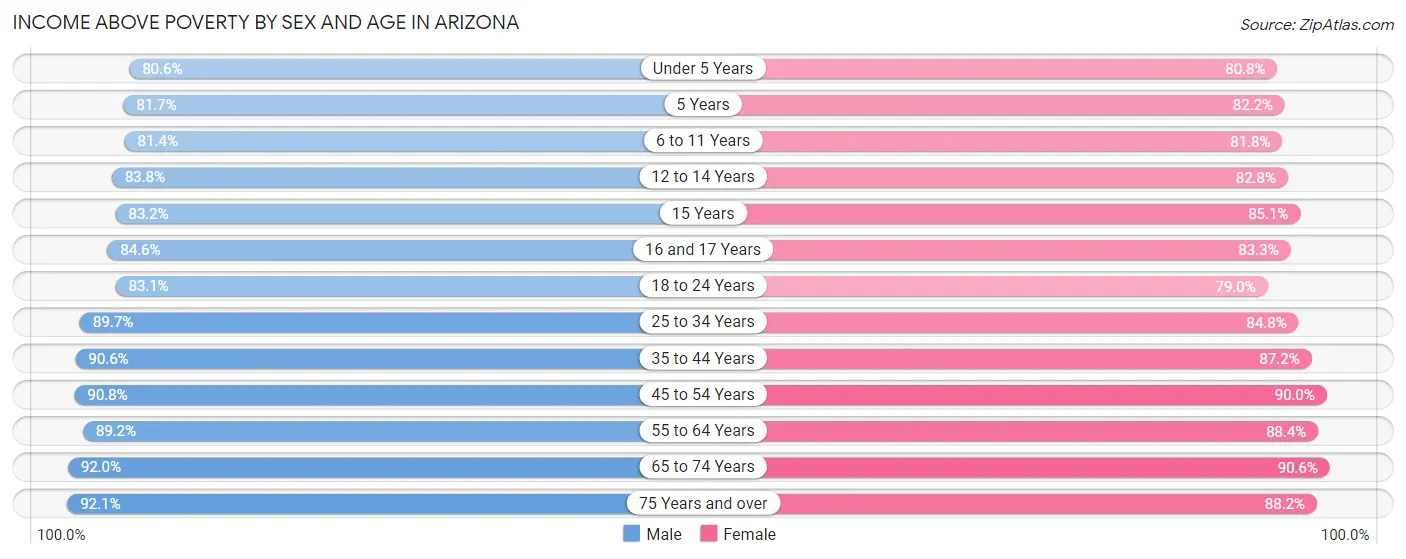
| Age Bracket | Male | Female |
| Under 5 Years | 162,630 (80.6%) | 156,076 (80.8%) |
| 5 Years | 34,026 (81.7%) | 33,009 (82.2%) |
| 6 to 11 Years | 221,287 (81.4%) | 211,194 (81.8%) |
| 12 to 14 Years | 118,748 (83.8%) | 113,732 (82.8%) |
| 15 Years | 41,396 (83.2%) | 39,767 (85.1%) |
| 16 and 17 Years | 79,421 (84.6%) | 74,994 (83.3%) |
| 18 to 24 Years | 281,475 (83.1%) | 249,472 (79.0%) |
| 25 to 34 Years | 439,964 (89.7%) | 398,008 (84.8%) |
| 35 to 44 Years | 400,545 (90.6%) | 377,438 (87.2%) |
| 45 to 54 Years | 375,171 (90.8%) | 374,785 (90.0%) |
| 55 to 64 Years | 367,029 (89.2%) | 390,703 (88.4%) |
| 65 to 74 Years | 319,433 (92.0%) | 355,752 (90.6%) |
| 75 Years and over | 223,621 (92.1%) | 261,224 (88.2%) |
| Total | 3,064,746 (87.9%) | 3,036,154 (86.0%) |
Income Below Poverty Among Married-Couple Families in Arizona
The poverty statistics for married-couple families in Arizona show that 5.2% or 67,477 of the total 1,291,812 families live below the poverty line. Families with 5 or more children have the highest poverty rate of 20.0%, comprising of 2,815 families. On the other hand, families with no children have the lowest poverty rate of 3.8%, which includes 29,693 families.
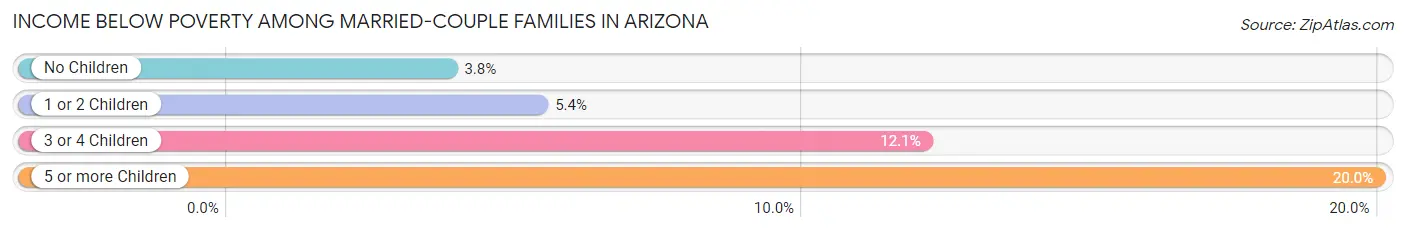
| Children | Above Poverty | Below Poverty |
| No Children | 747,937 (96.2%) | 29,693 (3.8%) |
| 1 or 2 Children | 360,506 (94.6%) | 20,582 (5.4%) |
| 3 or 4 Children | 104,609 (87.9%) | 14,387 (12.1%) |
| 5 or more Children | 11,283 (80.0%) | 2,815 (20.0%) |
| Total | 1,224,335 (94.8%) | 67,477 (5.2%) |
Income Below Poverty Among Single-Parent Households in Arizona
According to the poverty data in Arizona, 13.0% or 20,444 single-father households and 23.0% or 75,981 single-mother households are living below the poverty line. Among single-father households, those with 5 or more children have the highest poverty rate, with 741 households (36.6%) experiencing poverty. Likewise, among single-mother households, those with 5 or more children have the highest poverty rate, with 3,971 households (68.0%) falling below the poverty line.
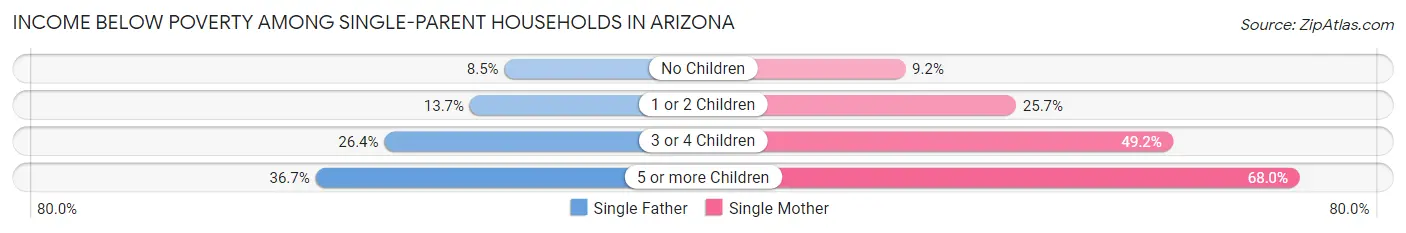
| Children | Single Father | Single Mother |
| No Children | 5,661 (8.5%) | 11,396 (9.2%) |
| 1 or 2 Children | 10,100 (13.7%) | 41,537 (25.7%) |
| 3 or 4 Children | 3,942 (26.4%) | 19,077 (49.2%) |
| 5 or more Children | 741 (36.6%) | 3,971 (68.0%) |
| Total | 20,444 (13.0%) | 75,981 (23.0%) |
Income Below Poverty Among Married-Couple vs Single-Parent Households in Arizona
The poverty data for Arizona shows that 67,477 of the married-couple family households (5.2%) and 96,425 of the single-parent households (19.7%) are living below the poverty level. Within the married-couple family households, those with 5 or more children have the highest poverty rate, with 2,815 households (20.0%) falling below the poverty line. Among the single-parent households, those with 5 or more children have the highest poverty rate, with 4,712 household (59.9%) living below poverty.
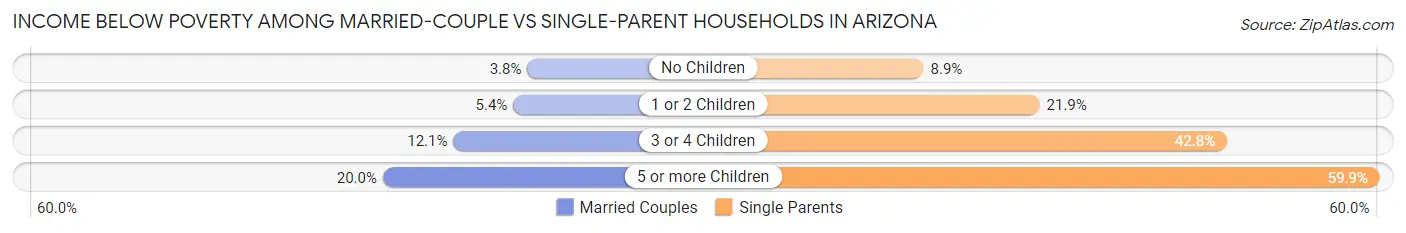
| Children | Married-Couple Families | Single-Parent Households |
| No Children | 29,693 (3.8%) | 17,057 (8.9%) |
| 1 or 2 Children | 20,582 (5.4%) | 51,637 (21.9%) |
| 3 or 4 Children | 14,387 (12.1%) | 23,019 (42.8%) |
| 5 or more Children | 2,815 (20.0%) | 4,712 (59.9%) |
| Total | 67,477 (5.2%) | 96,425 (19.7%) |
Largest Zip Codes by Population in Arizona
The largest zip codes in Arizona by population are 85142 (82,360), 85326 (73,579), 85225 (73,116), 85364 (71,910), and 85383 (69,177).
1.85142
82,360 (1.15%)
2.85326
73,579 (1.03%)
3.85225
73,116 (1.02%)
4.85364
71,910 (1.00%)
5.85383
69,177 (0.96%)
6.85032
68,805 (0.96%)
7.85281
68,623 (0.96%)
8.85301
67,781 (0.95%)
9.85204
66,851 (0.93%)
10.85308
63,789 (0.89%)
11.85041
62,702 (0.87%)
12.85345
61,801 (0.86%)
13.85008
61,759 (0.86%)
14.85338
60,922 (0.85%)
15.85033
59,904 (0.84%)
16.85706
57,897 (0.81%)
17.85705
56,344 (0.79%)
18.85122
55,919 (0.78%)
19.85295
54,556 (0.76%)
20.85035
54,535 (0.76%)
21.85710
52,982 (0.74%)
22.85282
52,828 (0.74%)
23.85009
52,420 (0.73%)
24.85037
51,987 (0.72%)
25.85201
51,840 (0.72%)
26.85022
51,826 (0.72%)
27.85365
51,394 (0.72%)
28.85339
50,686 (0.71%)
29.85296
50,570 (0.71%)
30.85029
49,592 (0.69%)
Largest Cities by Population in Arizona
The largest cities in Arizona by population are Phoenix (1,609,456), Tucson (541,033), Mesa (503,390), Chandler (275,618), and Gilbert (267,267).
1.Phoenix
1,609,456 (22.44%)
2.Tucson
541,033 (7.54%)
3.Mesa
503,390 (7.02%)
4.Chandler
275,618 (3.84%)
5.Gilbert
267,267 (3.73%)
6.Glendale
248,083 (3.46%)
240,537 (3.35%)
8.Peoria
191,292 (2.67%)
9.Tempe
181,005 (2.52%)
10.Surprise
145,591 (2.03%)
101,207 (1.41%)
12.Goodyear
97,542 (1.36%)
13.Yuma
96,314 (1.34%)
14.Buckeye
95,042 (1.33%)
15.Avondale
89,214 (1.24%)
16.Flagstaff
76,177 (1.06%)
17.Casas Adobes
69,917 (0.97%)
18.Queen Creek
61,788 (0.86%)
19.Maricopa
59,605 (0.83%)
57,294 (0.80%)
21.Casa Grande
55,186 (0.77%)
22.Marana
52,542 (0.73%)
50,573 (0.71%)
24.Oro Valley
47,053 (0.66%)
47,015 (0.66%)
26.Prescott
46,054 (0.64%)
27.Sierra Vista
45,212 (0.63%)
41,593 (0.58%)
38,855 (0.54%)
30.Sun City
37,748 (0.53%)
Largest Counties by Population in Arizona
The largest counties in Arizona by population are Maricopa County (4,430,871), Pima County (1,042,393), Pinal County (433,338), Yavapai County (237,830), and Mohave County (214,229).
4,430,871 (61.78%)
1,042,393 (14.53%)
433,338 (6.04%)
237,830 (3.32%)
214,229 (2.99%)
204,374 (2.85%)
144,705 (2.02%)
125,504 (1.75%)
107,110 (1.49%)
66,054 (0.92%)
11.Gila County
53,419 (0.74%)
47,838 (0.67%)
38,453 (0.54%)
16,681 (0.23%)
9,483 (0.13%)
Race in Arizona
The most populous races in Arizona are White / Caucasian (4,781,702 | 66.7%), Hispanic or Latino (2,297,513 | 32.0%), and Two or more Races (961,794 | 13.4%).
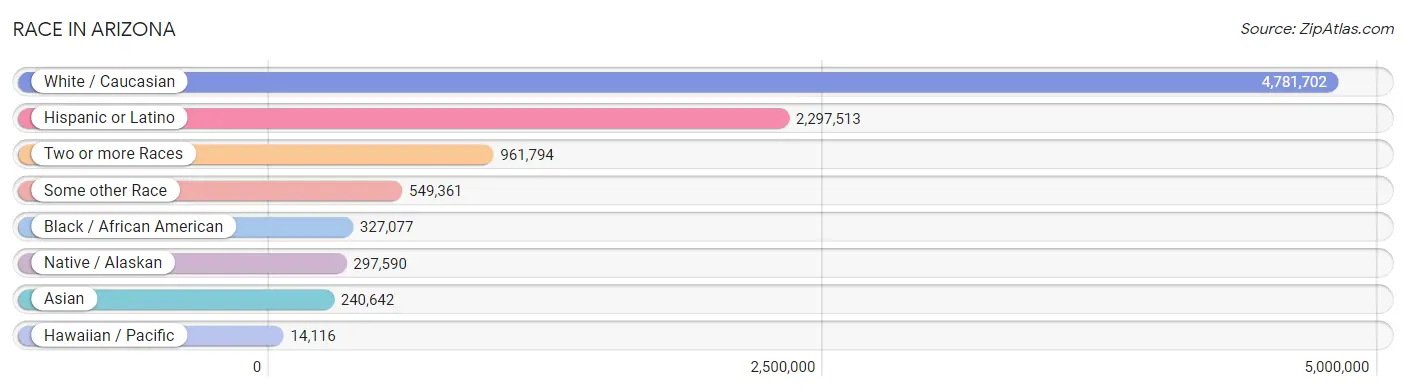
| Race | # Population | % Population |
| Asian | 240,642 | 3.4% |
| Black / African American | 327,077 | 4.6% |
| Hawaiian / Pacific | 14,116 | 0.2% |
| Hispanic or Latino | 2,297,513 | 32.0% |
| Native / Alaskan | 297,590 | 4.2% |
| White / Caucasian | 4,781,702 | 66.7% |
| Two or more Races | 961,794 | 13.4% |
| Some other Race | 549,361 | 7.7% |
| Total | 7,172,282 | 100.0% |
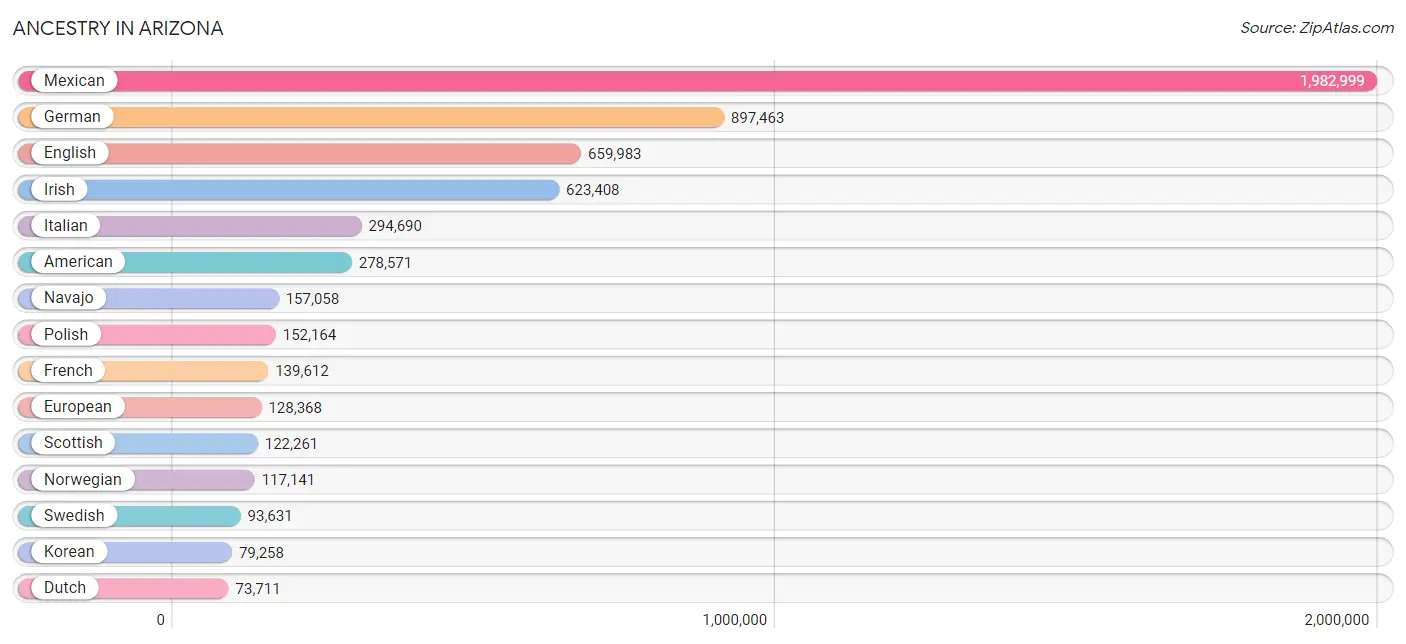
Ancestry in Arizona
The most populous ancestries reported in Arizona are Mexican (1,982,999 | 27.7%), German (897,463 | 12.5%), English (659,983 | 9.2%), Irish (623,408 | 8.7%), and Italian (294,690 | 4.1%), together accounting for 62.2% of all Arizona residents.
| Ancestry | # Population | % Population |
| Afghan | 2,930 | 0.0% |
| African | 25,428 | 0.4% |
| Alaska Native | 341 | 0.0% |
| Alaskan Athabascan | 326 | 0.0% |
| Albanian | 2,338 | 0.0% |
| Aleut | 396 | 0.0% |
| Alsatian | 168 | 0.0% |
| American | 278,571 | 3.9% |
| Apache | 35,033 | 0.5% |
| Arab | 37,242 | 0.5% |
| Arapaho | 243 | 0.0% |
| Argentinean | 3,895 | 0.1% |
| Armenian | 5,358 | 0.1% |
| Assyrian / Chaldean / Syriac | 4,862 | 0.1% |
| Australian | 2,759 | 0.0% |
| Austrian | 12,560 | 0.2% |
| Bahamian | 343 | 0.0% |
| Bangladeshi | 345 | 0.0% |
| Barbadian | 553 | 0.0% |
| Basque | 1,699 | 0.0% |
| Belgian | 6,038 | 0.1% |
| Belizean | 935 | 0.0% |
| Bermudan | 34 | 0.0% |
| Bhutanese | 29,238 | 0.4% |
| Blackfeet | 4,598 | 0.1% |
| Bolivian | 846 | 0.0% |
| Brazilian | 4,793 | 0.1% |
| British | 44,689 | 0.6% |
| British West Indian | 263 | 0.0% |
| Bulgarian | 2,475 | 0.0% |
| Burmese | 27,315 | 0.4% |
| Cajun | 576 | 0.0% |
| Cambodian | 341 | 0.0% |
| Canadian | 20,564 | 0.3% |
| Cape Verdean | 372 | 0.0% |
| Carpatho Rusyn | 168 | 0.0% |
| Celtic | 1,409 | 0.0% |
| Central American | 64,564 | 0.9% |
| Central American Indian | 7,217 | 0.1% |
| Cherokee | 21,181 | 0.3% |
| Cheyenne | 425 | 0.0% |
| Chickasaw | 1,833 | 0.0% |
| Chilean | 3,052 | 0.0% |
| Chinese | 285 | 0.0% |
| Chippewa | 2,789 | 0.0% |
| Choctaw | 6,160 | 0.1% |
| Colombian | 11,457 | 0.2% |
| Colville | 205 | 0.0% |
| Comanche | 881 | 0.0% |
| Costa Rican | 3,042 | 0.0% |
| Cree | 383 | 0.0% |
| Creek | 1,514 | 0.0% |
| Croatian | 9,462 | 0.1% |
| Crow | 421 | 0.0% |
| Cuban | 20,149 | 0.3% |
| Cypriot | 216 | 0.0% |
| Czech | 24,757 | 0.4% |
| Czechoslovakian | 6,912 | 0.1% |
| Danish | 39,214 | 0.5% |
| Delaware | 433 | 0.0% |
| Dominican | 6,404 | 0.1% |
| Dutch | 73,711 | 1.0% |
| Dutch West Indian | 320 | 0.0% |
| Eastern European | 18,556 | 0.3% |
| Ecuadorian | 4,240 | 0.1% |
| Egyptian | 3,893 | 0.1% |
| English | 659,983 | 9.2% |
| Estonian | 586 | 0.0% |
| Ethiopian | 5,221 | 0.1% |
| European | 128,368 | 1.8% |
| Fijian | 1,333 | 0.0% |
| Filipino | 3,851 | 0.1% |
| Finnish | 14,922 | 0.2% |
| French | 139,612 | 1.9% |
| French American Indian | 832 | 0.0% |
| French Canadian | 28,423 | 0.4% |
| German | 897,463 | 12.5% |
| German Russian | 210 | 0.0% |
| Ghanaian | 1,049 | 0.0% |
| Greek | 24,551 | 0.3% |
| Guamanian / Chamorro | 5,321 | 0.1% |
| Guatemalan | 24,113 | 0.3% |
| Guyanese | 678 | 0.0% |
| Haitian | 2,828 | 0.0% |
| Hmong | 11 | 0.0% |
| Honduran | 6,392 | 0.1% |
| Hopi | 14,003 | 0.2% |
| Houma | 195 | 0.0% |
| Hungarian | 26,289 | 0.4% |
| Icelander | 1,040 | 0.0% |
| Indian (Asian) | 62,390 | 0.9% |
| Indonesian | 3,740 | 0.1% |
| Inupiat | 906 | 0.0% |
| Iranian | 8,449 | 0.1% |
| Iraqi | 6,788 | 0.1% |
| Irish | 623,408 | 8.7% |
| Iroquois | 1,609 | 0.0% |
| Israeli | 2,255 | 0.0% |
| Italian | 294,690 | 4.1% |
| Jamaican | 7,410 | 0.1% |
| Japanese | 4,573 | 0.1% |
| Jordanian | 2,059 | 0.0% |
| Kenyan | 1,548 | 0.0% |
| Kiowa | 506 | 0.0% |
| Korean | 79,258 | 1.1% |
| Laotian | 3,298 | 0.1% |
| Latvian | 1,473 | 0.0% |
| Lebanese | 9,970 | 0.1% |
| Liberian | 1,376 | 0.0% |
| Lithuanian | 11,984 | 0.2% |
| Lumbee | 154 | 0.0% |
| Luxembourger | 1,202 | 0.0% |
| Macedonian | 957 | 0.0% |
| Malaysian | 3,100 | 0.0% |
| Maltese | 425 | 0.0% |
| Marshallese | 134 | 0.0% |
| Menominee | 222 | 0.0% |
| Mexican | 1,982,999 | 27.7% |
| Mexican American Indian | 13,482 | 0.2% |
| Mongolian | 401 | 0.0% |
| Moroccan | 1,196 | 0.0% |
| Native Hawaiian | 12,448 | 0.2% |
| Navajo | 157,058 | 2.2% |
| New Zealander | 399 | 0.0% |
| Nicaraguan | 5,468 | 0.1% |
| Nigerian | 5,848 | 0.1% |
| Northern European | 12,865 | 0.2% |
| Norwegian | 117,141 | 1.6% |
| Okinawan | 134 | 0.0% |
| Osage | 419 | 0.0% |
| Ottawa | 177 | 0.0% |
| Paiute | 560 | 0.0% |
| Pakistani | 7,830 | 0.1% |
| Palestinian | 1,681 | 0.0% |
| Panamanian | 3,628 | 0.1% |
| Paraguayan | 231 | 0.0% |
| Pennsylvania German | 1,825 | 0.0% |
| Peruvian | 7,521 | 0.1% |
| Pima | 24,399 | 0.3% |
| Polish | 152,164 | 2.1% |
| Portuguese | 17,874 | 0.3% |
| Potawatomi | 765 | 0.0% |
| Pueblo | 3,426 | 0.1% |
| Puerto Rican | 53,299 | 0.7% |
| Puget Sound Salish | 261 | 0.0% |
| Romanian | 12,753 | 0.2% |
| Russian | 43,708 | 0.6% |
| Salvadoran | 21,320 | 0.3% |
| Samoan | 4,623 | 0.1% |
| Scandinavian | 29,216 | 0.4% |
| Scotch-Irish | 52,090 | 0.7% |
| Scottish | 122,261 | 1.7% |
| Seminole | 222 | 0.0% |
| Senegalese | 324 | 0.0% |
| Serbian | 7,124 | 0.1% |
| Shoshone | 785 | 0.0% |
| Sierra Leonean | 247 | 0.0% |
| Sioux | 5,048 | 0.1% |
| Slavic | 2,821 | 0.0% |
| Slovak | 8,902 | 0.1% |
| Slovene | 3,251 | 0.1% |
| Somali | 3,078 | 0.0% |
| South African | 1,620 | 0.0% |
| South American | 35,388 | 0.5% |
| South American Indian | 1,238 | 0.0% |
| Soviet Union | 110 | 0.0% |
| Spaniard | 35,560 | 0.5% |
| Spanish | 29,071 | 0.4% |
| Spanish American | 778 | 0.0% |
| Spanish American Indian | 218 | 0.0% |
| Sri Lankan | 36,294 | 0.5% |
| Subsaharan African | 54,156 | 0.8% |
| Sudanese | 2,479 | 0.0% |
| Swedish | 93,631 | 1.3% |
| Swiss | 18,248 | 0.3% |
| Syrian | 3,037 | 0.0% |
| Taiwanese | 98 | 0.0% |
| Thai | 68,957 | 1.0% |
| Tlingit-Haida | 655 | 0.0% |
| Tohono O'Odham | 20,413 | 0.3% |
| Tongan | 1,842 | 0.0% |
| Trinidadian and Tobagonian | 1,306 | 0.0% |
| Tsimshian | 39 | 0.0% |
| Turkish | 3,184 | 0.0% |
| U.S. Virgin Islander | 201 | 0.0% |
| Ugandan | 277 | 0.0% |
| Ukrainian | 15,088 | 0.2% |
| Uruguayan | 248 | 0.0% |
| Ute | 318 | 0.0% |
| Venezuelan | 3,529 | 0.1% |
| Vietnamese | 2,844 | 0.0% |
| Welsh | 42,898 | 0.6% |
| West Indian | 2,122 | 0.0% |
| Yakama | 104 | 0.0% |
| Yaqui | 24,861 | 0.4% |
| Yugoslavian | 6,026 | 0.1% |
| Yuman | 6,460 | 0.1% |
| Yup'ik | 327 | 0.0% |
| Zimbabwean | 288 | 0.0% | View All 199 Rows |
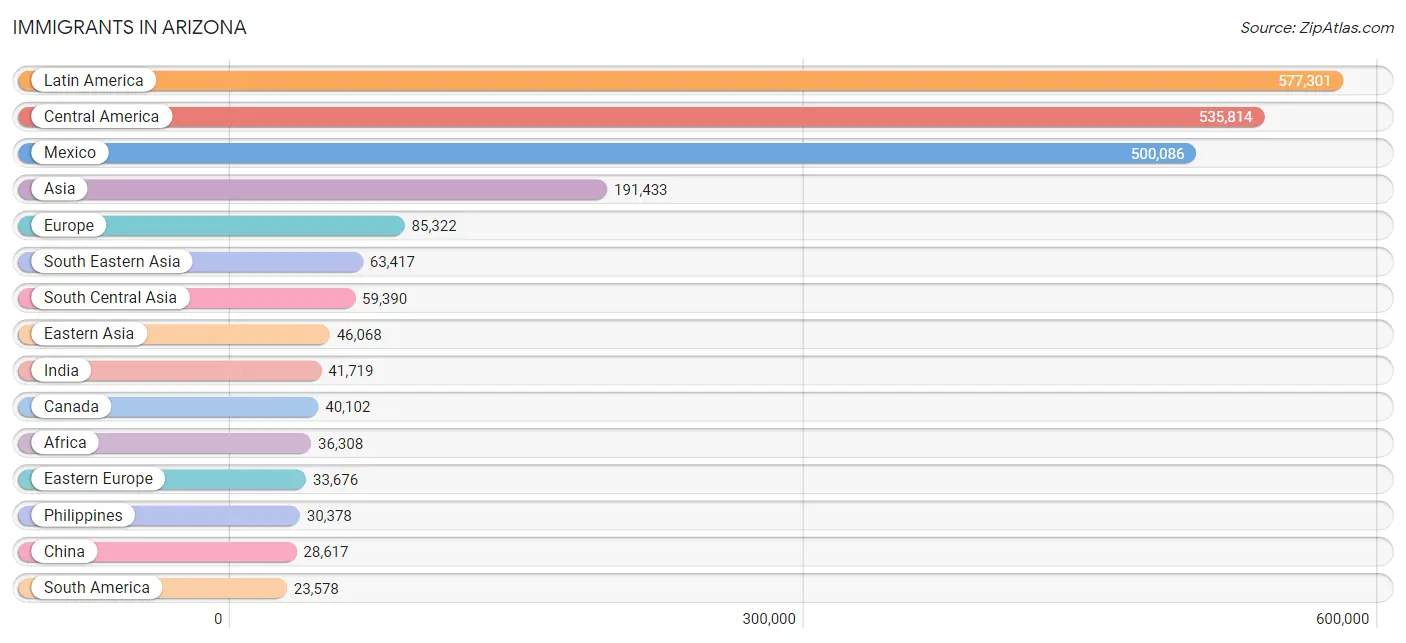
Immigrants in Arizona
The most numerous immigrant groups reported in Arizona came from Latin America (577,301 | 8.1%), Central America (535,814 | 7.5%), Mexico (500,086 | 7.0%), Asia (191,433 | 2.7%), and Europe (85,322 | 1.2%), together accounting for 26.4% of all Arizona residents.
| Immigration Origin | # Population | % Population |
| Afghanistan | 2,420 | 0.0% |
| Africa | 36,308 | 0.5% |
| Albania | 1,547 | 0.0% |
| Argentina | 2,126 | 0.0% |
| Armenia | 450 | 0.0% |
| Asia | 191,433 | 2.7% |
| Australia | 1,875 | 0.0% |
| Austria | 905 | 0.0% |
| Azores | 32 | 0.0% |
| Bahamas | 330 | 0.0% |
| Bangladesh | 2,425 | 0.0% |
| Barbados | 778 | 0.0% |
| Belarus | 537 | 0.0% |
| Belgium | 584 | 0.0% |
| Belize | 392 | 0.0% |
| Bolivia | 347 | 0.0% |
| Bosnia and Herzegovina | 3,584 | 0.1% |
| Brazil | 3,365 | 0.1% |
| Bulgaria | 1,633 | 0.0% |
| Cabo Verde | 24 | 0.0% |
| Cambodia | 1,716 | 0.0% |
| Cameroon | 677 | 0.0% |
| Canada | 40,102 | 0.6% |
| Caribbean | 17,909 | 0.3% |
| Central America | 535,814 | 7.5% |
| Chile | 1,622 | 0.0% |
| China | 28,617 | 0.4% |
| Colombia | 6,030 | 0.1% |
| Congo | 1,224 | 0.0% |
| Costa Rica | 1,454 | 0.0% |
| Croatia | 1,354 | 0.0% |
| Cuba | 8,899 | 0.1% |
| Czechoslovakia | 1,678 | 0.0% |
| Denmark | 590 | 0.0% |
| Dominica | 62 | 0.0% |
| Dominican Republic | 1,996 | 0.0% |
| Eastern Africa | 15,514 | 0.2% |
| Eastern Asia | 46,068 | 0.6% |
| Eastern Europe | 33,676 | 0.5% |
| Ecuador | 1,911 | 0.0% |
| Egypt | 1,917 | 0.0% |
| El Salvador | 10,932 | 0.2% |
| England | 9,889 | 0.1% |
| Eritrea | 1,326 | 0.0% |
| Ethiopia | 3,880 | 0.1% |
| Europe | 85,322 | 1.2% |
| Fiji | 516 | 0.0% |
| France | 3,628 | 0.1% |
| Germany | 14,058 | 0.2% |
| Ghana | 607 | 0.0% |
| Greece | 1,080 | 0.0% |
| Grenada | 40 | 0.0% |
| Guatemala | 14,556 | 0.2% |
| Guyana | 737 | 0.0% |
| Haiti | 1,684 | 0.0% |
| Honduras | 3,511 | 0.1% |
| Hong Kong | 2,381 | 0.0% |
| Hungary | 1,572 | 0.0% |
| India | 41,719 | 0.6% |
| Indonesia | 1,842 | 0.0% |
| Iran | 5,893 | 0.1% |
| Iraq | 9,335 | 0.1% |
| Ireland | 1,308 | 0.0% |
| Israel | 1,439 | 0.0% |
| Italy | 4,190 | 0.1% |
| Jamaica | 2,710 | 0.0% |
| Japan | 6,077 | 0.1% |
| Jordan | 1,319 | 0.0% |
| Kazakhstan | 433 | 0.0% |
| Kenya | 3,500 | 0.1% |
| Korea | 11,275 | 0.2% |
| Kuwait | 879 | 0.0% |
| Laos | 1,156 | 0.0% |
| Latin America | 577,301 | 8.1% |
| Latvia | 160 | 0.0% |
| Lebanon | 1,831 | 0.0% |
| Liberia | 1,015 | 0.0% |
| Lithuania | 454 | 0.0% |
| Malaysia | 1,382 | 0.0% |
| Mexico | 500,086 | 7.0% |
| Micronesia | 328 | 0.0% |
| Middle Africa | 3,657 | 0.1% |
| Moldova | 311 | 0.0% |
| Morocco | 951 | 0.0% |
| Nepal | 1,533 | 0.0% |
| Netherlands | 2,465 | 0.0% |
| Nicaragua | 3,526 | 0.1% |
| Nigeria | 3,330 | 0.1% |
| North Macedonia | 183 | 0.0% |
| Northern Africa | 4,848 | 0.1% |
| Northern Europe | 21,234 | 0.3% |
| Norway | 353 | 0.0% |
| Oceania | 5,326 | 0.1% |
| Pakistan | 2,699 | 0.0% |
| Panama | 1,301 | 0.0% |
| Peru | 4,316 | 0.1% |
| Philippines | 30,378 | 0.4% |
| Poland | 5,025 | 0.1% |
| Portugal | 484 | 0.0% |
| Romania | 5,792 | 0.1% |
| Russia | 3,763 | 0.1% |
| Saudi Arabia | 1,456 | 0.0% |
| Scotland | 1,279 | 0.0% |
| Senegal | 260 | 0.0% |
| Serbia | 1,336 | 0.0% |
| Sierra Leone | 503 | 0.0% |
| Singapore | 760 | 0.0% |
| Somalia | 1,711 | 0.0% |
| South Africa | 2,667 | 0.0% |
| South America | 23,578 | 0.3% |
| South Central Asia | 59,390 | 0.8% |
| South Eastern Asia | 63,417 | 0.9% |
| Southern Europe | 7,504 | 0.1% |
| Spain | 1,678 | 0.0% |
| Sri Lanka | 808 | 0.0% |
| Sudan | 1,468 | 0.0% |
| Sweden | 950 | 0.0% |
| Switzerland | 993 | 0.0% |
| Syria | 1,804 | 0.0% |
| Taiwan | 4,961 | 0.1% |
| Thailand | 4,338 | 0.1% |
| Trinidad and Tobago | 1,095 | 0.0% |
| Turkey | 1,702 | 0.0% |
| Uganda | 449 | 0.0% |
| Ukraine | 2,223 | 0.0% |
| Uruguay | 221 | 0.0% |
| Uzbekistan | 685 | 0.0% |
| Venezuela | 2,657 | 0.0% |
| Vietnam | 19,199 | 0.3% |
| West Indies | 104 | 0.0% |
| Western Africa | 6,823 | 0.1% |
| Western Asia | 21,587 | 0.3% |
| Western Europe | 22,750 | 0.3% |
| Yemen | 203 | 0.0% |
| Zaire | 1,580 | 0.0% |
| Zimbabwe | 400 | 0.0% | View All 136 Rows |
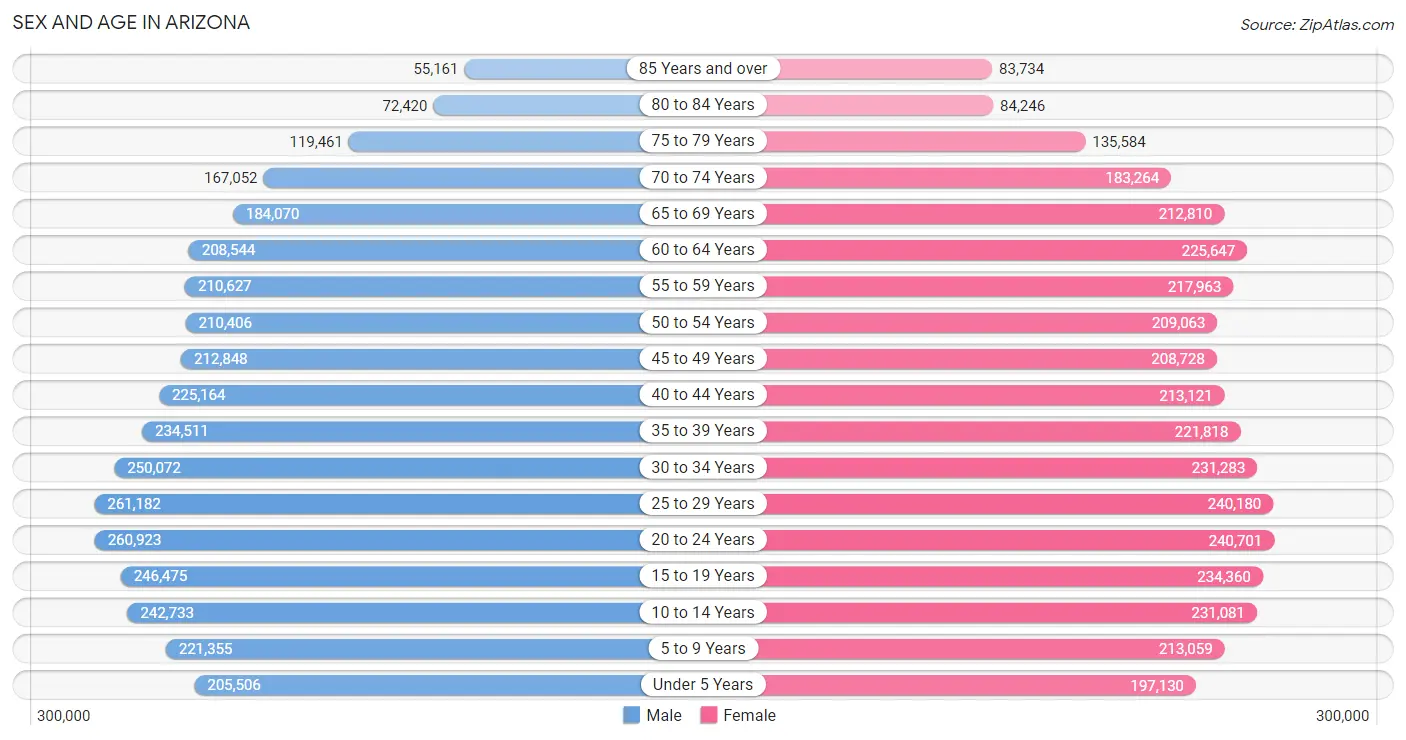
Sex and Age in Arizona
Sex and Age in Arizona
The most populous age groups in Arizona are 25 to 29 Years (261,182 | 7.3%) for men and 20 to 24 Years (240,701 | 6.7%) for women.
| Age Bracket | Male | Female |
| Under 5 Years | 205,506 (5.7%) | 197,130 (5.5%) |
| 5 to 9 Years | 221,355 (6.2%) | 213,059 (5.9%) |
| 10 to 14 Years | 242,733 (6.8%) | 231,081 (6.5%) |
| 15 to 19 Years | 246,475 (6.9%) | 234,360 (6.5%) |
| 20 to 24 Years | 260,923 (7.3%) | 240,701 (6.7%) |
| 25 to 29 Years | 261,182 (7.3%) | 240,180 (6.7%) |
| 30 to 34 Years | 250,072 (7.0%) | 231,283 (6.5%) |
| 35 to 39 Years | 234,511 (6.5%) | 221,818 (6.2%) |
| 40 to 44 Years | 225,164 (6.3%) | 213,121 (5.9%) |
| 45 to 49 Years | 212,848 (5.9%) | 208,728 (5.8%) |
| 50 to 54 Years | 210,406 (5.9%) | 209,063 (5.8%) |
| 55 to 59 Years | 210,627 (5.9%) | 217,963 (6.1%) |
| 60 to 64 Years | 208,544 (5.8%) | 225,647 (6.3%) |
| 65 to 69 Years | 184,070 (5.1%) | 212,810 (5.9%) |
| 70 to 74 Years | 167,052 (4.7%) | 183,264 (5.1%) |
| 75 to 79 Years | 119,461 (3.3%) | 135,584 (3.8%) |
| 80 to 84 Years | 72,420 (2.0%) | 84,246 (2.4%) |
| 85 Years and over | 55,161 (1.5%) | 83,734 (2.3%) |
| Total | 3,588,510 (100.0%) | 3,583,772 (100.0%) |
Families and Households in Arizona
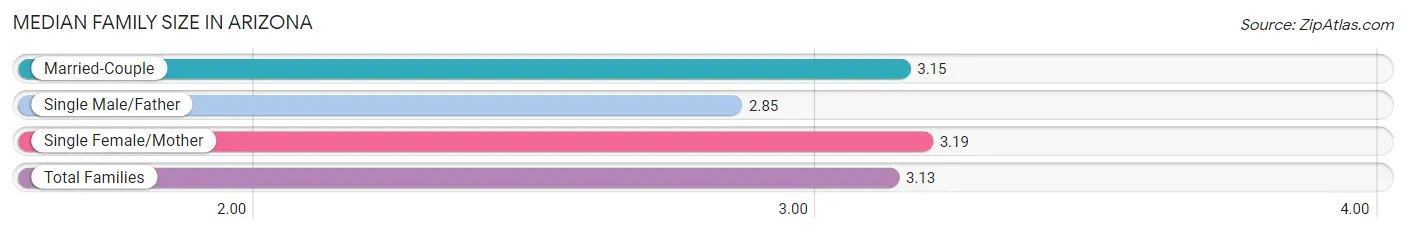
Median Family Size in Arizona
The median family size in Arizona is 3.13 persons per family, with single female/mother families (330,966 | 18.6%) accounting for the largest median family size of 3.19 persons per family. On the other hand, single male/father families (157,515 | 8.8%) represent the smallest median family size with 2.85 persons per family.
| Family Type | # Families | Family Size |
| Married-Couple | 1,291,812 (72.6%) | 3.15 |
| Single Male/Father | 157,515 (8.8%) | 2.85 |
| Single Female/Mother | 330,966 (18.6%) | 3.19 |
| Total Families | 1,780,293 (100.0%) | 3.13 |
Median Household Size in Arizona
The median household size in Arizona is 2.56 persons per household, with single female/mother households (330,966 | 12.1%) accounting for the largest median household size of 3.46 persons per household. non-family households (958,843 | 35.0%) represent the smallest median household size with 1.30 persons per household.

| Household Type | # Households | Household Size |
| Married-Couple | 1,291,812 (47.2%) | 3.18 |
| Single Male/Father | 157,515 (5.8%) | 3.27 |
| Single Female/Mother | 330,966 (12.1%) | 3.46 |
| Non-family | 958,843 (35.0%) | 1.30 |
| Total Households | 2,739,136 (100.0%) | 2.56 |
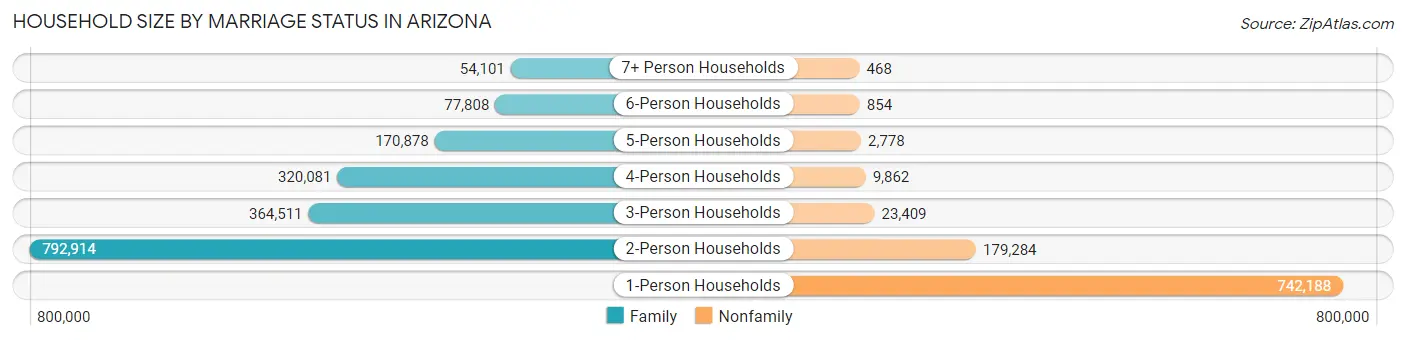
Household Size by Marriage Status in Arizona
Out of a total of 2,739,136 households in Arizona, 1,780,293 (65.0%) are family households, while 958,843 (35.0%) are nonfamily households. The most numerous type of family households are 2-person households, comprising 792,914, and the most common type of nonfamily households are 1-person households, comprising 742,188.
| Household Size | Family Households | Nonfamily Households |
| 1-Person Households | - | 742,188 (27.1%) |
| 2-Person Households | 792,914 (28.9%) | 179,284 (6.6%) |
| 3-Person Households | 364,511 (13.3%) | 23,409 (0.9%) |
| 4-Person Households | 320,081 (11.7%) | 9,862 (0.4%) |
| 5-Person Households | 170,878 (6.2%) | 2,778 (0.1%) |
| 6-Person Households | 77,808 (2.8%) | 854 (0.0%) |
| 7+ Person Households | 54,101 (2.0%) | 468 (0.0%) |
| Total | 1,780,293 (65.0%) | 958,843 (35.0%) |
Female Fertility in Arizona
Fertility by Age in Arizona
Average fertility rate in Arizona is 55.0 births per 1,000 women. Women in the age bracket of 20 to 34 years have the highest fertility rate with 89.0 births per 1,000 women. Women in the age bracket of 20 to 34 years acount for 70.8% of all women with births.
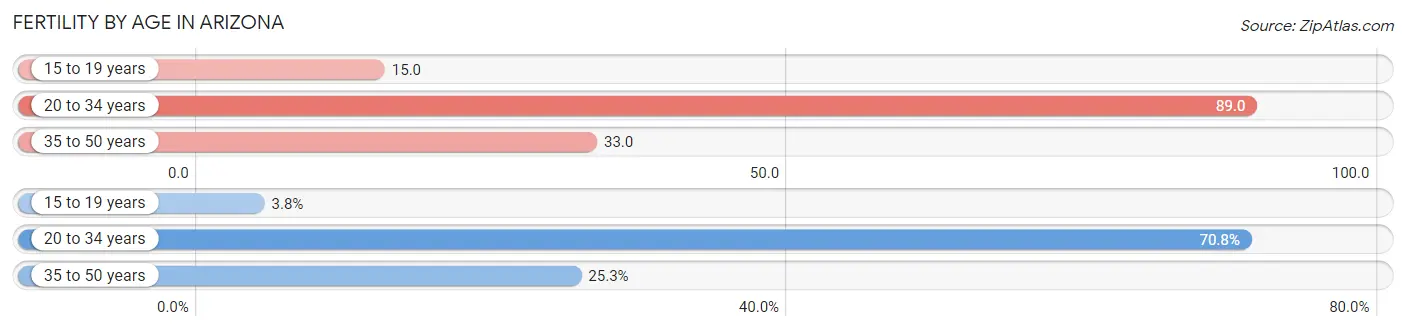
| Age Bracket | Women with Births | Births / 1,000 Women |
| 15 to 19 years | 3,421 (3.8%) | 15.0 |
| 20 to 34 years | 63,161 (70.8%) | 89.0 |
| 35 to 50 years | 22,604 (25.3%) | 33.0 |
| Total | 89,186 (100.0%) | 55.0 |
Fertility by Age by Marriage Status in Arizona
63.6% of women with births (89,186) in Arizona are married. The highest percentage of unmarried women with births falls into 15 to 19 years age bracket with 93.5% of them unmarried at the time of birth, while the lowest percentage of unmarried women with births belong to 35 to 50 years age bracket with 23.9% of them unmarried.
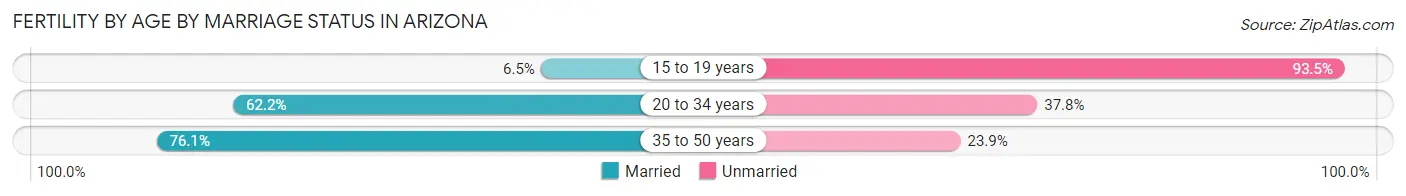
| Age Bracket | Married | Unmarried |
| 15 to 19 years | 222 (6.5%) | 3,199 (93.5%) |
| 20 to 34 years | 39,286 (62.2%) | 23,875 (37.8%) |
| 35 to 50 years | 17,202 (76.1%) | 5,402 (23.9%) |
| Total | 56,722 (63.6%) | 32,464 (36.4%) |
Fertility by Education in Arizona
Average fertility rate in Arizona is 55.0 births per 1,000 women. Women with the education attainment of high school diploma have the highest fertility rate of 64.0 births per 1,000 women, while women with the education attainment of less than high school have the lowest fertility at 39.0 births per 1,000 women. Women with the education attainment of college or associate's degree represent 33.0% of all women with births.
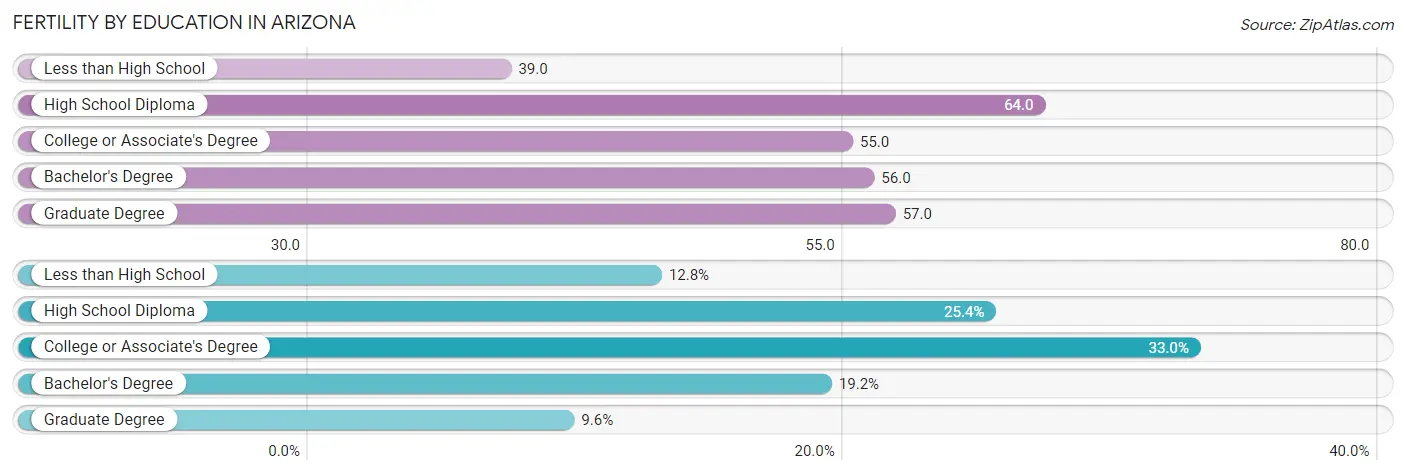
| Educational Attainment | Women with Births | Births / 1,000 Women |
| Less than High School | 11,453 (12.8%) | 39.0 |
| High School Diploma | 22,618 (25.4%) | 64.0 |
| College or Associate's Degree | 29,452 (33.0%) | 55.0 |
| Bachelor's Degree | 17,134 (19.2%) | 56.0 |
| Graduate Degree | 8,529 (9.6%) | 57.0 |
| Total | 89,186 (100.0%) | 55.0 |
Fertility by Education by Marriage Status in Arizona
36.4% of women with births in Arizona are unmarried. Women with the educational attainment of graduate degree are most likely to be married with 91.7% of them married at childbirth, while women with the educational attainment of less than high school are least likely to be married with 54.8% of them unmarried at childbirth.
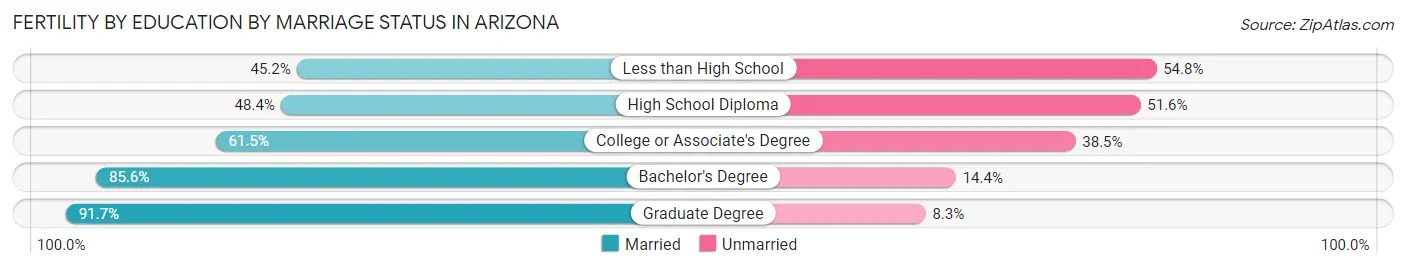
| Educational Attainment | Married | Unmarried |
| Less than High School | 5,177 (45.2%) | 6,276 (54.8%) |
| High School Diploma | 10,947 (48.4%) | 11,671 (51.6%) |
| College or Associate's Degree | 18,113 (61.5%) | 11,339 (38.5%) |
| Bachelor's Degree | 14,667 (85.6%) | 2,467 (14.4%) |
| Graduate Degree | 7,821 (91.7%) | 708 (8.3%) |
| Total | 56,722 (63.6%) | 32,464 (36.4%) |
Employment Characteristics in Arizona
Employment by Class of Employer in Arizona
Among the 3,244,419 employed individuals in Arizona, private company employees (2,223,419 | 68.5%), not-for-profit organizations (227,382 | 7.0%), and local government employees (218,216 | 6.7%) make up the most common classes of employment.
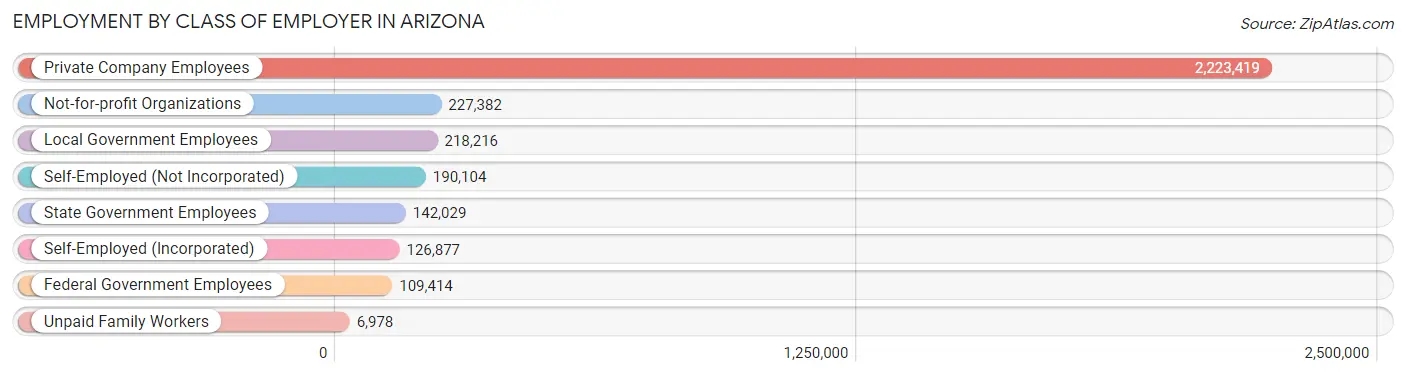
| Employer Class | # Employees | % Employees |
| Private Company Employees | 2,223,419 | 68.5% |
| Self-Employed (Incorporated) | 126,877 | 3.9% |
| Self-Employed (Not Incorporated) | 190,104 | 5.9% |
| Not-for-profit Organizations | 227,382 | 7.0% |
| Local Government Employees | 218,216 | 6.7% |
| State Government Employees | 142,029 | 4.4% |
| Federal Government Employees | 109,414 | 3.4% |
| Unpaid Family Workers | 6,978 | 0.2% |
| Total | 3,244,419 | 100.0% |
Employment Status by Age in Arizona
According to the labor force statistics for Arizona, out of the total population over 16 years of age (5,764,417), 60.5% or 3,487,472 individuals are in the labor force, with 5.4% or 188,323 of them unemployed. The age group with the highest labor force participation rate is 25 to 29 years, with 82.7% or 414,626 individuals in the labor force. Within the labor force, the 16 to 19 years age range has the highest percentage of unemployed individuals, with 16.5% or 25,143 of them being unemployed.
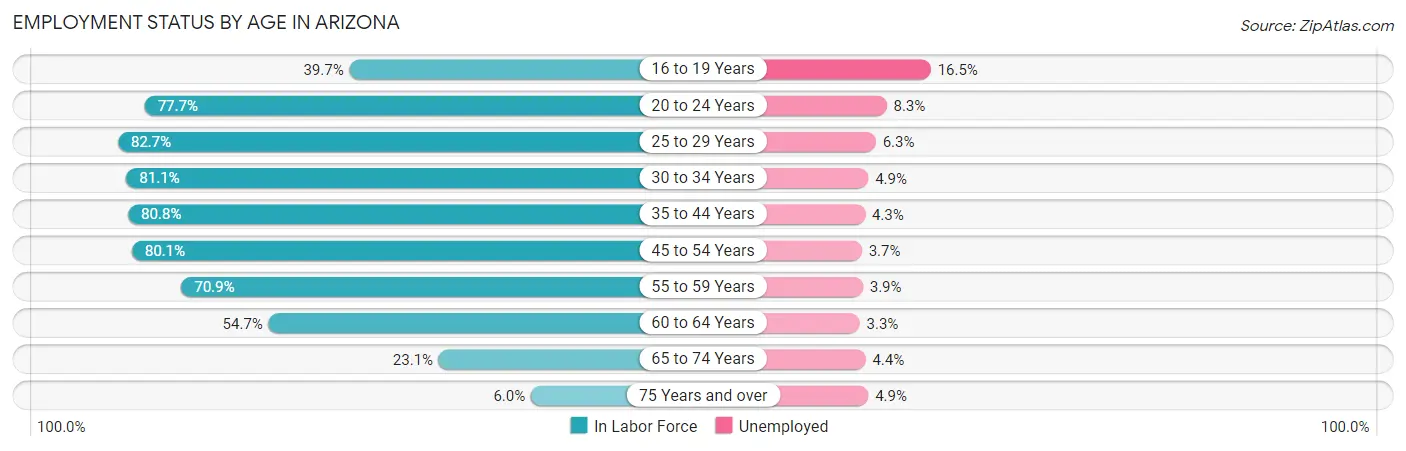
| Age Bracket | In Labor Force | Unemployed |
| 16 to 19 Years | 152,382 (39.7%) | 25,143 (16.5%) |
| 20 to 24 Years | 389,762 (77.7%) | 32,350 (8.3%) |
| 25 to 29 Years | 414,626 (82.7%) | 26,121 (6.3%) |
| 30 to 34 Years | 390,379 (81.1%) | 19,129 (4.9%) |
| 35 to 44 Years | 722,848 (80.8%) | 31,082 (4.3%) |
| 45 to 54 Years | 673,677 (80.1%) | 24,926 (3.7%) |
| 55 to 59 Years | 303,870 (70.9%) | 11,851 (3.9%) |
| 60 to 64 Years | 237,502 (54.7%) | 7,838 (3.3%) |
| 65 to 74 Years | 172,602 (23.1%) | 7,594 (4.4%) |
| 75 Years and over | 33,036 (6.0%) | 1,619 (4.9%) |
| Total | 3,487,472 (60.5%) | 188,323 (5.4%) |
Employment Status by Educational Attainment in Arizona
According to labor force statistics for Arizona, 76.6% of individuals (2,743,166) out of the total population between 25 and 64 years of age (3,581,157) are in the labor force, with 4.4% or 120,699 of them being unemployed. The group with the highest labor force participation rate are those with the educational attainment of bachelor's degree or higher, with 84.9% or 967,847 individuals in the labor force. Within the labor force, individuals with less than high school education have the highest percentage of unemployment, with 7.2% or 18,139 of them being unemployed.
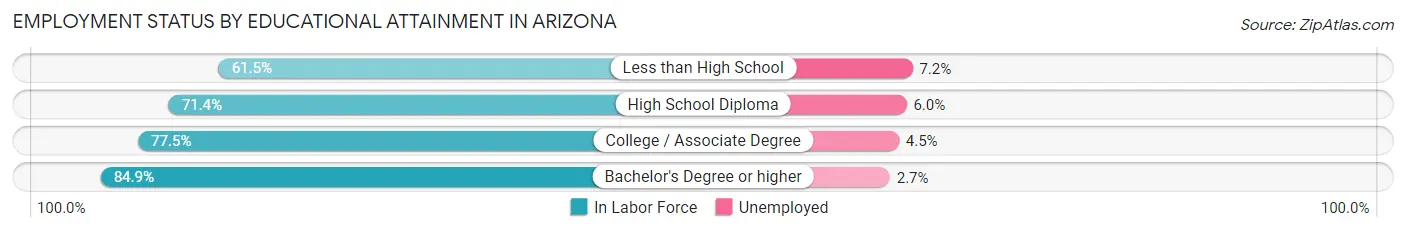
| Educational Attainment | In Labor Force | Unemployed |
| Less than High School | 251,924 (61.5%) | 29,494 (7.2%) |
| High School Diploma | 598,318 (71.4%) | 50,279 (6.0%) |
| College / Associate Degree | 925,009 (77.5%) | 53,710 (4.5%) |
| Bachelor's Degree or higher | 967,847 (84.9%) | 30,780 (2.7%) |
| Total | 2,743,166 (76.6%) | 157,571 (4.4%) |
Employment Occupations by Sex in Arizona
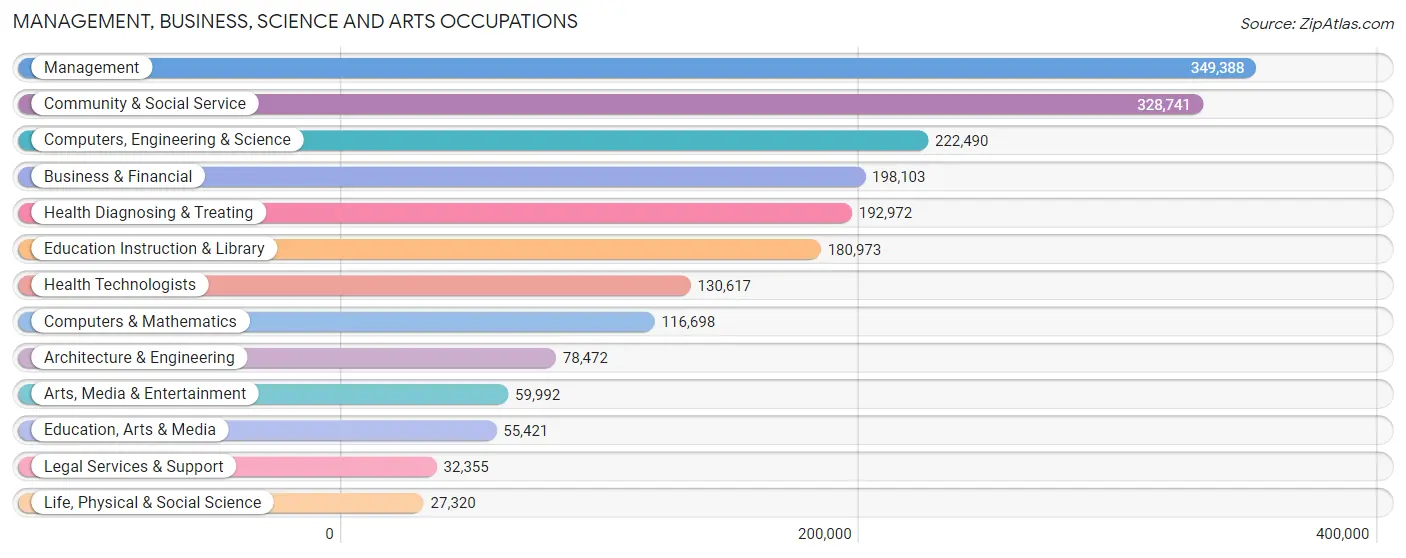
Management, Business, Science and Arts Occupations
The most common Management, Business, Science and Arts occupations in Arizona are Management (349,388 | 10.6%), Community & Social Service (328,741 | 10.0%), Computers, Engineering & Science (222,490 | 6.8%), Business & Financial (198,103 | 6.0%), and Health Diagnosing & Treating (192,972 | 5.9%).
Management, Business, Science and Arts Occupations by Sex
Within the Management, Business, Science and Arts occupations in Arizona, the most male-oriented occupations are Architecture & Engineering (85.7%), Computers, Engineering & Science (76.1%), and Computers & Mathematics (74.9%), while the most female-oriented occupations are Education Instruction & Library (71.3%), Health Technologists (71.0%), and Health Diagnosing & Treating (70.3%).
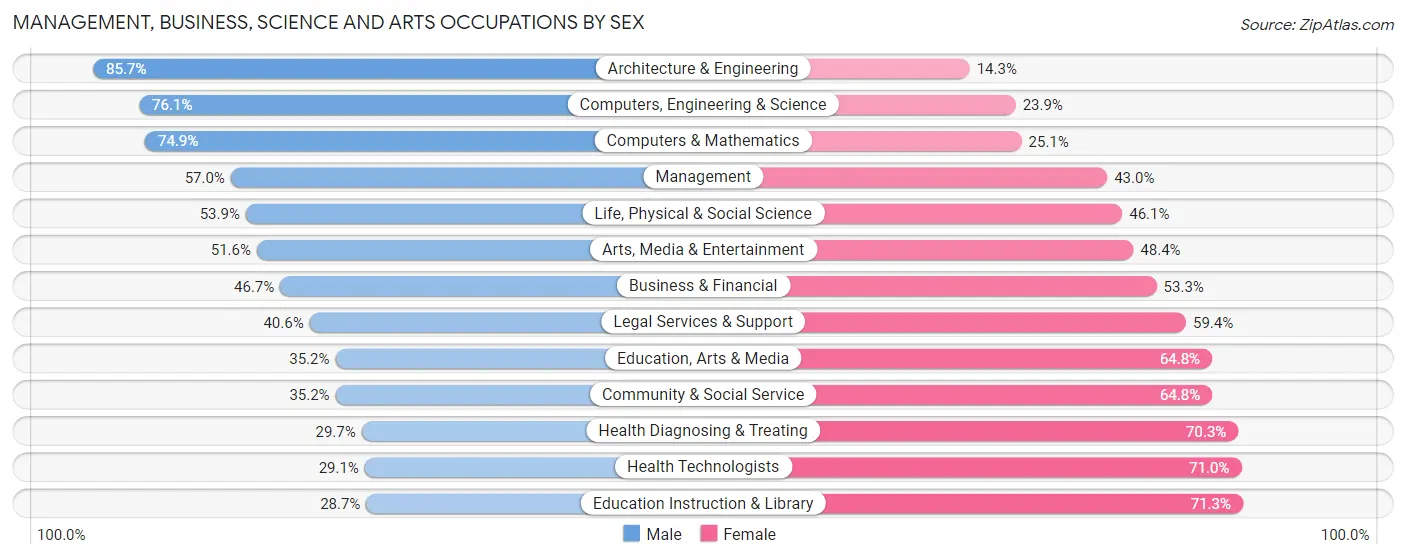
| Occupation | Male | Female |
| Management | 199,188 (57.0%) | 150,200 (43.0%) |
| Business & Financial | 92,513 (46.7%) | 105,590 (53.3%) |
| Computers, Engineering & Science | 169,334 (76.1%) | 53,156 (23.9%) |
| Computers & Mathematics | 87,369 (74.9%) | 29,329 (25.1%) |
| Architecture & Engineering | 67,248 (85.7%) | 11,224 (14.3%) |
| Life, Physical & Social Science | 14,717 (53.9%) | 12,603 (46.1%) |
| Community & Social Service | 115,573 (35.2%) | 213,168 (64.8%) |
| Education, Arts & Media | 19,498 (35.2%) | 35,923 (64.8%) |
| Legal Services & Support | 13,126 (40.6%) | 19,229 (59.4%) |
| Education Instruction & Library | 52,017 (28.7%) | 128,956 (71.3%) |
| Arts, Media & Entertainment | 30,932 (51.6%) | 29,060 (48.4%) |
| Health Diagnosing & Treating | 57,335 (29.7%) | 135,637 (70.3%) |
| Health Technologists | 37,944 (29.0%) | 92,673 (71.0%) |
| Total (Category) | 633,943 (49.1%) | 657,751 (50.9%) |
| Total (Overall) | 1,765,868 (53.8%) | 1,515,321 (46.2%) |
Services Occupations
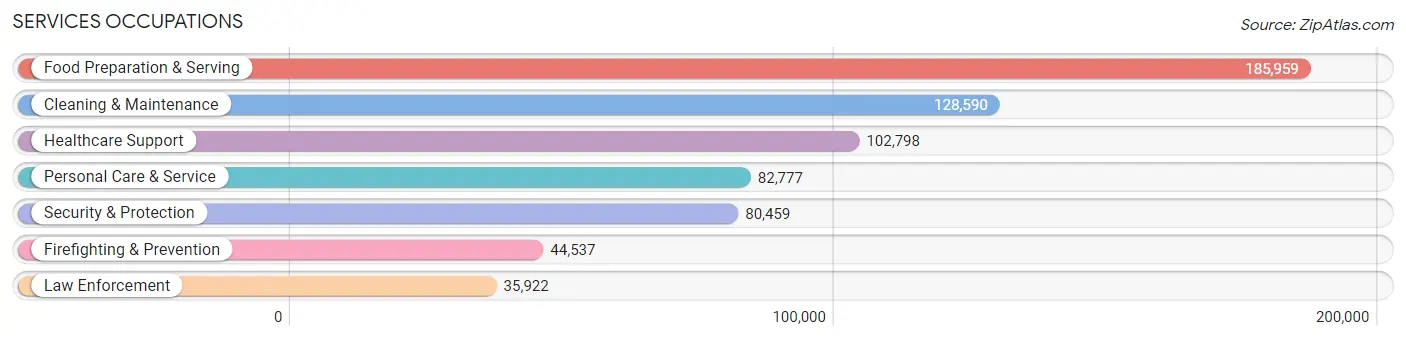
The most common Services occupations in Arizona are Food Preparation & Serving (185,959 | 5.7%), Cleaning & Maintenance (128,590 | 3.9%), Healthcare Support (102,798 | 3.1%), Personal Care & Service (82,777 | 2.5%), and Security & Protection (80,459 | 2.5%).
Services Occupations by Sex
Within the Services occupations in Arizona, the most male-oriented occupations are Law Enforcement (83.2%), Security & Protection (79.2%), and Firefighting & Prevention (76.0%), while the most female-oriented occupations are Healthcare Support (80.7%), Personal Care & Service (74.4%), and Food Preparation & Serving (51.8%).
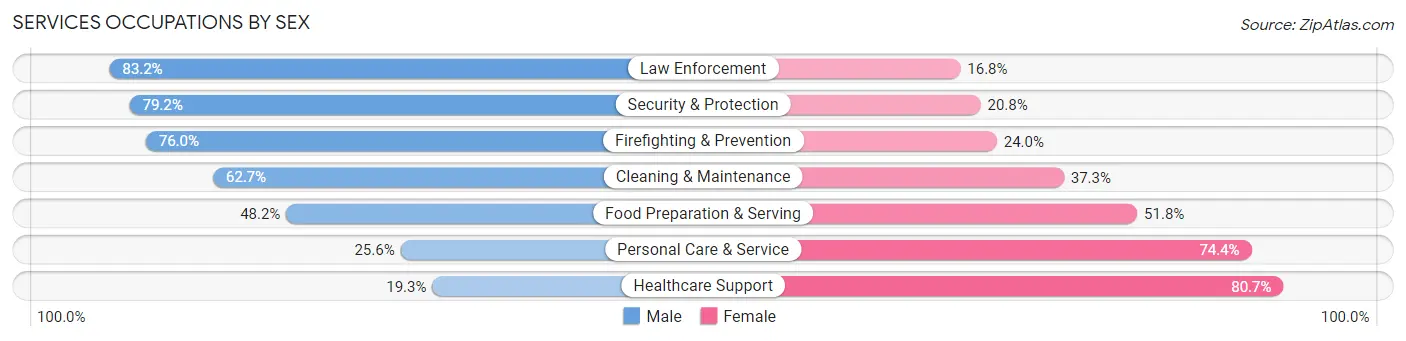
| Occupation | Male | Female |
| Healthcare Support | 19,814 (19.3%) | 82,984 (80.7%) |
| Security & Protection | 63,731 (79.2%) | 16,728 (20.8%) |
| Firefighting & Prevention | 33,843 (76.0%) | 10,694 (24.0%) |
| Law Enforcement | 29,888 (83.2%) | 6,034 (16.8%) |
| Food Preparation & Serving | 89,627 (48.2%) | 96,332 (51.8%) |
| Cleaning & Maintenance | 80,650 (62.7%) | 47,940 (37.3%) |
| Personal Care & Service | 21,163 (25.6%) | 61,614 (74.4%) |
| Total (Category) | 274,985 (47.4%) | 305,598 (52.6%) |
| Total (Overall) | 1,765,868 (53.8%) | 1,515,321 (46.2%) |
Sales and Office Occupations
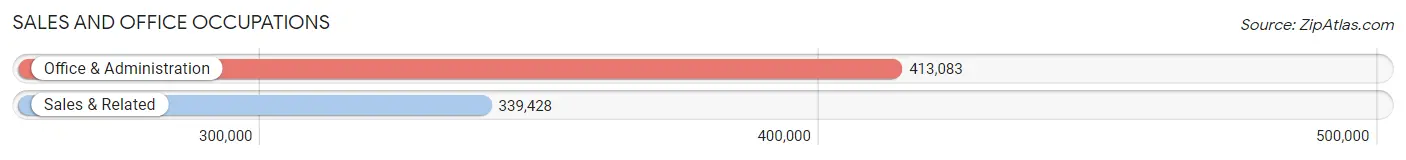
The most common Sales and Office occupations in Arizona are Office & Administration (413,083 | 12.6%), and Sales & Related (339,428 | 10.3%).
Sales and Office Occupations by Sex
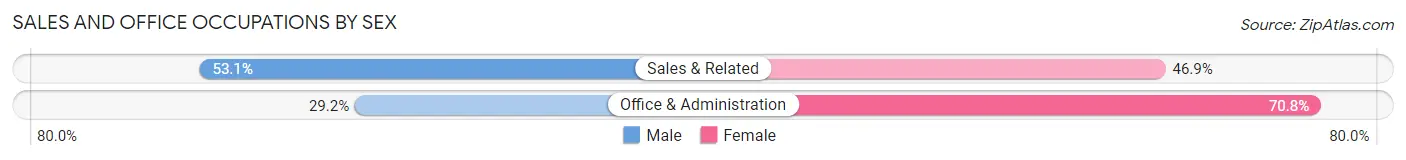
| Occupation | Male | Female |
| Sales & Related | 180,179 (53.1%) | 159,249 (46.9%) |
| Office & Administration | 120,515 (29.2%) | 292,568 (70.8%) |
| Total (Category) | 300,694 (40.0%) | 451,817 (60.0%) |
| Total (Overall) | 1,765,868 (53.8%) | 1,515,321 (46.2%) |
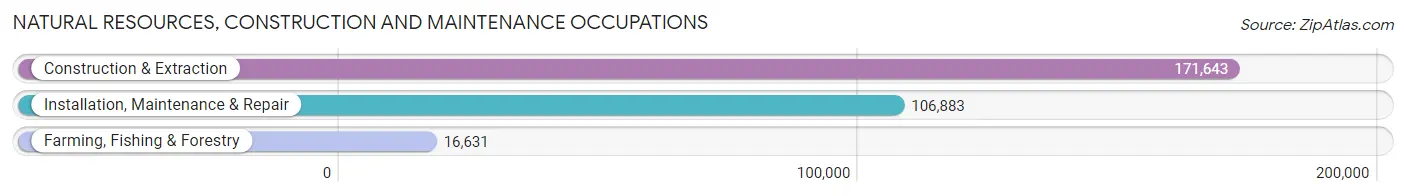
Natural Resources, Construction and Maintenance Occupations
The most common Natural Resources, Construction and Maintenance occupations in Arizona are Construction & Extraction (171,643 | 5.2%), Installation, Maintenance & Repair (106,883 | 3.3%), and Farming, Fishing & Forestry (16,631 | 0.5%).
Natural Resources, Construction and Maintenance Occupations by Sex
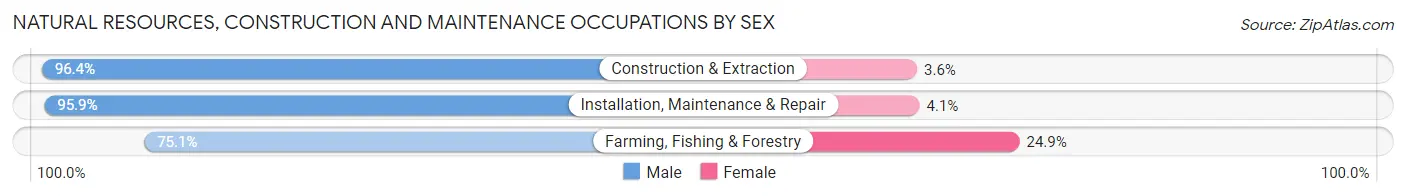
| Occupation | Male | Female |
| Farming, Fishing & Forestry | 12,492 (75.1%) | 4,139 (24.9%) |
| Construction & Extraction | 165,506 (96.4%) | 6,137 (3.6%) |
| Installation, Maintenance & Repair | 102,497 (95.9%) | 4,386 (4.1%) |
| Total (Category) | 280,495 (95.0%) | 14,662 (5.0%) |
| Total (Overall) | 1,765,868 (53.8%) | 1,515,321 (46.2%) |
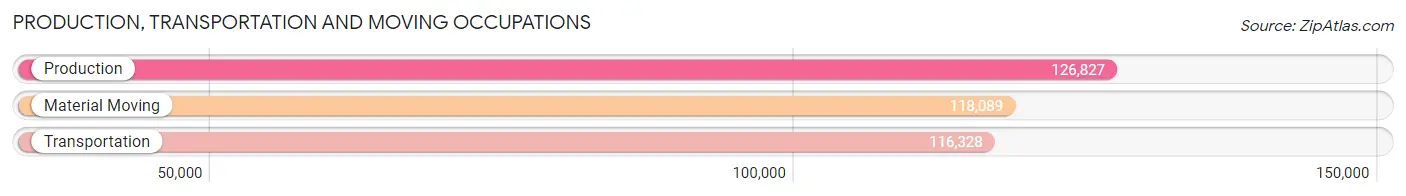
Production, Transportation and Moving Occupations
The most common Production, Transportation and Moving occupations in Arizona are Production (126,827 | 3.9%), Material Moving (118,089 | 3.6%), and Transportation (116,328 | 3.5%).
Production, Transportation and Moving Occupations by Sex
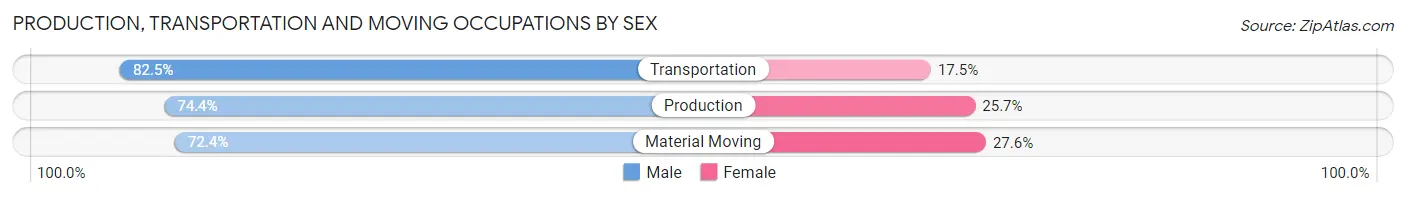
| Occupation | Male | Female |
| Production | 94,291 (74.4%) | 32,536 (25.7%) |
| Transportation | 95,960 (82.5%) | 20,368 (17.5%) |
| Material Moving | 85,500 (72.4%) | 32,589 (27.6%) |
| Total (Category) | 275,751 (76.3%) | 85,493 (23.7%) |
| Total (Overall) | 1,765,868 (53.8%) | 1,515,321 (46.2%) |
Employment Industries by Sex in Arizona
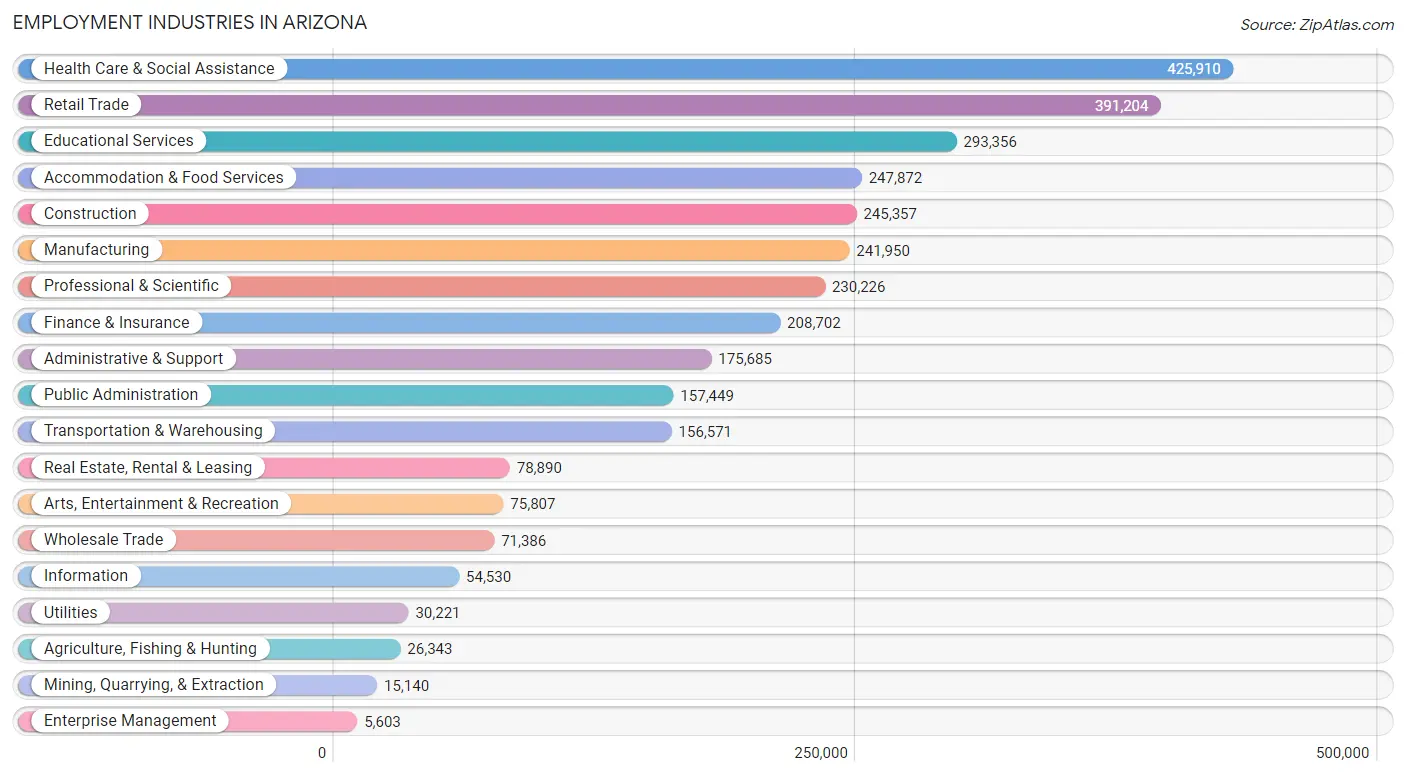
Employment Industries in Arizona
The major employment industries in Arizona include Health Care & Social Assistance (425,910 | 13.0%), Retail Trade (391,204 | 11.9%), Educational Services (293,356 | 8.9%), Accommodation & Food Services (247,872 | 7.5%), and Construction (245,357 | 7.5%).
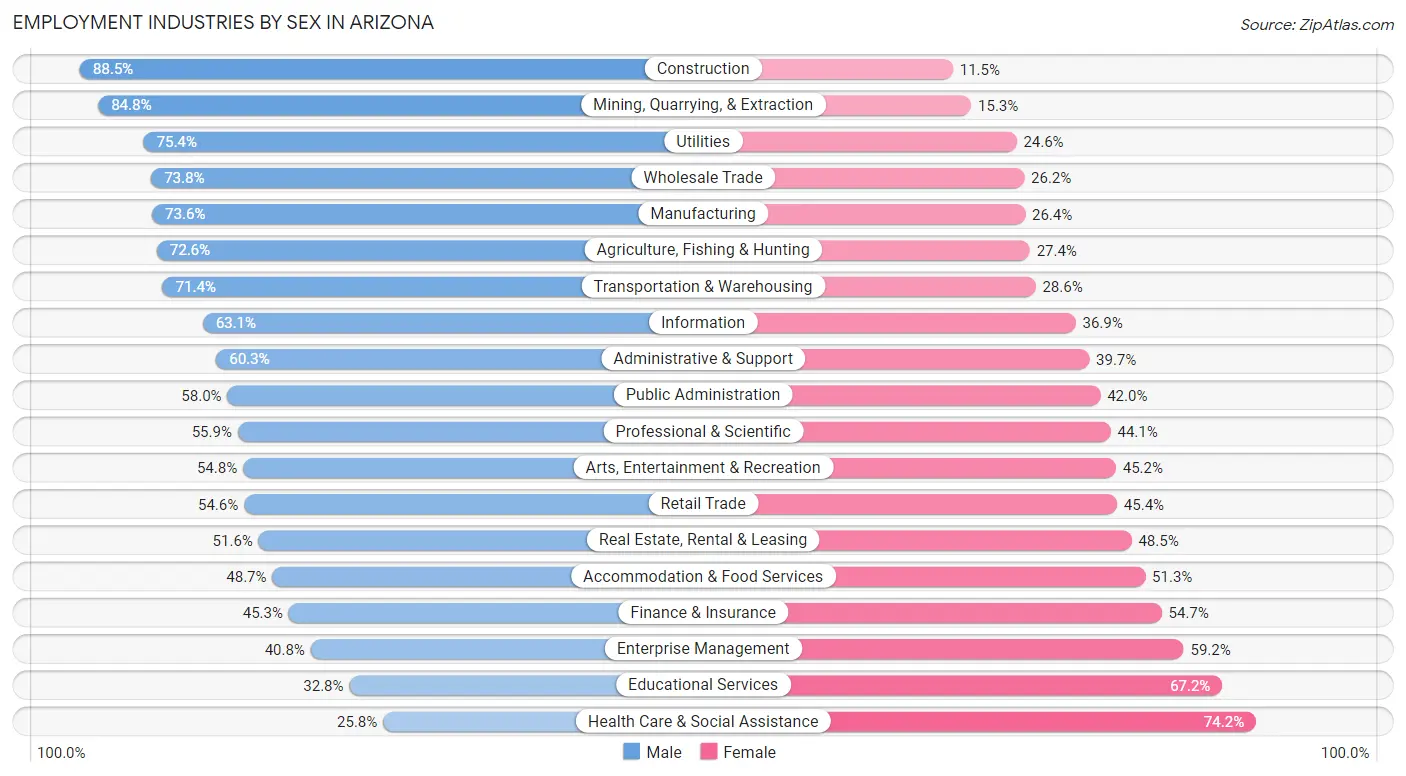
Employment Industries by Sex in Arizona
The Arizona industries that see more men than women are Construction (88.5%), Mining, Quarrying, & Extraction (84.8%), and Utilities (75.4%), whereas the industries that tend to have a higher number of women are Health Care & Social Assistance (74.2%), Educational Services (67.2%), and Enterprise Management (59.2%).
| Industry | Male | Female |
| Agriculture, Fishing & Hunting | 19,130 (72.6%) | 7,213 (27.4%) |
| Mining, Quarrying, & Extraction | 12,831 (84.8%) | 2,309 (15.2%) |
| Construction | 217,232 (88.5%) | 28,125 (11.5%) |
| Manufacturing | 178,062 (73.6%) | 63,888 (26.4%) |
| Wholesale Trade | 52,669 (73.8%) | 18,717 (26.2%) |
| Retail Trade | 213,476 (54.6%) | 177,728 (45.4%) |
| Transportation & Warehousing | 111,826 (71.4%) | 44,745 (28.6%) |
| Utilities | 22,776 (75.4%) | 7,445 (24.6%) |
| Information | 34,423 (63.1%) | 20,107 (36.9%) |
| Finance & Insurance | 94,585 (45.3%) | 114,117 (54.7%) |
| Real Estate, Rental & Leasing | 40,671 (51.5%) | 38,219 (48.4%) |
| Professional & Scientific | 128,663 (55.9%) | 101,563 (44.1%) |
| Enterprise Management | 2,285 (40.8%) | 3,318 (59.2%) |
| Administrative & Support | 105,981 (60.3%) | 69,704 (39.7%) |
| Educational Services | 96,152 (32.8%) | 197,204 (67.2%) |
| Health Care & Social Assistance | 109,840 (25.8%) | 316,070 (74.2%) |
| Arts, Entertainment & Recreation | 41,540 (54.8%) | 34,267 (45.2%) |
| Accommodation & Food Services | 120,754 (48.7%) | 127,118 (51.3%) |
| Public Administration | 91,354 (58.0%) | 66,095 (42.0%) |
| Total | 1,765,868 (53.8%) | 1,515,321 (46.2%) |
Education in Arizona
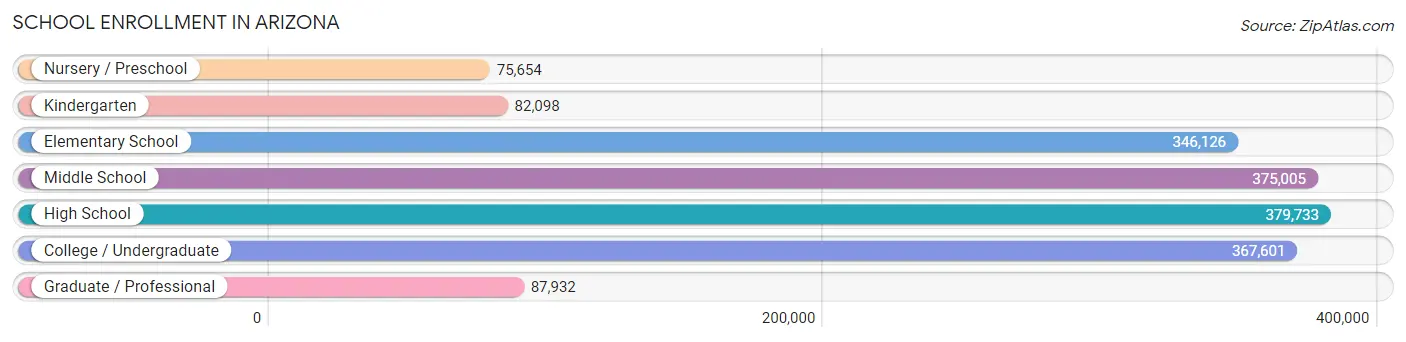
School Enrollment in Arizona
The most common levels of schooling among the 1,714,149 students in Arizona are high school (379,733 | 22.2%), middle school (375,005 | 21.9%), and college / undergraduate (367,601 | 21.4%).
| School Level | # Students | % Students |
| Nursery / Preschool | 75,654 | 4.4% |
| Kindergarten | 82,098 | 4.8% |
| Elementary School | 346,126 | 20.2% |
| Middle School | 375,005 | 21.9% |
| High School | 379,733 | 22.2% |
| College / Undergraduate | 367,601 | 21.4% |
| Graduate / Professional | 87,932 | 5.1% |
| Total | 1,714,149 | 100.0% |
School Enrollment by Age by Funding Source in Arizona
Out of a total of 1,714,149 students who are enrolled in schools in Arizona, 224,554 (13.1%) attend a private institution, while the remaining 1,489,595 (86.9%) are enrolled in public schools. The age group of 3 to 4 year olds has the highest likelihood of being enrolled in private schools, with 20,979 (34.8% in the age bracket) enrolled. Conversely, the age group of 15 to 17 year olds has the lowest likelihood of being enrolled in a private school, with 249,691 (92.4% in the age bracket) attending a public institution.
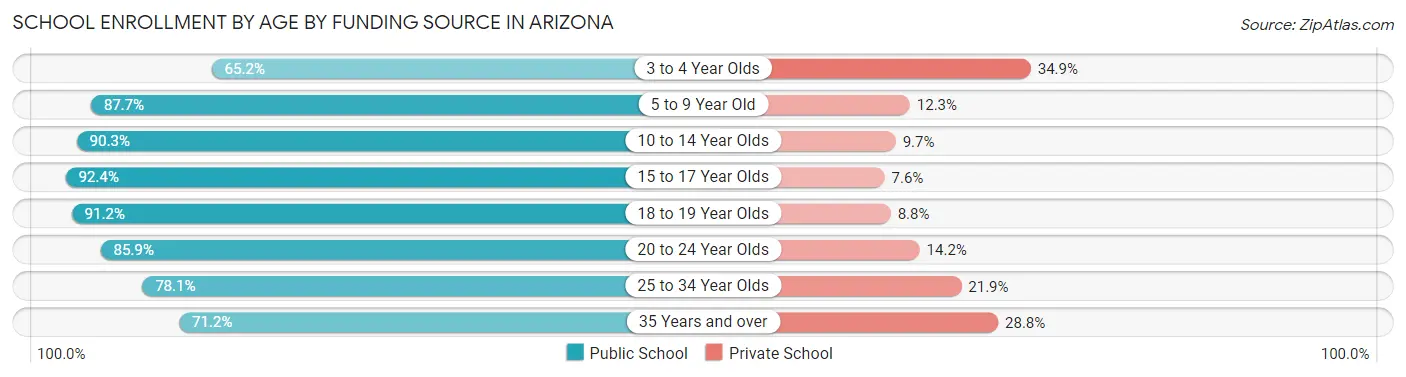
| Age Bracket | Public School | Private School |
| 3 to 4 Year Olds | 39,211 (65.1%) | 20,979 (34.8%) |
| 5 to 9 Year Old | 352,796 (87.7%) | 49,632 (12.3%) |
| 10 to 14 Year Olds | 417,214 (90.3%) | 44,768 (9.7%) |
| 15 to 17 Year Olds | 249,691 (92.4%) | 20,594 (7.6%) |
| 18 to 19 Year Olds | 123,346 (91.2%) | 11,848 (8.8%) |
| 20 to 24 Year Olds | 151,914 (85.9%) | 25,044 (14.1%) |
| 25 to 34 Year Olds | 86,562 (78.1%) | 24,301 (21.9%) |
| 35 Years and over | 68,555 (71.2%) | 27,694 (28.8%) |
| Total | 1,489,595 (86.9%) | 224,554 (13.1%) |
Educational Attainment by Field of Study in Arizona
Business (344,130 | 20.6%), education (209,806 | 12.6%), science & technology (169,917 | 10.2%), engineering (133,035 | 8.0%), and social sciences (118,197 | 7.1%) are the most common fields of study among 1,667,986 individuals in Arizona who have obtained a bachelor's degree or higher.
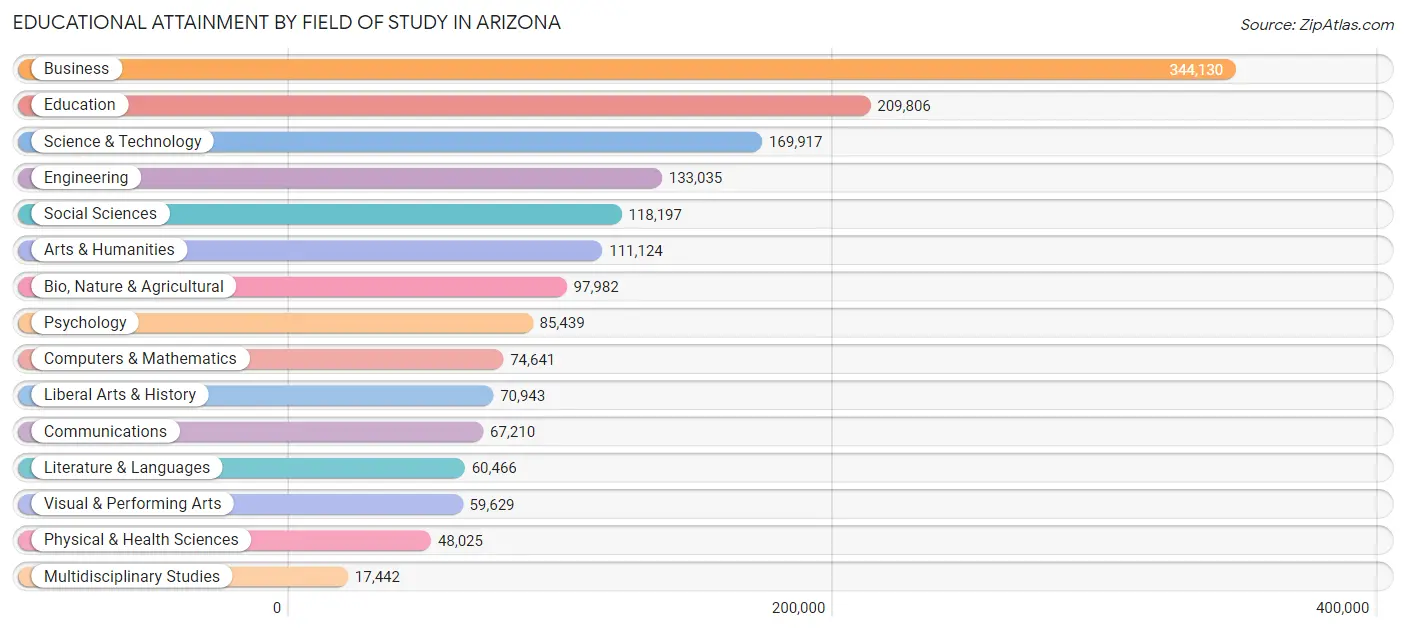
| Field of Study | # Graduates | % Graduates |
| Computers & Mathematics | 74,641 | 4.5% |
| Bio, Nature & Agricultural | 97,982 | 5.9% |
| Physical & Health Sciences | 48,025 | 2.9% |
| Psychology | 85,439 | 5.1% |
| Social Sciences | 118,197 | 7.1% |
| Engineering | 133,035 | 8.0% |
| Multidisciplinary Studies | 17,442 | 1.1% |
| Science & Technology | 169,917 | 10.2% |
| Business | 344,130 | 20.6% |
| Education | 209,806 | 12.6% |
| Literature & Languages | 60,466 | 3.6% |
| Liberal Arts & History | 70,943 | 4.3% |
| Visual & Performing Arts | 59,629 | 3.6% |
| Communications | 67,210 | 4.0% |
| Arts & Humanities | 111,124 | 6.7% |
| Total | 1,667,986 | 100.0% |
Transportation & Commute in Arizona
Vehicle Availability by Sex in Arizona
The most prevalent vehicle ownership categories in Arizona are males with 2 vehicles (729,956, accounting for 41.8%) and females with 2 vehicles (599,368, making up 49.4%).
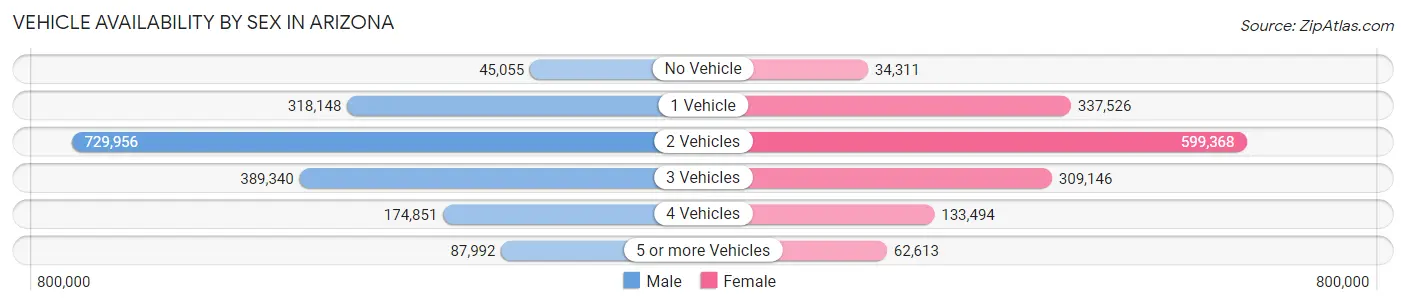
| Vehicles Available | Male | Female |
| No Vehicle | 45,055 (2.6%) | 34,311 (2.3%) |
| 1 Vehicle | 318,148 (18.2%) | 337,526 (22.9%) |
| 2 Vehicles | 729,956 (41.8%) | 599,368 (40.6%) |
| 3 Vehicles | 389,340 (22.3%) | 309,146 (20.9%) |
| 4 Vehicles | 174,851 (10.0%) | 133,494 (9.0%) |
| 5 or more Vehicles | 87,992 (5.0%) | 62,613 (4.2%) |
| Total | 1,745,342 (100.0%) | 1,476,458 (100.0%) |
Commute Time in Arizona
The most frequently occuring commute durations in Arizona are 20 to 24 minutes (430,417 commuters, 15.5%), 15 to 19 minutes (427,293 commuters, 15.4%), and 30 to 34 minutes (404,753 commuters, 14.5%).
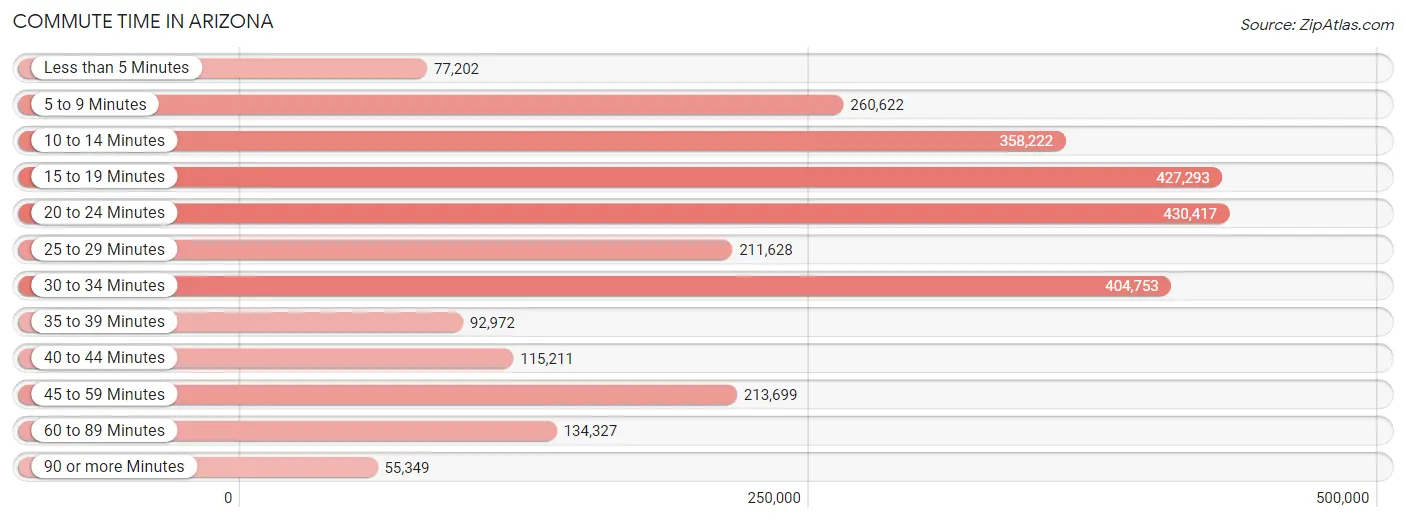
| Commute Time | # Commuters | % Commuters |
| Less than 5 Minutes | 77,202 | 2.8% |
| 5 to 9 Minutes | 260,622 | 9.4% |
| 10 to 14 Minutes | 358,222 | 12.9% |
| 15 to 19 Minutes | 427,293 | 15.4% |
| 20 to 24 Minutes | 430,417 | 15.5% |
| 25 to 29 Minutes | 211,628 | 7.6% |
| 30 to 34 Minutes | 404,753 | 14.5% |
| 35 to 39 Minutes | 92,972 | 3.3% |
| 40 to 44 Minutes | 115,211 | 4.1% |
| 45 to 59 Minutes | 213,699 | 7.7% |
| 60 to 89 Minutes | 134,327 | 4.8% |
| 90 or more Minutes | 55,349 | 2.0% |
Commute Time by Sex in Arizona
The most common commute times in Arizona are 20 to 24 minutes (236,597 commuters, 15.4%) for males and 15 to 19 minutes (199,168 commuters, 16.0%) for females.
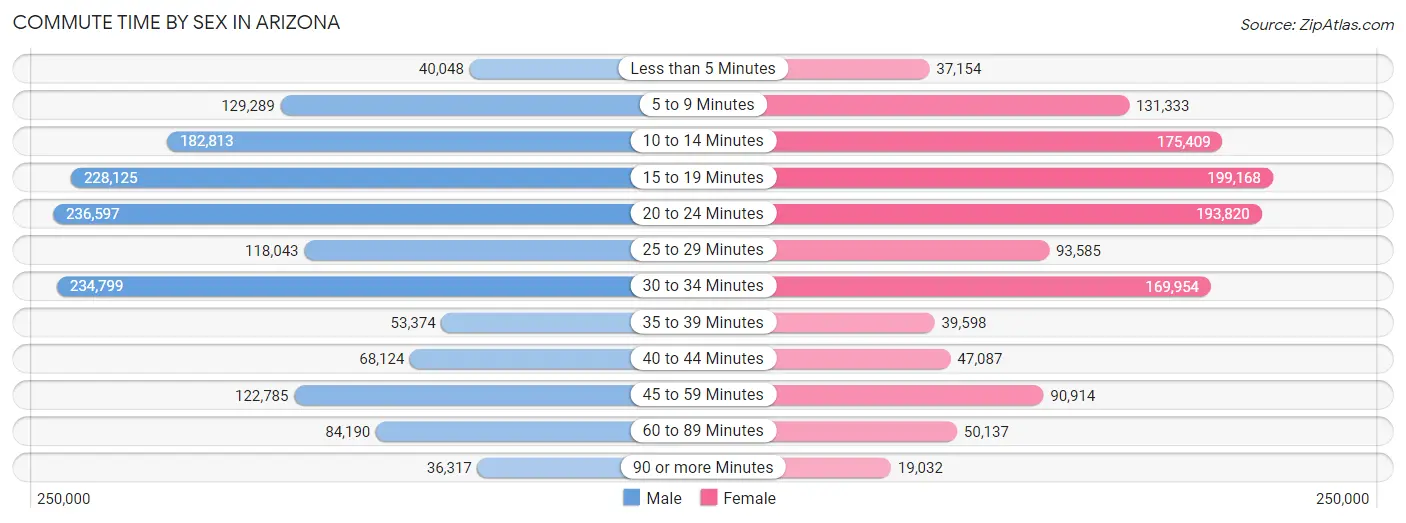
| Commute Time | Male | Female |
| Less than 5 Minutes | 40,048 (2.6%) | 37,154 (3.0%) |
| 5 to 9 Minutes | 129,289 (8.4%) | 131,333 (10.5%) |
| 10 to 14 Minutes | 182,813 (11.9%) | 175,409 (14.1%) |
| 15 to 19 Minutes | 228,125 (14.9%) | 199,168 (16.0%) |
| 20 to 24 Minutes | 236,597 (15.4%) | 193,820 (15.5%) |
| 25 to 29 Minutes | 118,043 (7.7%) | 93,585 (7.5%) |
| 30 to 34 Minutes | 234,799 (15.3%) | 169,954 (13.6%) |
| 35 to 39 Minutes | 53,374 (3.5%) | 39,598 (3.2%) |
| 40 to 44 Minutes | 68,124 (4.4%) | 47,087 (3.8%) |
| 45 to 59 Minutes | 122,785 (8.0%) | 90,914 (7.3%) |
| 60 to 89 Minutes | 84,190 (5.5%) | 50,137 (4.0%) |
| 90 or more Minutes | 36,317 (2.4%) | 19,032 (1.5%) |
Time of Departure to Work by Sex in Arizona
The most frequent times of departure to work in Arizona are 7:00 AM to 7:29 AM (180,832, 11.8%) for males and 7:00 AM to 7:29 AM (185,034, 14.8%) for females.
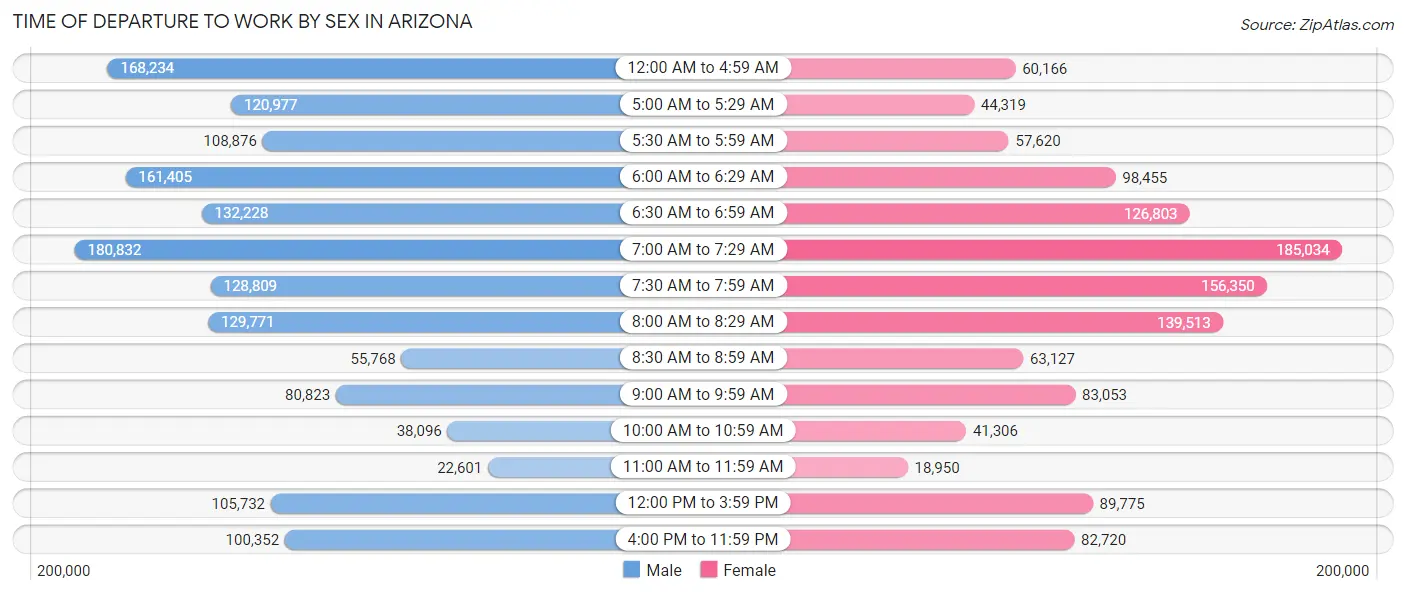
| Time of Departure | Male | Female |
| 12:00 AM to 4:59 AM | 168,234 (11.0%) | 60,166 (4.8%) |
| 5:00 AM to 5:29 AM | 120,977 (7.9%) | 44,319 (3.5%) |
| 5:30 AM to 5:59 AM | 108,876 (7.1%) | 57,620 (4.6%) |
| 6:00 AM to 6:29 AM | 161,405 (10.5%) | 98,455 (7.9%) |
| 6:30 AM to 6:59 AM | 132,228 (8.6%) | 126,803 (10.2%) |
| 7:00 AM to 7:29 AM | 180,832 (11.8%) | 185,034 (14.8%) |
| 7:30 AM to 7:59 AM | 128,809 (8.4%) | 156,350 (12.5%) |
| 8:00 AM to 8:29 AM | 129,771 (8.5%) | 139,513 (11.2%) |
| 8:30 AM to 8:59 AM | 55,768 (3.6%) | 63,127 (5.1%) |
| 9:00 AM to 9:59 AM | 80,823 (5.3%) | 83,053 (6.7%) |
| 10:00 AM to 10:59 AM | 38,096 (2.5%) | 41,306 (3.3%) |
| 11:00 AM to 11:59 AM | 22,601 (1.5%) | 18,950 (1.5%) |
| 12:00 PM to 3:59 PM | 105,732 (6.9%) | 89,775 (7.2%) |
| 4:00 PM to 11:59 PM | 100,352 (6.5%) | 82,720 (6.6%) |
| Total | 1,534,504 (100.0%) | 1,247,191 (100.0%) |
Housing Occupancy in Arizona
Occupancy by Ownership in Arizona
Of the total 2,739,136 dwellings in Arizona, owner-occupied units account for 1,815,352 (66.3%), while renter-occupied units make up 923,784 (33.7%).
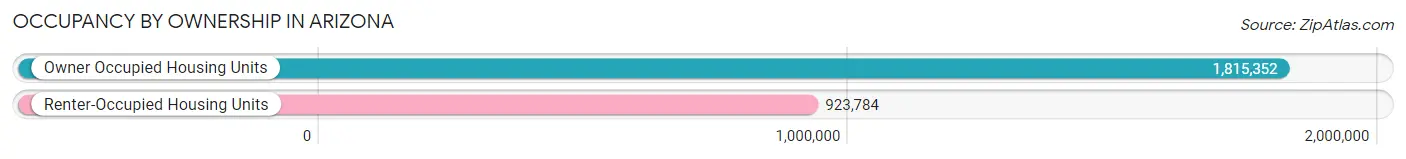
| Occupancy | # Housing Units | % Housing Units |
| Owner Occupied Housing Units | 1,815,352 | 66.3% |
| Renter-Occupied Housing Units | 923,784 | 33.7% |
| Total Occupied Housing Units | 2,739,136 | 100.0% |
Occupancy by Household Size in Arizona
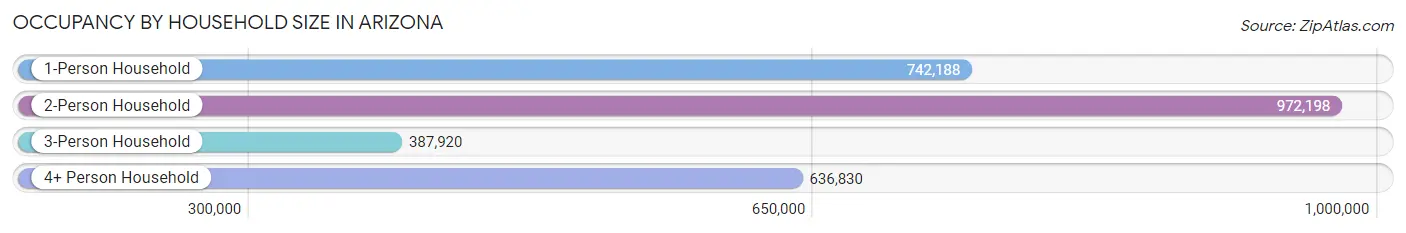
| Household Size | # Housing Units | % Housing Units |
| 1-Person Household | 742,188 | 27.1% |
| 2-Person Household | 972,198 | 35.5% |
| 3-Person Household | 387,920 | 14.2% |
| 4+ Person Household | 636,830 | 23.3% |
| Total Housing Units | 2,739,136 | 100.0% |
Occupancy by Ownership by Household Size in Arizona
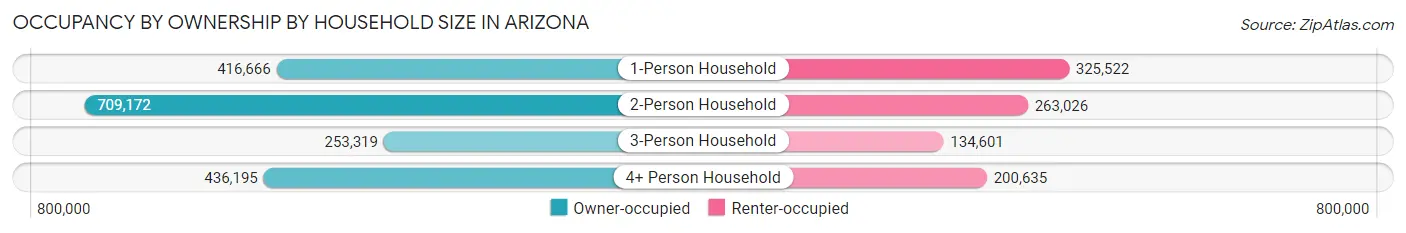
| Household Size | Owner-occupied | Renter-occupied |
| 1-Person Household | 416,666 (56.1%) | 325,522 (43.9%) |
| 2-Person Household | 709,172 (73.0%) | 263,026 (27.1%) |
| 3-Person Household | 253,319 (65.3%) | 134,601 (34.7%) |
| 4+ Person Household | 436,195 (68.5%) | 200,635 (31.5%) |
| Total Housing Units | 1,815,352 (66.3%) | 923,784 (33.7%) |
Occupancy by Educational Attainment in Arizona
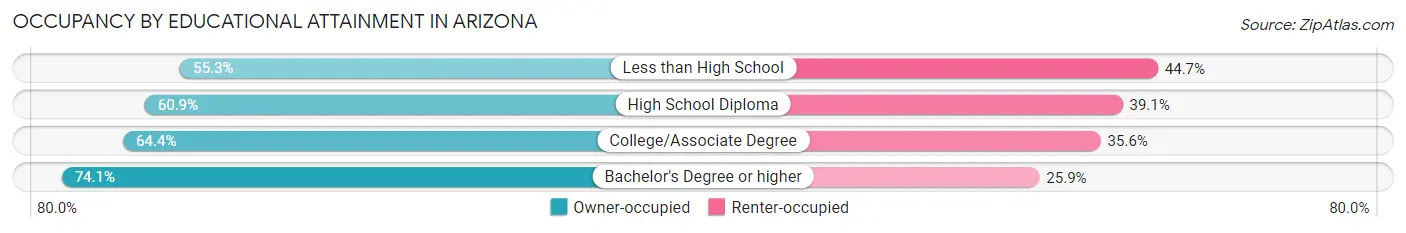
| Household Size | Owner-occupied | Renter-occupied |
| Less than High School | 139,704 (55.3%) | 112,840 (44.7%) |
| High School Diploma | 333,174 (60.9%) | 213,704 (39.1%) |
| College/Associate Degree | 629,501 (64.4%) | 348,192 (35.6%) |
| Bachelor's Degree or higher | 712,973 (74.1%) | 249,048 (25.9%) |
Occupancy by Age of Householder in Arizona
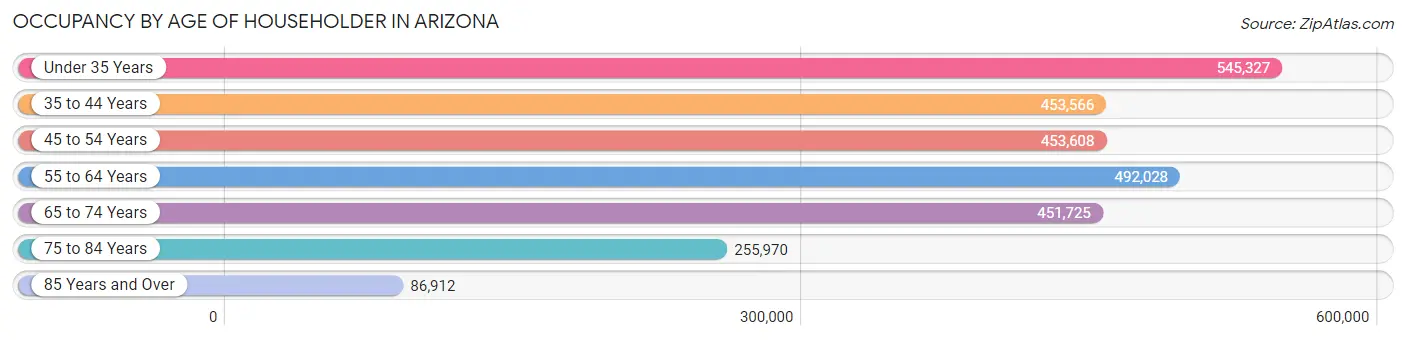
| Age Bracket | # Households | % Households |
| Under 35 Years | 545,327 | 19.9% |
| 35 to 44 Years | 453,566 | 16.6% |
| 45 to 54 Years | 453,608 | 16.6% |
| 55 to 64 Years | 492,028 | 18.0% |
| 65 to 74 Years | 451,725 | 16.5% |
| 75 to 84 Years | 255,970 | 9.3% |
| 85 Years and Over | 86,912 | 3.2% |
| Total | 2,739,136 | 100.0% |
Housing Finances in Arizona
Median Income by Occupancy in Arizona
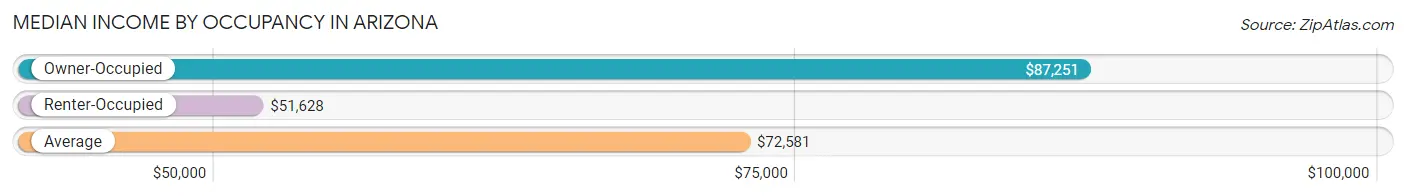
| Occupancy Type | # Households | Median Income |
| Owner-Occupied | 1,815,352 (66.3%) | $87,251 |
| Renter-Occupied | 923,784 (33.7%) | $51,628 |
| Average | 2,739,136 (100.0%) | $72,581 |
Occupancy by Householder Income Bracket in Arizona
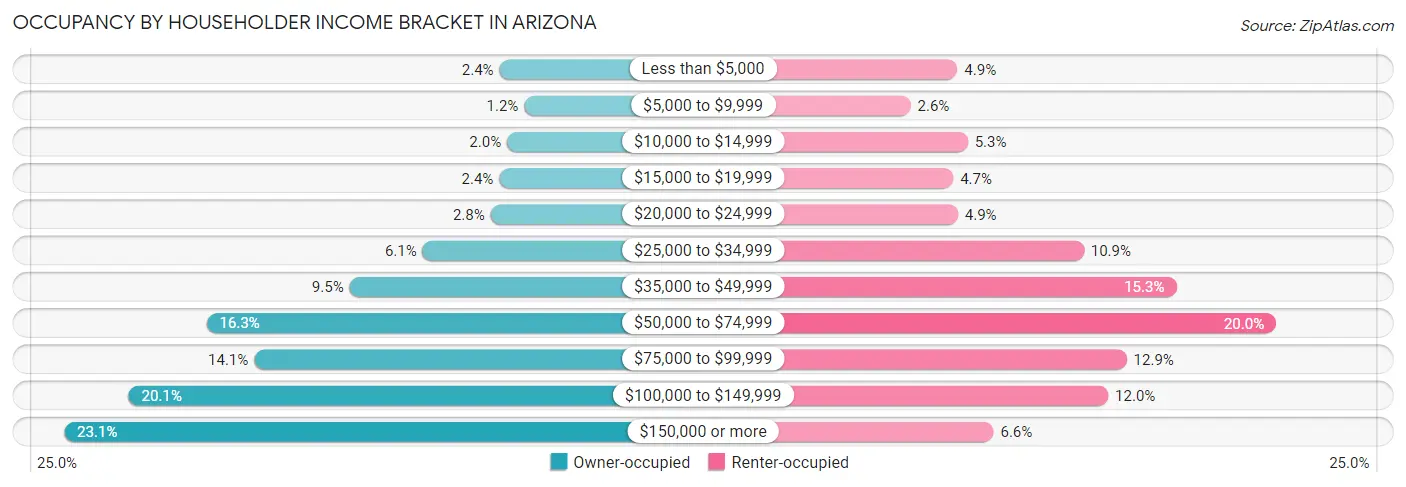
| Income Bracket | Owner-occupied | Renter-occupied |
| Less than $5,000 | 43,401 (2.4%) | 44,848 (4.9%) |
| $5,000 to $9,999 | 21,981 (1.2%) | 24,242 (2.6%) |
| $10,000 to $14,999 | 36,846 (2.0%) | 49,304 (5.3%) |
| $15,000 to $19,999 | 43,656 (2.4%) | 42,971 (4.6%) |
| $20,000 to $24,999 | 51,034 (2.8%) | 44,956 (4.9%) |
| $25,000 to $34,999 | 109,757 (6.0%) | 100,375 (10.9%) |
| $35,000 to $49,999 | 172,920 (9.5%) | 141,052 (15.3%) |
| $50,000 to $74,999 | 296,674 (16.3%) | 184,956 (20.0%) |
| $75,000 to $99,999 | 255,334 (14.1%) | 119,267 (12.9%) |
| $100,000 to $149,999 | 364,015 (20.1%) | 111,139 (12.0%) |
| $150,000 or more | 419,734 (23.1%) | 60,674 (6.6%) |
| Total | 1,815,352 (100.0%) | 923,784 (100.0%) |
Monthly Housing Cost Tiers in Arizona
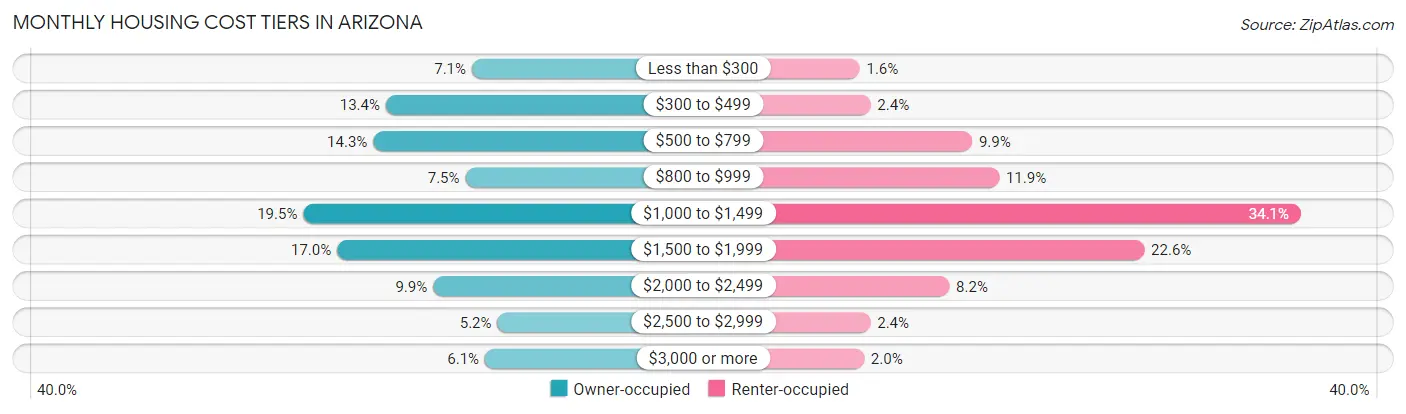
| Monthly Cost | Owner-occupied | Renter-occupied |
| Less than $300 | 128,229 (7.1%) | 15,090 (1.6%) |
| $300 to $499 | 243,285 (13.4%) | 22,490 (2.4%) |
| $500 to $799 | 260,122 (14.3%) | 91,576 (9.9%) |
| $800 to $999 | 136,886 (7.5%) | 109,901 (11.9%) |
| $1,000 to $1,499 | 353,646 (19.5%) | 315,327 (34.1%) |
| $1,500 to $1,999 | 308,402 (17.0%) | 208,661 (22.6%) |
| $2,000 to $2,499 | 180,014 (9.9%) | 76,059 (8.2%) |
| $2,500 to $2,999 | 93,964 (5.2%) | 22,398 (2.4%) |
| $3,000 or more | 110,804 (6.1%) | 18,020 (1.9%) |
| Total | 1,815,352 (100.0%) | 923,784 (100.0%) |
Physical Housing Characteristics in Arizona
Housing Structures in Arizona
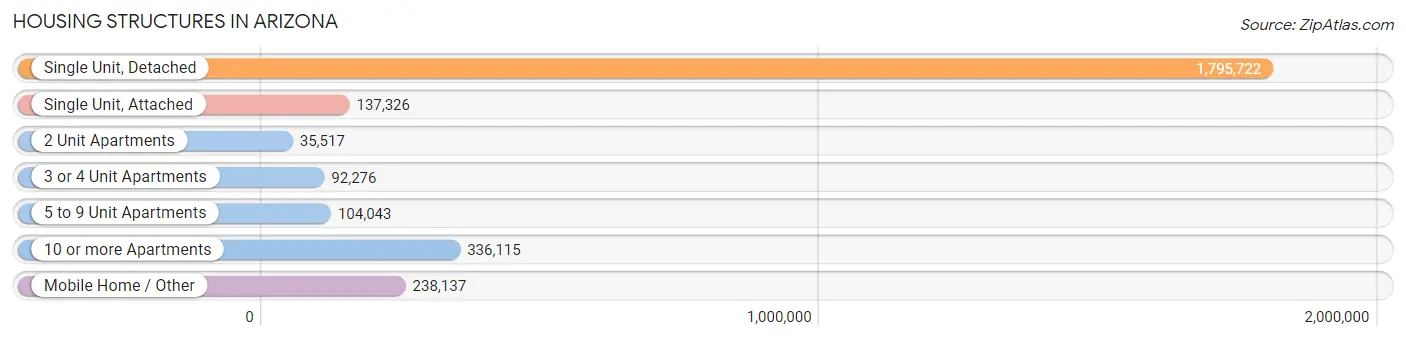
| Structure Type | # Housing Units | % Housing Units |
| Single Unit, Detached | 1,795,722 | 65.6% |
| Single Unit, Attached | 137,326 | 5.0% |
| 2 Unit Apartments | 35,517 | 1.3% |
| 3 or 4 Unit Apartments | 92,276 | 3.4% |
| 5 to 9 Unit Apartments | 104,043 | 3.8% |
| 10 or more Apartments | 336,115 | 12.3% |
| Mobile Home / Other | 238,137 | 8.7% |
| Total | 2,739,136 | 100.0% |
Housing Structures by Occupancy in Arizona
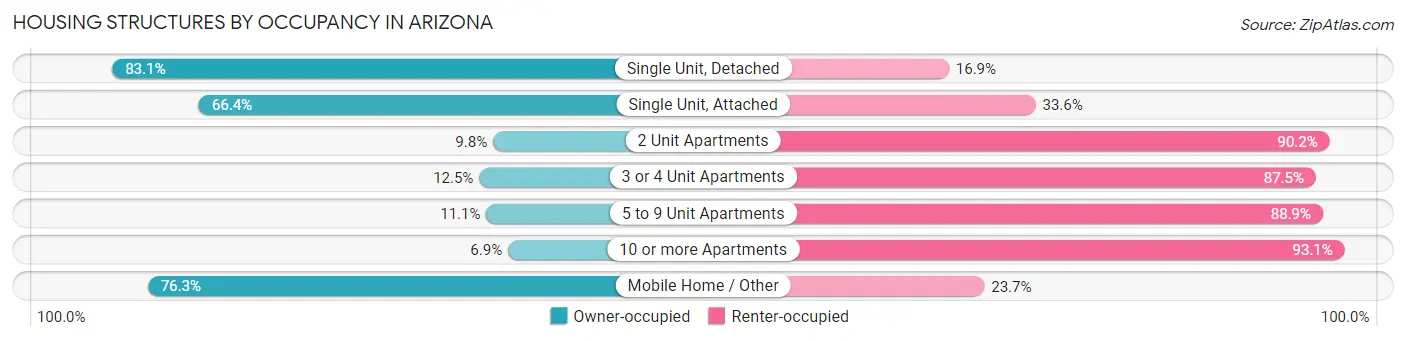
| Structure Type | Owner-occupied | Renter-occupied |
| Single Unit, Detached | 1,492,620 (83.1%) | 303,102 (16.9%) |
| Single Unit, Attached | 91,221 (66.4%) | 46,105 (33.6%) |
| 2 Unit Apartments | 3,487 (9.8%) | 32,030 (90.2%) |
| 3 or 4 Unit Apartments | 11,503 (12.5%) | 80,773 (87.5%) |
| 5 to 9 Unit Apartments | 11,558 (11.1%) | 92,485 (88.9%) |
| 10 or more Apartments | 23,289 (6.9%) | 312,826 (93.1%) |
| Mobile Home / Other | 181,674 (76.3%) | 56,463 (23.7%) |
| Total | 1,815,352 (66.3%) | 923,784 (33.7%) |
Housing Structures by Number of Rooms in Arizona
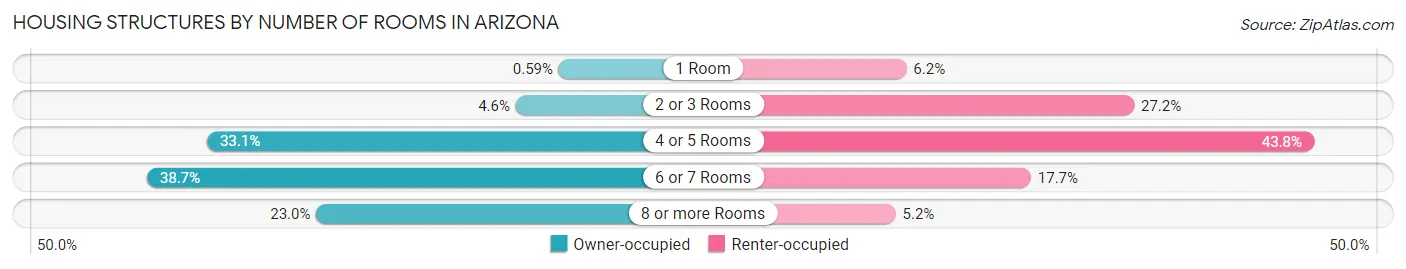
| Number of Rooms | Owner-occupied | Renter-occupied |
| 1 Room | 10,700 (0.6%) | 56,819 (6.1%) |
| 2 or 3 Rooms | 82,990 (4.6%) | 251,308 (27.2%) |
| 4 or 5 Rooms | 601,417 (33.1%) | 404,887 (43.8%) |
| 6 or 7 Rooms | 702,413 (38.7%) | 163,157 (17.7%) |
| 8 or more Rooms | 417,832 (23.0%) | 47,613 (5.1%) |
| Total | 1,815,352 (100.0%) | 923,784 (100.0%) |
Housing Structure by Heating Type in Arizona
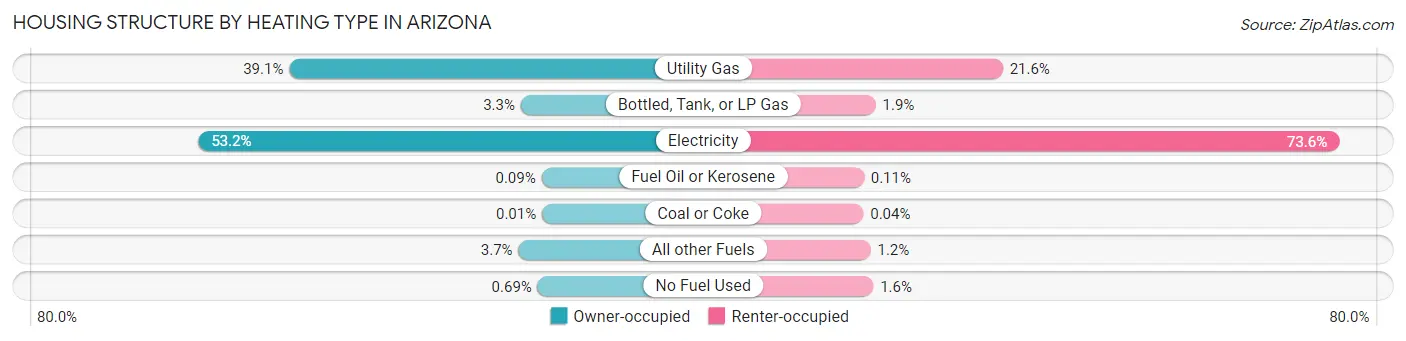
| Heating Type | Owner-occupied | Renter-occupied |
| Utility Gas | 709,671 (39.1%) | 199,462 (21.6%) |
| Bottled, Tank, or LP Gas | 59,933 (3.3%) | 17,961 (1.9%) |
| Electricity | 965,078 (53.2%) | 679,729 (73.6%) |
| Fuel Oil or Kerosene | 1,562 (0.1%) | 1,045 (0.1%) |
| Coal or Coke | 155 (0.0%) | 394 (0.0%) |
| All other Fuels | 66,371 (3.7%) | 10,685 (1.2%) |
| No Fuel Used | 12,582 (0.7%) | 14,508 (1.6%) |
| Total | 1,815,352 (100.0%) | 923,784 (100.0%) |
Household Vehicle Usage in Arizona
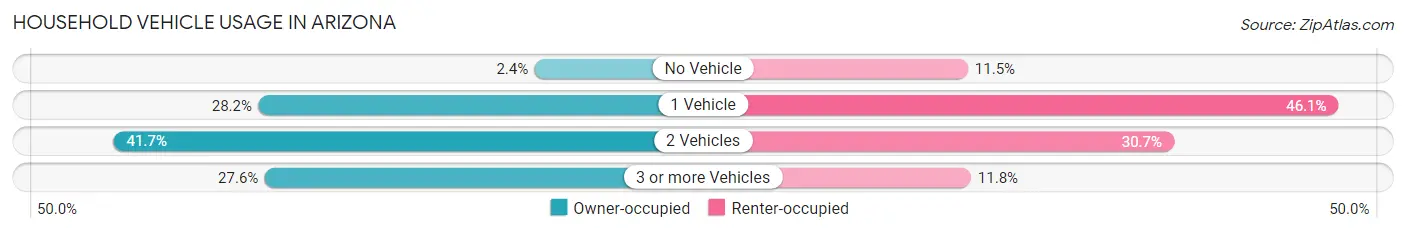
| Vehicles per Household | Owner-occupied | Renter-occupied |
| No Vehicle | 44,223 (2.4%) | 106,072 (11.5%) |
| 1 Vehicle | 512,517 (28.2%) | 425,497 (46.1%) |
| 2 Vehicles | 756,881 (41.7%) | 283,589 (30.7%) |
| 3 or more Vehicles | 501,731 (27.6%) | 108,626 (11.8%) |
| Total | 1,815,352 (100.0%) | 923,784 (100.0%) |
Real Estate & Mortgages in Arizona
Real Estate and Mortgage Overview in Arizona
| Characteristic | Without Mortgage | With Mortgage |
| Housing Units | 674,498 | 1,140,854 |
| Median Property Value | $267,900 | $346,500 |
| Median Household Income | $63,159 | $319,429 |
| Monthly Housing Costs | $481 | $108,451 |
| Real Estate Taxes | $1,619 | $34,509 |
Property Value by Mortgage Status in Arizona
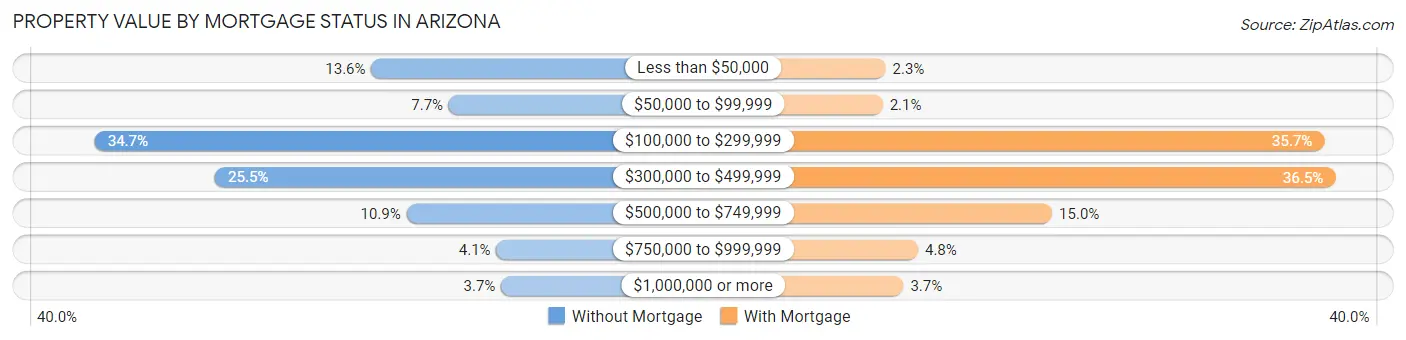
| Property Value | Without Mortgage | With Mortgage |
| Less than $50,000 | 91,568 (13.6%) | 26,140 (2.3%) |
| $50,000 to $99,999 | 51,702 (7.7%) | 23,563 (2.1%) |
| $100,000 to $299,999 | 233,706 (34.6%) | 407,332 (35.7%) |
| $300,000 to $499,999 | 171,838 (25.5%) | 416,904 (36.5%) |
| $500,000 to $749,999 | 73,493 (10.9%) | 170,921 (15.0%) |
| $750,000 to $999,999 | 27,290 (4.1%) | 54,328 (4.8%) |
| $1,000,000 or more | 24,901 (3.7%) | 41,666 (3.6%) |
| Total | 674,498 (100.0%) | 1,140,854 (100.0%) |
Household Income by Mortgage Status in Arizona
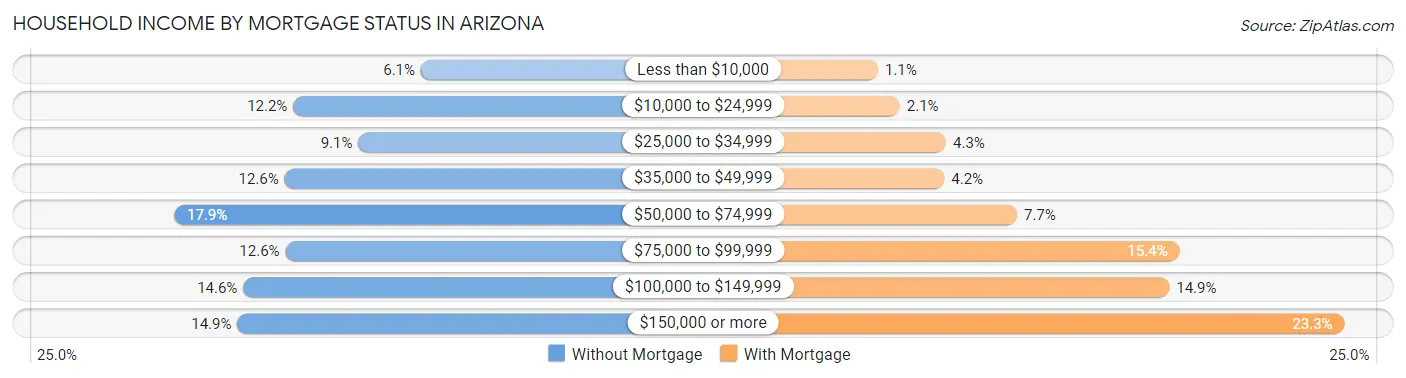
| Household Income | Without Mortgage | With Mortgage |
| Less than $10,000 | 41,330 (6.1%) | 12,209 (1.1%) |
| $10,000 to $24,999 | 82,358 (12.2%) | 24,052 (2.1%) |
| $25,000 to $34,999 | 61,480 (9.1%) | 49,178 (4.3%) |
| $35,000 to $49,999 | 85,142 (12.6%) | 48,277 (4.2%) |
| $50,000 to $74,999 | 120,618 (17.9%) | 87,778 (7.7%) |
| $75,000 to $99,999 | 84,848 (12.6%) | 176,056 (15.4%) |
| $100,000 to $149,999 | 98,417 (14.6%) | 170,486 (14.9%) |
| $150,000 or more | 100,305 (14.9%) | 265,598 (23.3%) |
| Total | 674,498 (100.0%) | 1,140,854 (100.0%) |
Property Value to Household Income Ratio in Arizona
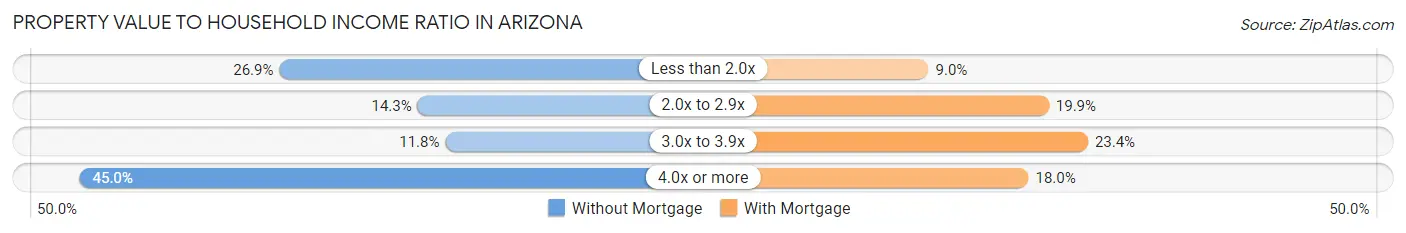
| Value-to-Income Ratio | Without Mortgage | With Mortgage |
| Less than 2.0x | 181,258 (26.9%) | 102,250 (9.0%) |
| 2.0x to 2.9x | 96,562 (14.3%) | 226,839 (19.9%) |
| 3.0x to 3.9x | 79,568 (11.8%) | 267,260 (23.4%) |
| 4.0x or more | 303,503 (45.0%) | 205,810 (18.0%) |
| Total | 674,498 (100.0%) | 1,140,854 (100.0%) |
Real Estate Taxes by Mortgage Status in Arizona
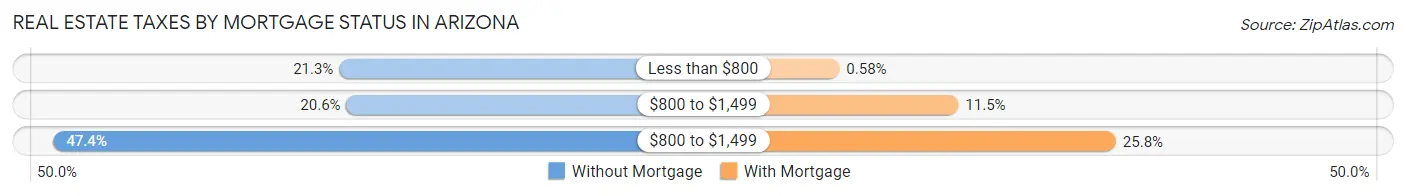
| Property Taxes | Without Mortgage | With Mortgage |
| Less than $800 | 143,467 (21.3%) | 6,564 (0.6%) |
| $800 to $1,499 | 139,018 (20.6%) | 130,605 (11.5%) |
| $800 to $1,499 | 319,413 (47.4%) | 294,641 (25.8%) |
| Total | 674,498 (100.0%) | 1,140,854 (100.0%) |
Health & Disability in Arizona
Health Insurance Coverage by Age in Arizona
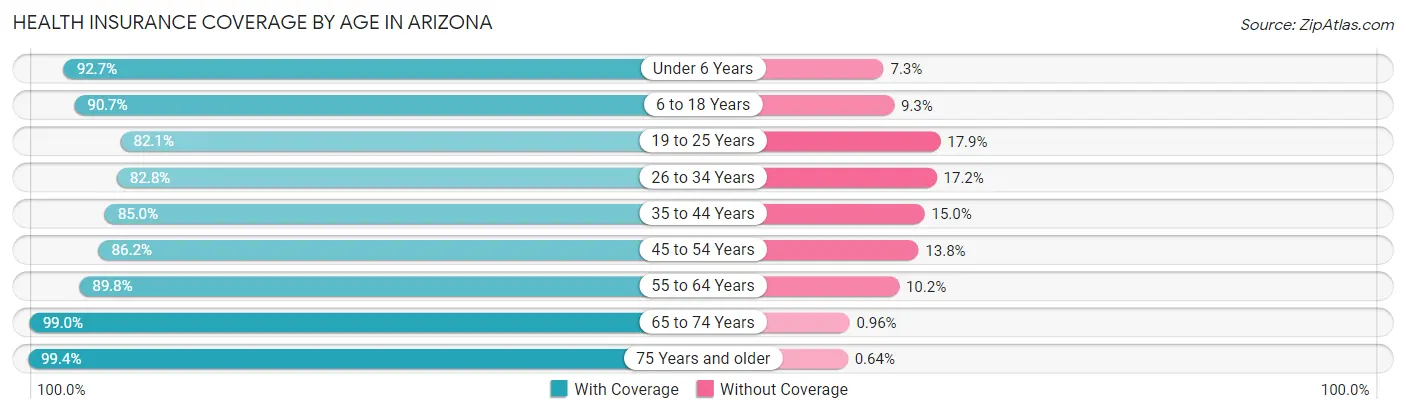
| Age Bracket | With Coverage | Without Coverage |
| Under 6 Years | 450,426 (92.7%) | 35,599 (7.3%) |
| 6 to 18 Years | 1,095,568 (90.7%) | 112,090 (9.3%) |
| 19 to 25 Years | 559,297 (82.1%) | 121,925 (17.9%) |
| 26 to 34 Years | 706,610 (82.8%) | 147,004 (17.2%) |
| 35 to 44 Years | 740,496 (85.0%) | 130,405 (15.0%) |
| 45 to 54 Years | 713,931 (86.2%) | 114,513 (13.8%) |
| 55 to 64 Years | 766,253 (89.8%) | 87,012 (10.2%) |
| 65 to 74 Years | 732,957 (99.0%) | 7,120 (1.0%) |
| 75 Years and older | 535,649 (99.4%) | 3,465 (0.6%) |
| Total | 6,301,187 (89.2%) | 759,133 (10.7%) |
Health Insurance Coverage by Citizenship Status in Arizona
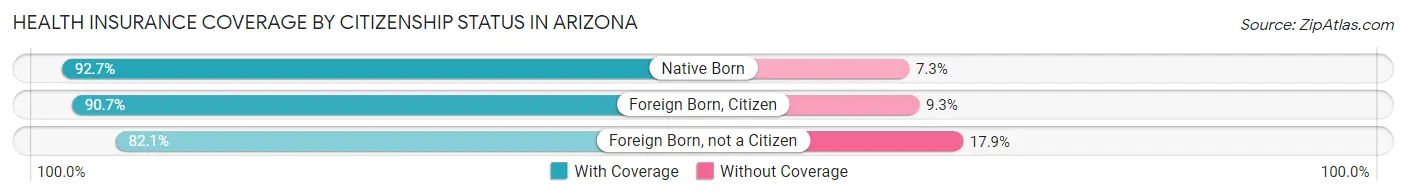
| Citizenship Status | With Coverage | Without Coverage |
| Native Born | 450,426 (92.7%) | 35,599 (7.3%) |
| Foreign Born, Citizen | 1,095,568 (90.7%) | 112,090 (9.3%) |
| Foreign Born, not a Citizen | 559,297 (82.1%) | 121,925 (17.9%) |
Health Insurance Coverage by Household Income in Arizona
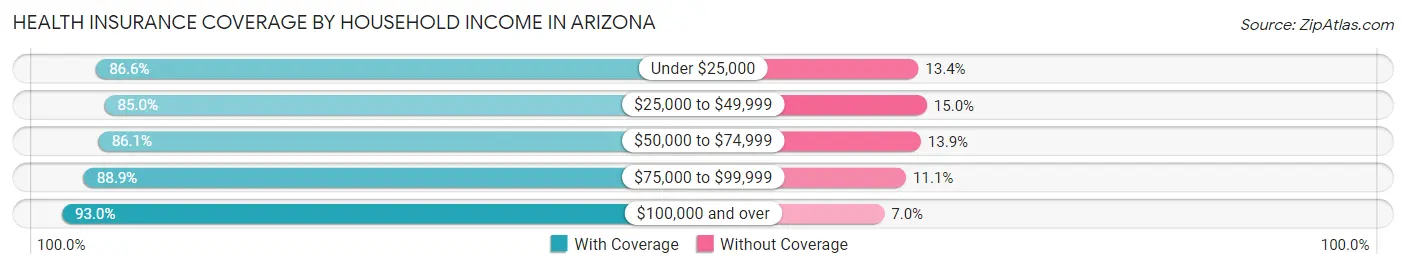
| Household Income | With Coverage | Without Coverage |
| Under $25,000 | 633,002 (86.6%) | 98,153 (13.4%) |
| $25,000 to $49,999 | 965,378 (85.0%) | 170,494 (15.0%) |
| $50,000 to $74,999 | 1,019,741 (86.1%) | 164,491 (13.9%) |
| $75,000 to $99,999 | 895,845 (88.9%) | 112,131 (11.1%) |
| $100,000 and over | 2,730,449 (93.0%) | 206,785 (7.0%) |
Public vs Private Health Insurance Coverage by Age in Arizona
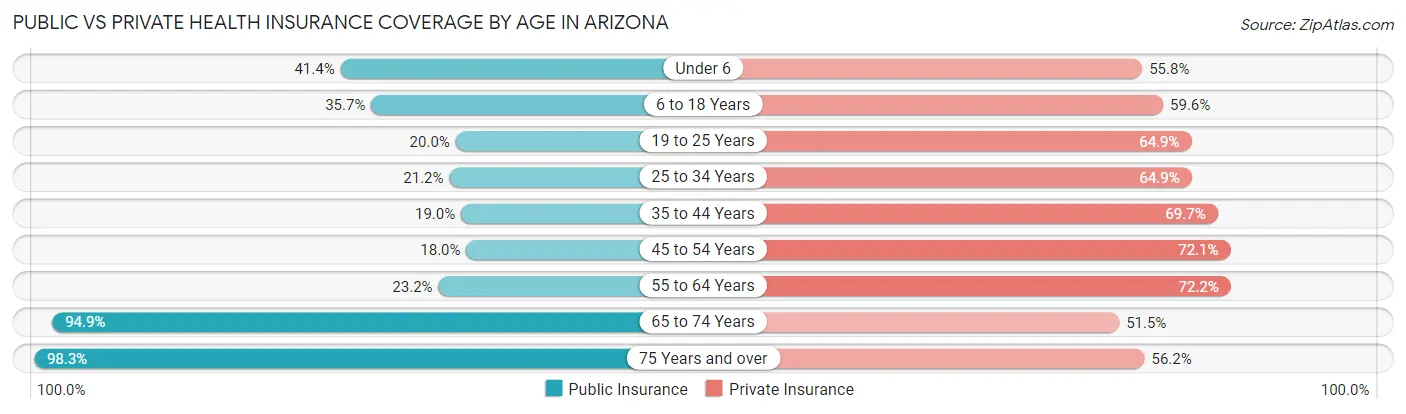
| Age Bracket | Public Insurance | Private Insurance |
| Under 6 | 201,063 (41.4%) | 271,066 (55.8%) |
| 6 to 18 Years | 430,700 (35.7%) | 720,237 (59.6%) |
| 19 to 25 Years | 136,151 (20.0%) | 441,879 (64.9%) |
| 25 to 34 Years | 180,606 (21.2%) | 554,081 (64.9%) |
| 35 to 44 Years | 165,416 (19.0%) | 607,286 (69.7%) |
| 45 to 54 Years | 149,109 (18.0%) | 597,292 (72.1%) |
| 55 to 64 Years | 197,892 (23.2%) | 615,807 (72.2%) |
| 65 to 74 Years | 702,079 (94.9%) | 381,040 (51.5%) |
| 75 Years and over | 529,708 (98.3%) | 302,951 (56.2%) |
| Total | 2,692,724 (38.1%) | 4,491,639 (63.6%) |
Disability Status by Sex by Age in Arizona
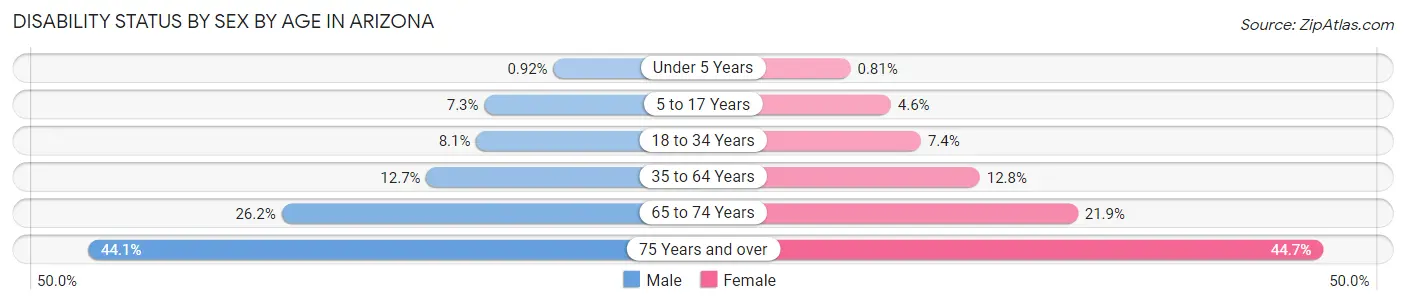
| Age Bracket | Male | Female |
| Under 5 Years | 1,890 (0.9%) | 1,602 (0.8%) |
| 5 to 17 Years | 44,518 (7.3%) | 26,440 (4.5%) |
| 18 to 34 Years | 67,330 (8.1%) | 59,117 (7.3%) |
| 35 to 64 Years | 160,423 (12.7%) | 165,310 (12.8%) |
| 65 to 74 Years | 90,862 (26.2%) | 86,018 (21.9%) |
| 75 Years and over | 107,127 (44.1%) | 132,316 (44.7%) |
Disability Class by Sex by Age in Arizona
Disability Class: Hearing Difficulty
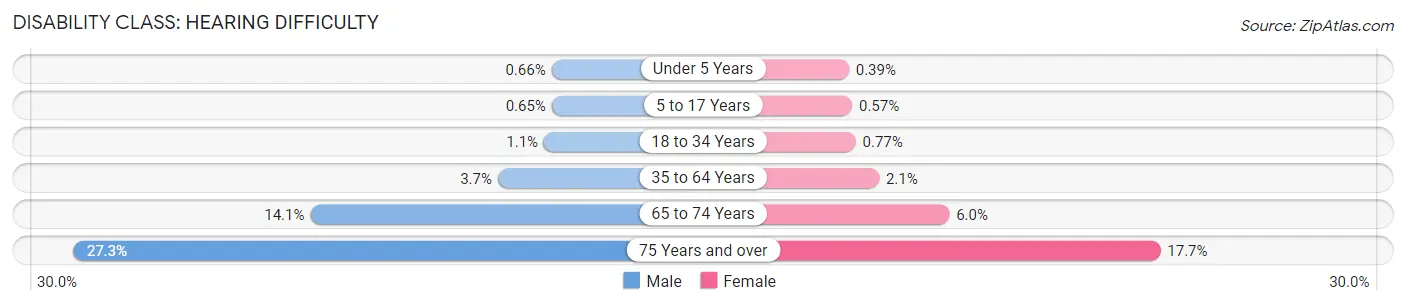
| Age Bracket | Male | Female |
| Under 5 Years | 1,352 (0.7%) | 760 (0.4%) |
| 5 to 17 Years | 3,947 (0.6%) | 3,293 (0.6%) |
| 18 to 34 Years | 8,989 (1.1%) | 6,159 (0.8%) |
| 35 to 64 Years | 46,026 (3.6%) | 26,723 (2.1%) |
| 65 to 74 Years | 48,939 (14.1%) | 23,476 (6.0%) |
| 75 Years and over | 66,208 (27.3%) | 52,561 (17.7%) |
Disability Class: Vision Difficulty
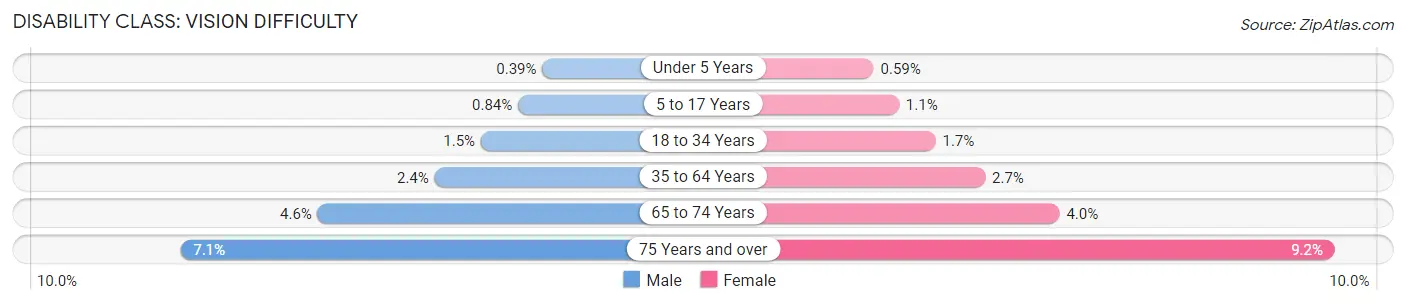
| Age Bracket | Male | Female |
| Under 5 Years | 811 (0.4%) | 1,156 (0.6%) |
| 5 to 17 Years | 5,110 (0.8%) | 6,186 (1.1%) |
| 18 to 34 Years | 12,764 (1.5%) | 13,979 (1.7%) |
| 35 to 64 Years | 30,114 (2.4%) | 34,371 (2.7%) |
| 65 to 74 Years | 15,825 (4.6%) | 15,860 (4.0%) |
| 75 Years and over | 17,272 (7.1%) | 27,094 (9.1%) |
Disability Class: Cognitive Difficulty
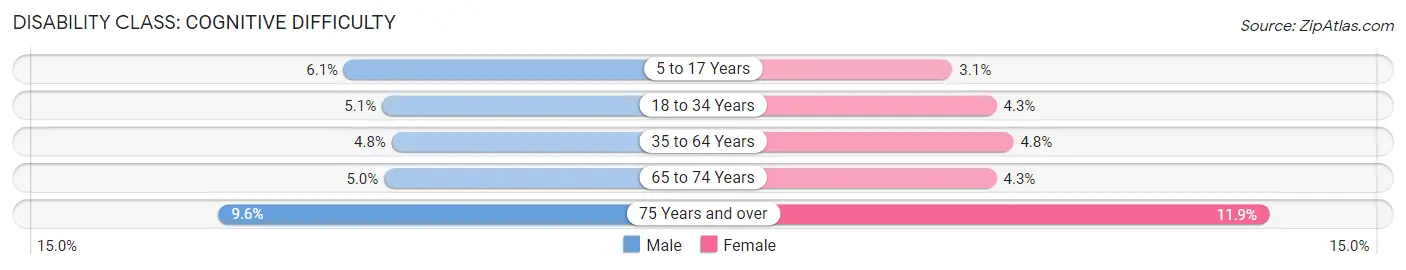
| Age Bracket | Male | Female |
| 5 to 17 Years | 37,084 (6.1%) | 17,882 (3.1%) |
| 18 to 34 Years | 42,108 (5.1%) | 34,641 (4.3%) |
| 35 to 64 Years | 60,308 (4.8%) | 61,651 (4.8%) |
| 65 to 74 Years | 17,329 (5.0%) | 16,940 (4.3%) |
| 75 Years and over | 23,319 (9.6%) | 35,211 (11.9%) |
Disability Class: Ambulatory Difficulty
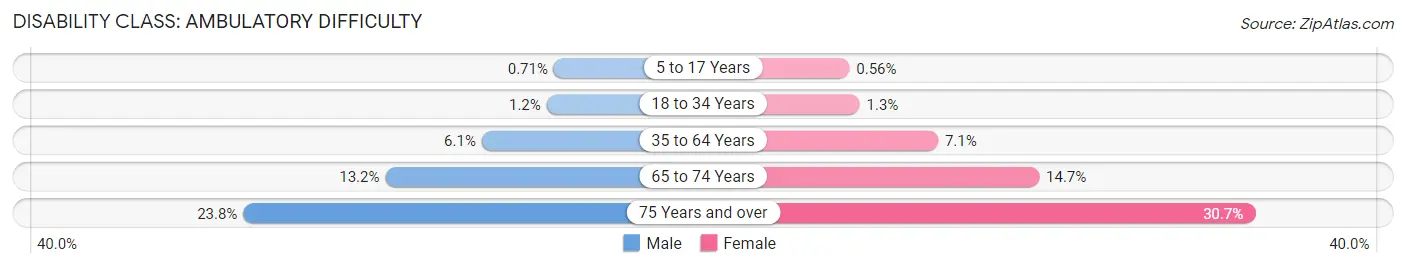
| Age Bracket | Male | Female |
| 5 to 17 Years | 4,305 (0.7%) | 3,270 (0.6%) |
| 18 to 34 Years | 10,369 (1.2%) | 10,626 (1.3%) |
| 35 to 64 Years | 76,428 (6.1%) | 92,098 (7.1%) |
| 65 to 74 Years | 45,928 (13.2%) | 57,548 (14.6%) |
| 75 Years and over | 57,719 (23.8%) | 90,908 (30.7%) |
Disability Class: Self-Care Difficulty
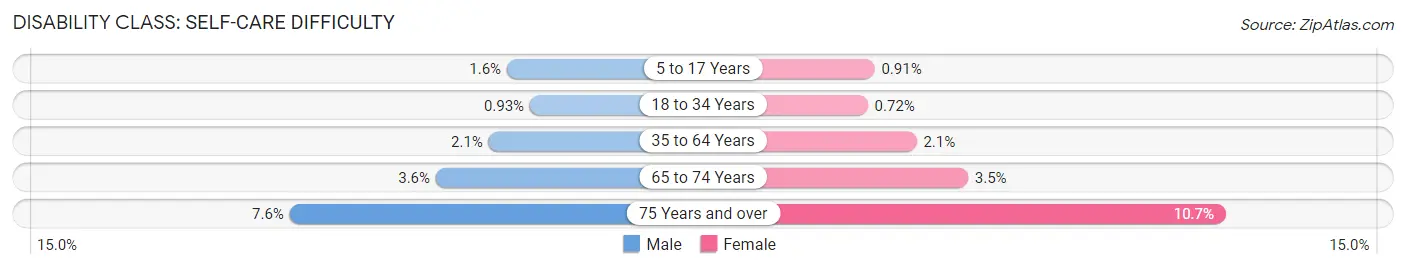
| Age Bracket | Male | Female |
| 5 to 17 Years | 9,544 (1.6%) | 5,280 (0.9%) |
| 18 to 34 Years | 7,756 (0.9%) | 5,787 (0.7%) |
| 35 to 64 Years | 26,278 (2.1%) | 26,820 (2.1%) |
| 65 to 74 Years | 12,336 (3.5%) | 13,788 (3.5%) |
| 75 Years and over | 18,502 (7.6%) | 31,670 (10.7%) |
Technology Access in Arizona
Computing Device Access in Arizona
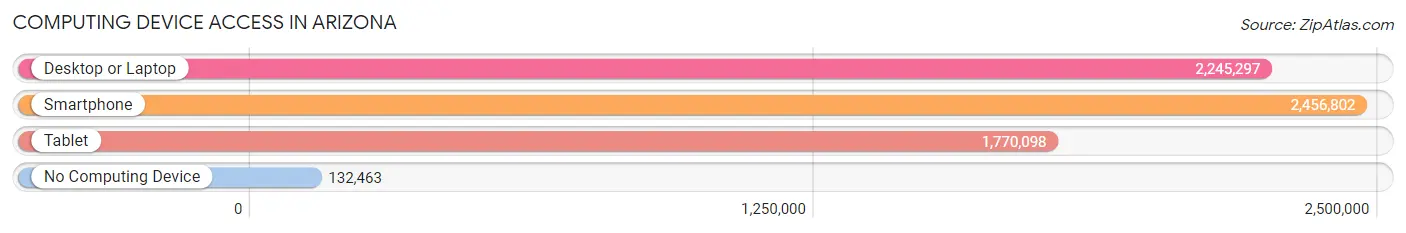
| Device Type | # Households | % Households |
| Desktop or Laptop | 2,245,297 | 82.0% |
| Smartphone | 2,456,802 | 89.7% |
| Tablet | 1,770,098 | 64.6% |
| No Computing Device | 132,463 | 4.8% |
| Total | 2,739,136 | 100.0% |
Internet Access in Arizona
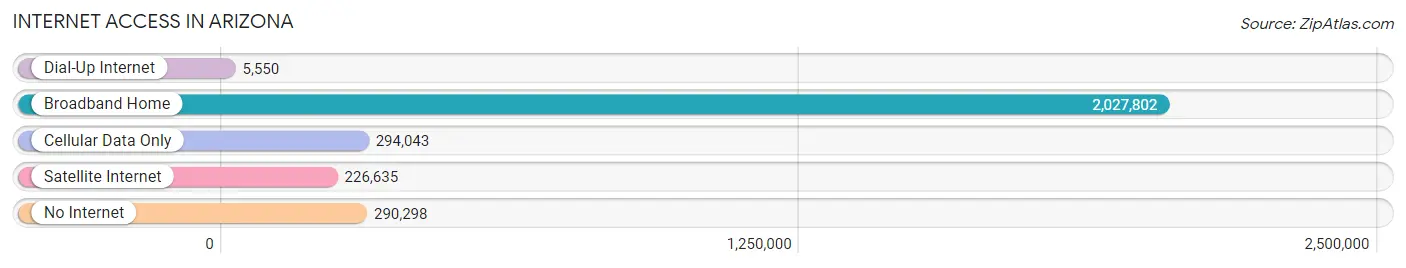
| Internet Type | # Households | % Households |
| Dial-Up Internet | 5,550 | 0.2% |
| Broadband Home | 2,027,802 | 74.0% |
| Cellular Data Only | 294,043 | 10.7% |
| Satellite Internet | 226,635 | 8.3% |
| No Internet | 290,298 | 10.6% |
| Total | 2,739,136 | 100.0% |
Arizona Summary
Arizona is a state located in the southwestern region of the United States. It is the sixth largest state in the country and is bordered by California, Nevada, Utah, New Mexico, and Mexico. Arizona is known for its desert climate, its diverse landscape, and its rich history.
Geography
Arizona is located in the southwestern region of the United States and is bordered by California, Nevada, Utah, New Mexico, and Mexico. It is the sixth largest state in the country and covers an area of 113,990 square miles. Arizona is divided into 15 counties and is home to the Grand Canyon National Park, one of the most iconic natural wonders in the world. The state is known for its desert climate, with hot summers and mild winters. The highest point in the state is Humphreys Peak, located in the San Francisco Peaks at 12,633 feet. The lowest point is the Colorado River at 70 feet.
Economy
Arizona’s economy is largely based on tourism, agriculture, and manufacturing. The state is home to several major industries, including aerospace, electronics, and semiconductor manufacturing. Arizona is also a major producer of copper, which is mined in the state’s copper belt. Other major industries include cattle ranching, cotton farming, and tourism. The state is also home to several major universities, including the University of Arizona and Arizona State University.
Demographics
As of 2020, the population of Arizona was estimated to be 7.3 million. The state is home to a diverse population, with the largest ethnic groups being White (63.7%), Hispanic or Latino (30.2%), and Native American (5.3%). The median household income in Arizona is $58,945, and the median age is 37.7 years.
History
Arizona has a long and rich history, dating back to the early Native American tribes who inhabited the area. The first Europeans to explore the area were Spanish explorers in the 16th century. In 1848, the area became part of the United States after the Mexican-American War. Arizona was admitted to the Union in 1912 and became the 48th state.
Throughout the 20th century, Arizona experienced rapid growth and development. The state’s economy was largely based on agriculture and mining, but in the 1950s, the state began to diversify its economy. In the 1960s, Arizona became a popular tourist destination, and the state’s population began to grow rapidly. Today, Arizona is a major tourist destination and is home to several major industries.
Common Questions
When was Arizona Incorporated?
Arizona was Incorporated into the Union on Feb 14, 1912.
What is the Total Area of Arizona?
Total Area of Arizona is 113,990 Square Miles.
What is the Total Land Area of Arizona?
Total Land Area of Arizona is 113,595 Square Miles.
What is the Total Water Area of Arizona?
Total Water Area of Arizona is 396 Square Miles.
What is the Average Elevation in Arizona?
Average Elevation in Arizona is 4,100 Feet.
What is the Highest Elevation in Arizona?
Highest Elevation in Arizona is 12,633 Feet.
What is the Lowest Elevation in Arizona?
Lowest Elevation in Arizona is 70 Feet.
What is the Population Density in Arizona?
Population Density in Arizona is 63.1 People per Square Mile.
What is Per Capita Income in Arizona?
Per Capita income in Arizona is $38,334.
What is the Median Family Income in Arizona?
Median Family Income in Arizona is $86,737.
What is the Median Household income in Arizona?
Median Household Income in Arizona is $72,581.
What is Income or Wage Gap in Arizona?
Income or Wage Gap in Arizona is 22.5%.
Women in Arizona earn 77.5 cents for every dollar earned by a man.
What is Family Income Deficit in Arizona?
Family Income Deficit in Arizona is $11,744.
Families that are below poverty line in Arizona earn $11,744 less on average than the poverty threshold level.
What is Inequality or Gini Index in Arizona?
Inequality or Gini Index in Arizona is 0.46.
What is the Total Population of Arizona?
Total Population of Arizona is 7,172,282.
What is the Total Male Population of Arizona?
Total Male Population of Arizona is 3,588,510.
What is the Total Female Population of Arizona?
Total Female Population of Arizona is 3,583,772.
What is the Ratio of Males per 100 Females in Arizona?
There are 100.13 Males per 100 Females in Arizona.
What is the Ratio of Females per 100 Males in Arizona?
There are 99.87 Females per 100 Males in Arizona.
What is the Median Population Age in Arizona?
Median Population Age in Arizona is 38.4 Years.
What is the Average Family Size in Arizona
Average Family Size in Arizona is 3.1 People.
What is the Average Household Size in Arizona
Average Household Size in Arizona is 2.6 People.
How Large is the Labor Force in Arizona?
There are 3,487,472 People in the Labor Forcein in Arizona.
What is the Percentage of People in the Labor Force in Arizona?
60.5% of People are in the Labor Force in Arizona.
What is the Unemployment Rate in Arizona?
Unemployment Rate in Arizona is 5.4%.