District Of Columbia Map & Demographics
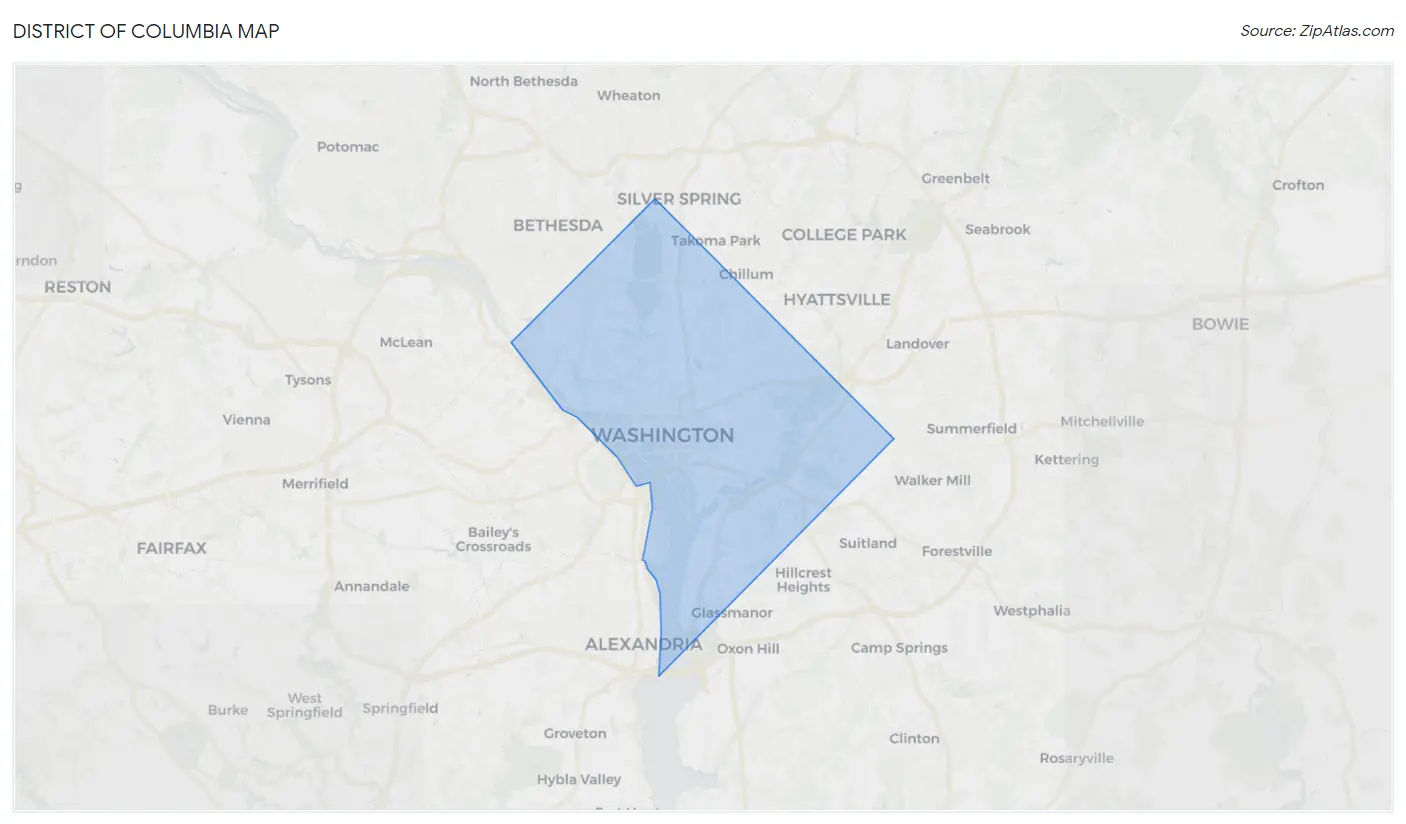
District Of Columbia Map
District Of Columbia Overview
Jun 16, 1790
INCORPORATED
68
TOTAL AREA [ SQ MI ]
61
LAND AREA [ SQ MI ]
7
WATER AREA [ SQ MI ]
20
ELEVATION AVG [ FT ]
409
ELEVATION HIGH [ FT ]
Sea Level
ELEVATION LOW [ FT ]
10,993.2
POP DENSITY [ PPL / SQ MI ]
$71,297
PER CAPITA INCOME
$142,328
AVG FAMILY INCOME
$101,722
AVG HOUSEHOLD INCOME
13.7%
WAGE / INCOME GAP [ % ]
86.3¢/ $1
WAGE / INCOME GAP [ $ ]
$13,486
FAMILY INCOME DEFICIT
0.52
INEQUALITY / GINI INDEX
20002
LARGEST ZIP CODE
Washington
LARGEST CITY
District of Columbia
LARGEST COUNTY
670,587
TOTAL POPULATION
320,797
MALE POPULATION
349,790
FEMALE POPULATION
91.71
MALES / 100 FEMALES
109.04
FEMALES / 100 MALES
34.8
MEDIAN AGE
3.0
AVG FAMILY SIZE
2.0
AVG HOUSEHOLD SIZE
400,882
LABOR FORCE [ PEOPLE ]
72.0%
PERCENT IN LABOR FORCE
7.1%
UNEMPLOYMENT RATE
District Of Columbia Area Codes
Income in District Of Columbia
Income Overview in District Of Columbia
Per Capita Income in District Of Columbia is $71,297, while median incomes of families and households are $142,328 and $101,722 respectively.
| Characteristic | Number | Measure |
| Per Capita Income | 670,587 | $71,297 |
| Median Family Income | 130,453 | $142,328 |
| Mean Family Income | 130,453 | $199,406 |
| Median Household Income | 315,785 | $101,722 |
| Mean Household Income | 315,785 | $150,292 |
| Income Deficit | 130,453 | $13,486 |
| Wage / Income Gap (%) | 670,587 | 13.67% |
| Wage / Income Gap ($) | 670,587 | 86.33¢ per $1 |
| Gini / Inequality Index | 670,587 | 0.52 |
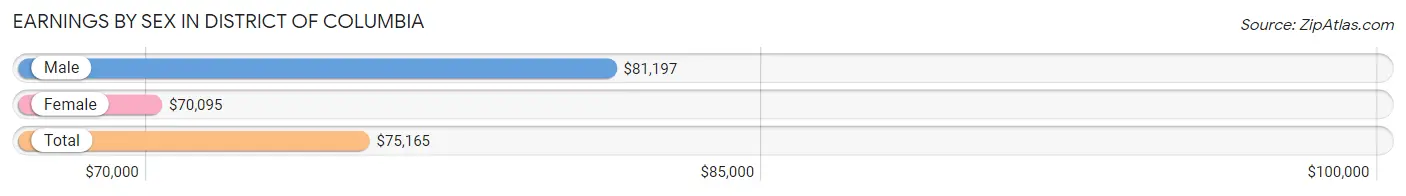
Earnings by Sex in District Of Columbia
Average Earnings in District Of Columbia are $75,165, $81,197 for men and $70,095 for women, a difference of 13.7%.
| Sex | Number | Average Earnings |
| Male | 199,435 (48.6%) | $81,197 |
| Female | 210,749 (51.4%) | $70,095 |
| Total | 410,184 (100.0%) | $75,165 |
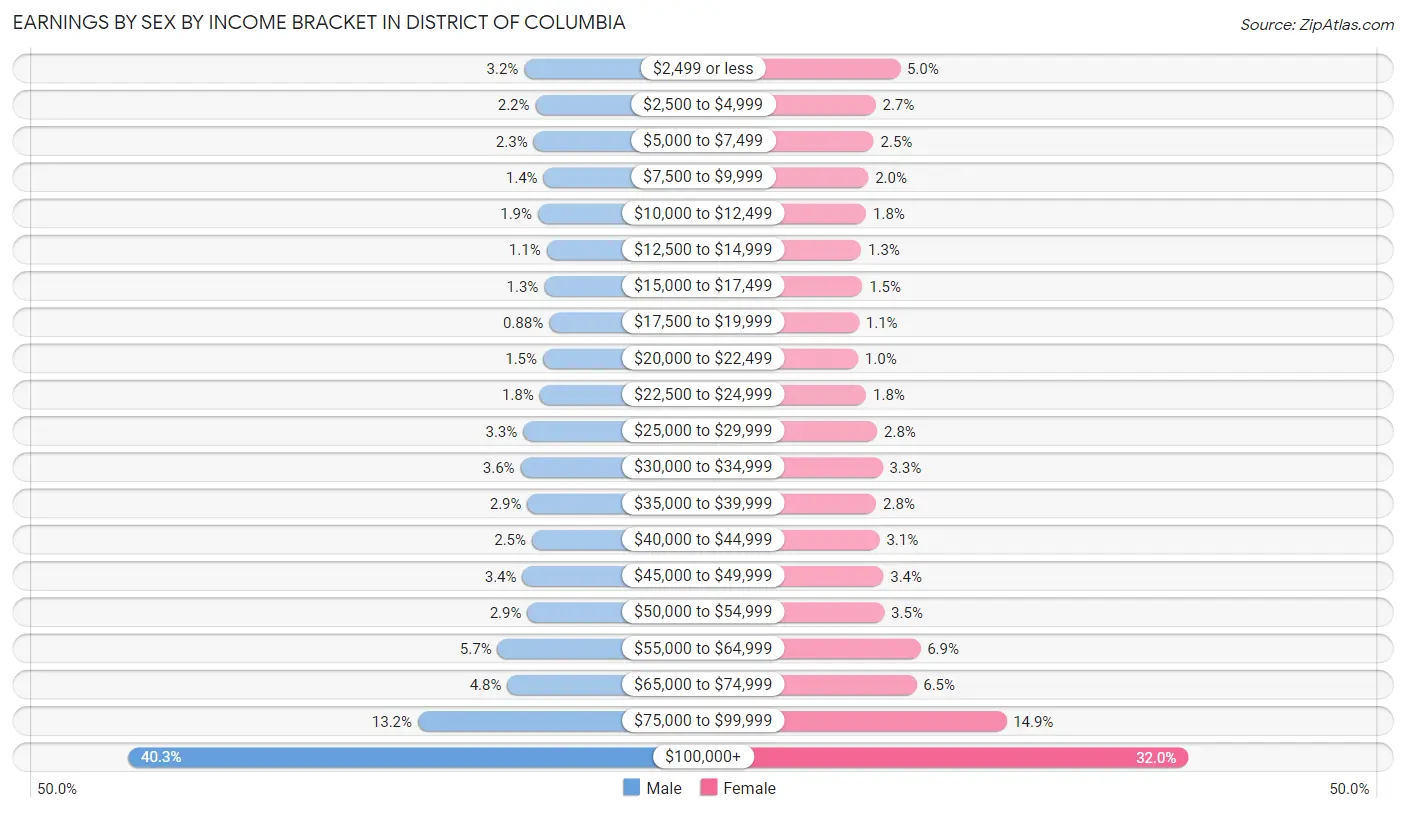
Earnings by Sex by Income Bracket in District Of Columbia
The most common earnings brackets in District Of Columbia are $100,000+ for men (80,394 | 40.3%) and $100,000+ for women (67,400 | 32.0%).
| Income | Male | Female |
| $2,499 or less | 6,385 (3.2%) | 10,492 (5.0%) |
| $2,500 to $4,999 | 4,288 (2.1%) | 5,678 (2.7%) |
| $5,000 to $7,499 | 4,641 (2.3%) | 5,294 (2.5%) |
| $7,500 to $9,999 | 2,799 (1.4%) | 4,232 (2.0%) |
| $10,000 to $12,499 | 3,829 (1.9%) | 3,809 (1.8%) |
| $12,500 to $14,999 | 2,217 (1.1%) | 2,831 (1.3%) |
| $15,000 to $17,499 | 2,662 (1.3%) | 3,063 (1.5%) |
| $17,500 to $19,999 | 1,759 (0.9%) | 2,389 (1.1%) |
| $20,000 to $22,499 | 2,899 (1.5%) | 2,195 (1.0%) |
| $22,500 to $24,999 | 3,520 (1.8%) | 3,818 (1.8%) |
| $25,000 to $29,999 | 6,576 (3.3%) | 5,976 (2.8%) |
| $30,000 to $34,999 | 7,072 (3.5%) | 7,039 (3.3%) |
| $35,000 to $39,999 | 5,791 (2.9%) | 5,797 (2.8%) |
| $40,000 to $44,999 | 4,946 (2.5%) | 6,452 (3.1%) |
| $45,000 to $49,999 | 6,713 (3.4%) | 7,218 (3.4%) |
| $50,000 to $54,999 | 5,805 (2.9%) | 7,370 (3.5%) |
| $55,000 to $64,999 | 11,361 (5.7%) | 14,510 (6.9%) |
| $65,000 to $74,999 | 9,531 (4.8%) | 13,729 (6.5%) |
| $75,000 to $99,999 | 26,247 (13.2%) | 31,457 (14.9%) |
| $100,000+ | 80,394 (40.3%) | 67,400 (32.0%) |
| Total | 199,435 (100.0%) | 210,749 (100.0%) |
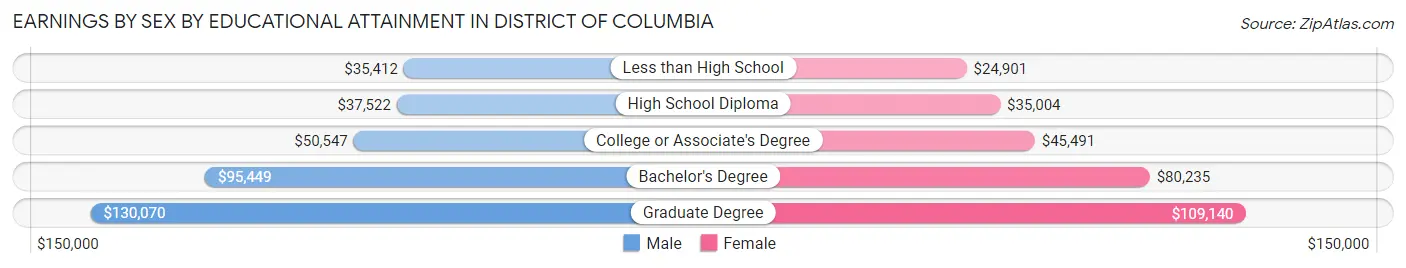
Earnings by Sex by Educational Attainment in District Of Columbia
Average earnings in District Of Columbia are $89,871 for men and $79,048 for women, a difference of 12.0%. Men with an educational attainment of graduate degree enjoy the highest average annual earnings of $130,070, while those with less than high school education earn the least with $35,412. Women with an educational attainment of graduate degree earn the most with the average annual earnings of $109,140, while those with less than high school education have the smallest earnings of $24,901.
| Educational Attainment | Male Income | Female Income |
| Less than High School | $35,412 | $24,901 |
| High School Diploma | $37,522 | $35,004 |
| College or Associate's Degree | $50,547 | $45,491 |
| Bachelor's Degree | $95,449 | $80,235 |
| Graduate Degree | $130,070 | $109,140 |
| Total | $89,871 | $79,048 |
Family Income in District Of Columbia
Family Income Brackets in District Of Columbia
According to the District Of Columbia family income data, there are 48,268 families falling into the $200,000+ income range, which is the most common income bracket and makes up 37.0% of all families. Conversely, the $10,000 to $14,999 income bracket is the least frequent group with only 2,870 families (2.2%) belonging to this category.
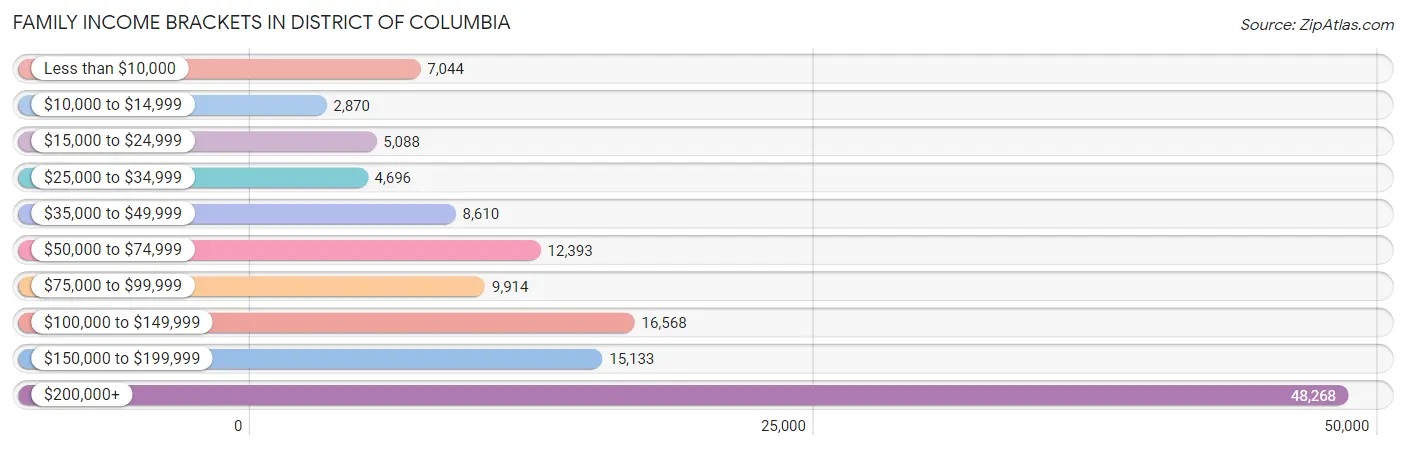
| Income Bracket | # Families | % Families |
| Less than $10,000 | 7,044 | 5.4% |
| $10,000 to $14,999 | 2,870 | 2.2% |
| $15,000 to $24,999 | 5,088 | 3.9% |
| $25,000 to $34,999 | 4,696 | 3.6% |
| $35,000 to $49,999 | 8,610 | 6.6% |
| $50,000 to $74,999 | 12,393 | 9.5% |
| $75,000 to $99,999 | 9,914 | 7.6% |
| $100,000 to $149,999 | 16,568 | 12.7% |
| $150,000 to $199,999 | 15,133 | 11.6% |
| $200,000+ | 48,268 | 37.0% |
Family Income by Famaliy Size in District Of Columbia
4-person families (20,399 | 15.6%) account for the highest median family income in District Of Columbia with $184,525 per family, while 2-person families (68,338 | 52.4%) have the highest median income of $69,392 per family member.
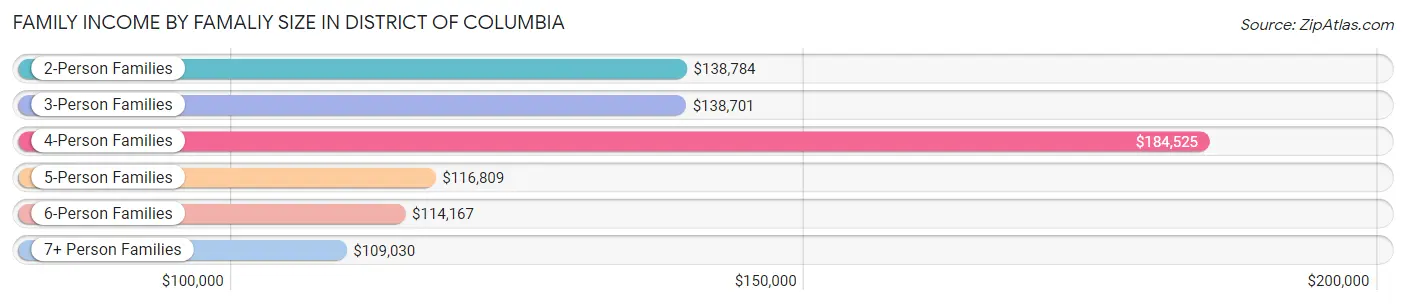
| Income Bracket | # Families | Median Income |
| 2-Person Families | 68,338 (52.4%) | $138,784 |
| 3-Person Families | 29,574 (22.7%) | $138,701 |
| 4-Person Families | 20,399 (15.6%) | $184,525 |
| 5-Person Families | 7,652 (5.9%) | $116,809 |
| 6-Person Families | 2,842 (2.2%) | $114,167 |
| 7+ Person Families | 1,648 (1.3%) | $109,030 |
| Total | 130,453 (100.0%) | $142,328 |
Family Income by Number of Earners in District Of Columbia
The median family income in District Of Columbia is $142,328, with families comprising 2 earners (66,365) having the highest median family income of $216,750, while families with no earners (16,516) have the lowest median family income of $25,480, accounting for 50.9% and 12.7% of families, respectively.
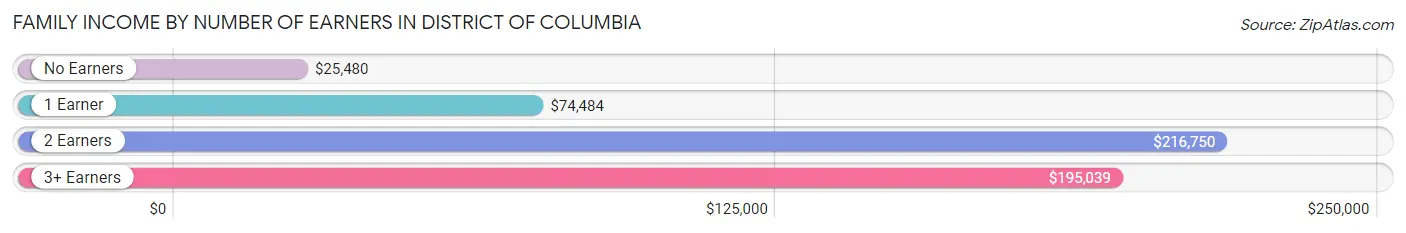
| Number of Earners | # Families | Median Income |
| No Earners | 16,516 (12.7%) | $25,480 |
| 1 Earner | 39,092 (30.0%) | $74,484 |
| 2 Earners | 66,365 (50.9%) | $216,750 |
| 3+ Earners | 8,480 (6.5%) | $195,039 |
| Total | 130,453 (100.0%) | $142,328 |
Household Income in District Of Columbia
Household Income Brackets in District Of Columbia
With 75,473 households falling in the category, the $200,000+ income range is the most frequent in District Of Columbia, accounting for 23.9% of all households. In contrast, only 11,684 households (3.7%) fall into the $10,000 to $14,999 income bracket, making it the least populous group.
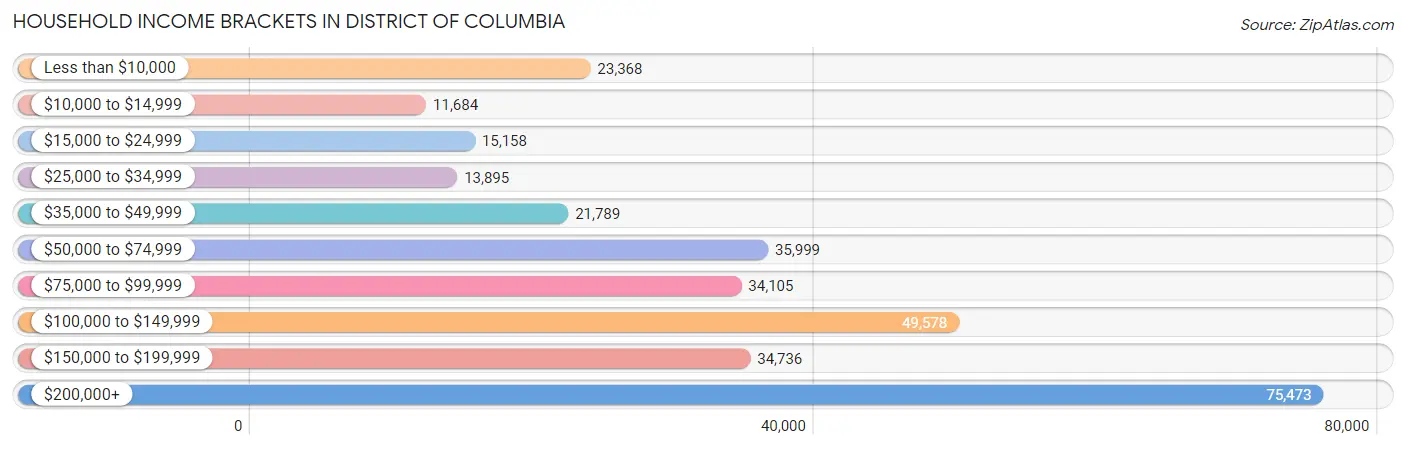
| Income Bracket | # Households | % Households |
| Less than $10,000 | 23,368 | 7.4% |
| $10,000 to $14,999 | 11,684 | 3.7% |
| $15,000 to $24,999 | 15,158 | 4.8% |
| $25,000 to $34,999 | 13,895 | 4.4% |
| $35,000 to $49,999 | 21,789 | 6.9% |
| $50,000 to $74,999 | 35,999 | 11.4% |
| $75,000 to $99,999 | 34,105 | 10.8% |
| $100,000 to $149,999 | 49,578 | 15.7% |
| $150,000 to $199,999 | 34,736 | 11.0% |
| $200,000+ | 75,473 | 23.9% |
Household Income by Householder Age in District Of Columbia
The median household income in District Of Columbia is $101,722, with the highest median household income of $118,096 found in the 25 to 44 years age bracket for the primary householder. A total of 151,817 households (48.1%) fall into this category. Meanwhile, the 15 to 24 years age bracket for the primary householder has the lowest median household income of $50,160, with 13,809 households (4.4%) in this group.
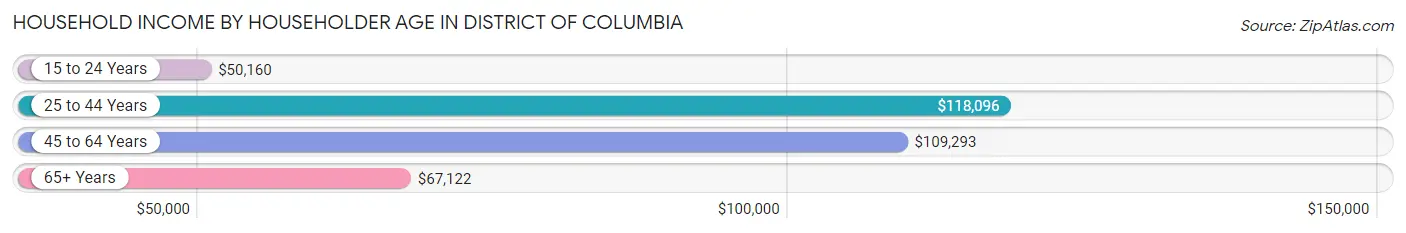
| Income Bracket | # Households | Median Income |
| 15 to 24 Years | 13,809 (4.4%) | $50,160 |
| 25 to 44 Years | 151,817 (48.1%) | $118,096 |
| 45 to 64 Years | 90,098 (28.5%) | $109,293 |
| 65+ Years | 60,061 (19.0%) | $67,122 |
| Total | 315,785 (100.0%) | $101,722 |
Poverty in District Of Columbia
Income Below Poverty by Sex and Age in District Of Columbia
With 13.8% poverty level for males and 16.3% for females among the residents of District Of Columbia, 18 to 24 year old males and 18 to 24 year old females are the most vulnerable to poverty, with 6,513 males (29.8%) and 7,877 females (30.7%) in their respective age groups living below the poverty level.
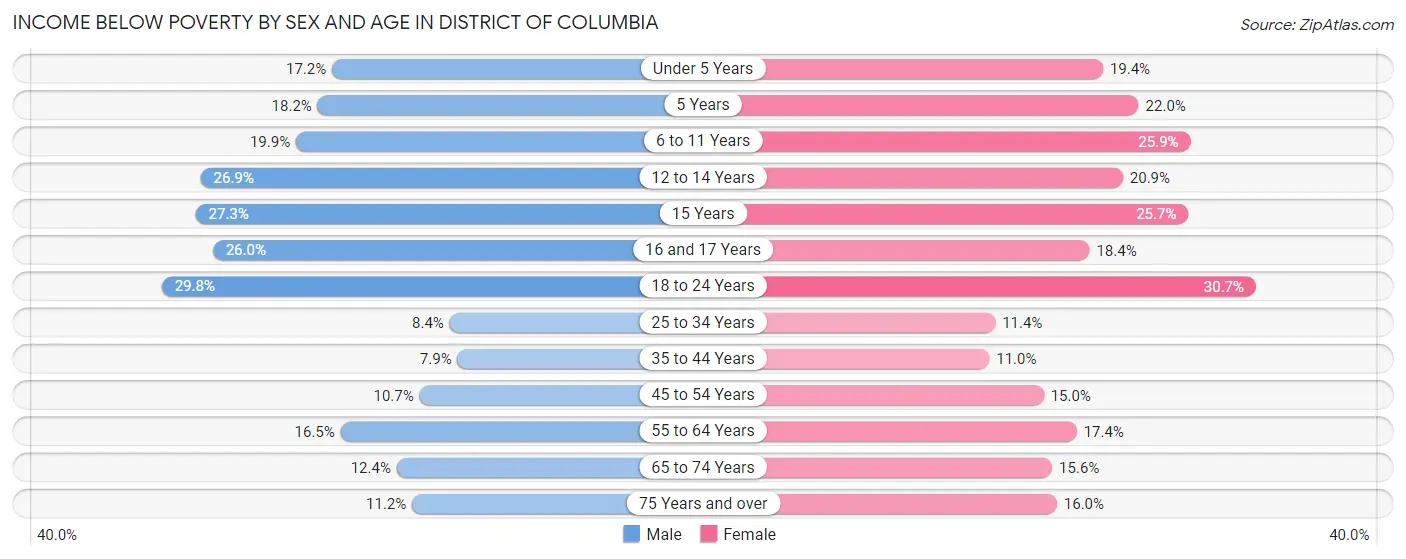
| Age Bracket | Male | Female |
| Under 5 Years | 3,602 (17.2%) | 3,872 (19.4%) |
| 5 Years | 629 (18.2%) | 790 (22.0%) |
| 6 to 11 Years | 4,105 (19.9%) | 5,345 (25.9%) |
| 12 to 14 Years | 2,453 (26.9%) | 1,784 (20.9%) |
| 15 Years | 742 (27.3%) | 665 (25.7%) |
| 16 and 17 Years | 1,264 (26.0%) | 947 (18.4%) |
| 18 to 24 Years | 6,513 (29.8%) | 7,877 (30.7%) |
| 25 to 34 Years | 5,971 (8.4%) | 9,159 (11.4%) |
| 35 to 44 Years | 4,167 (7.9%) | 5,968 (11.0%) |
| 45 to 54 Years | 3,906 (10.7%) | 5,335 (15.0%) |
| 55 to 64 Years | 5,310 (16.5%) | 5,963 (17.4%) |
| 65 to 74 Years | 2,592 (12.4%) | 4,254 (15.6%) |
| 75 Years and over | 1,446 (11.2%) | 3,380 (16.0%) |
| Total | 42,700 (13.8%) | 55,339 (16.3%) |
Income Above Poverty by Sex and Age in District Of Columbia
According to the poverty statistics in District Of Columbia, males aged 35 to 44 years and females aged 35 to 44 years are the age groups that are most secure financially, with 92.1% of males and 89.0% of females in these age groups living above the poverty line.
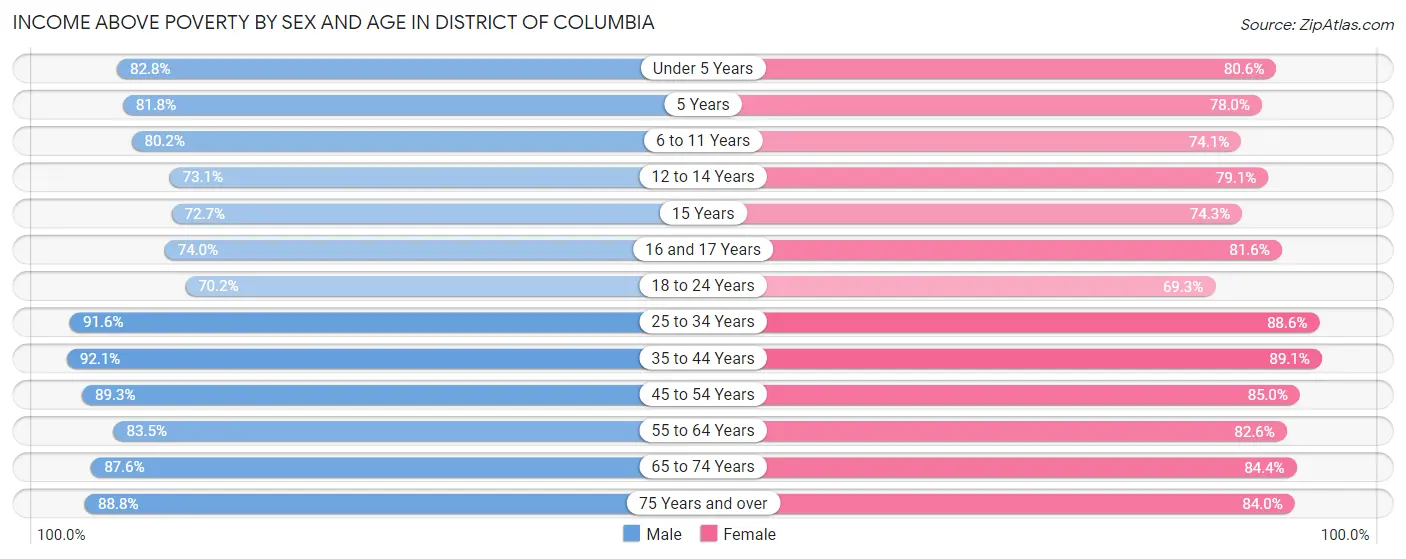
| Age Bracket | Male | Female |
| Under 5 Years | 17,381 (82.8%) | 16,099 (80.6%) |
| 5 Years | 2,819 (81.8%) | 2,794 (78.0%) |
| 6 to 11 Years | 16,575 (80.1%) | 15,305 (74.1%) |
| 12 to 14 Years | 6,656 (73.1%) | 6,763 (79.1%) |
| 15 Years | 1,976 (72.7%) | 1,921 (74.3%) |
| 16 and 17 Years | 3,592 (74.0%) | 4,202 (81.6%) |
| 18 to 24 Years | 15,330 (70.2%) | 17,748 (69.3%) |
| 25 to 34 Years | 64,812 (91.6%) | 71,262 (88.6%) |
| 35 to 44 Years | 48,871 (92.1%) | 48,530 (89.0%) |
| 45 to 54 Years | 32,682 (89.3%) | 30,248 (85.0%) |
| 55 to 64 Years | 26,791 (83.5%) | 28,230 (82.6%) |
| 65 to 74 Years | 18,358 (87.6%) | 22,985 (84.4%) |
| 75 Years and over | 11,427 (88.8%) | 17,788 (84.0%) |
| Total | 267,270 (86.2%) | 283,875 (83.7%) |
Income Below Poverty Among Married-Couple Families in District Of Columbia
The poverty statistics for married-couple families in District Of Columbia show that 3.0% or 2,382 of the total 79,884 families live below the poverty line. Families with 5 or more children have the highest poverty rate of 15.1%, comprising of 30 families. On the other hand, families with no children have the lowest poverty rate of 2.1%, which includes 990 families.
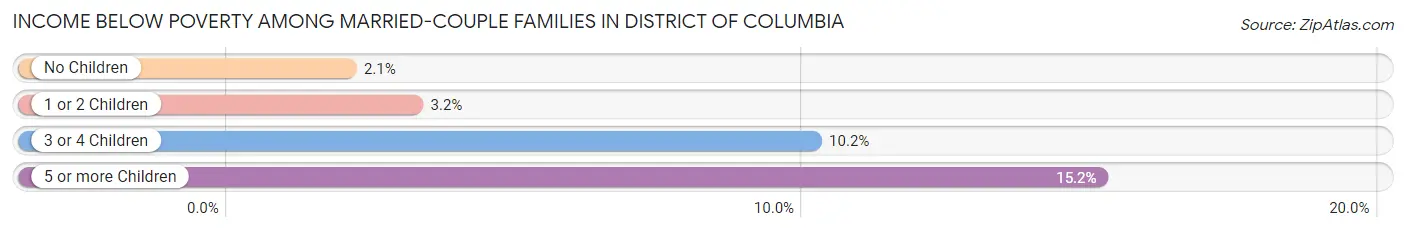
| Children | Above Poverty | Below Poverty |
| No Children | 46,871 (97.9%) | 990 (2.1%) |
| 1 or 2 Children | 26,152 (96.8%) | 874 (3.2%) |
| 3 or 4 Children | 4,311 (89.8%) | 488 (10.2%) |
| 5 or more Children | 168 (84.9%) | 30 (15.1%) |
| Total | 77,502 (97.0%) | 2,382 (3.0%) |
Income Below Poverty Among Single-Parent Households in District Of Columbia
According to the poverty data in District Of Columbia, 12.3% or 1,263 single-father households and 26.0% or 10,486 single-mother households are living below the poverty line. Among single-father households, those with 3 or 4 children have the highest poverty rate, with 73 households (23.3%) experiencing poverty. Likewise, among single-mother households, those with 5 or more children have the highest poverty rate, with 267 households (53.6%) falling below the poverty line.
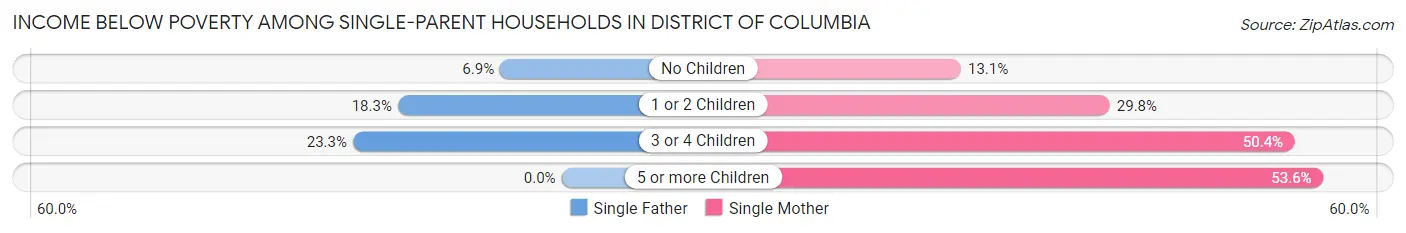
| Children | Single Father | Single Mother |
| No Children | 375 (6.9%) | 2,044 (13.1%) |
| 1 or 2 Children | 815 (18.3%) | 5,842 (29.7%) |
| 3 or 4 Children | 73 (23.3%) | 2,333 (50.4%) |
| 5 or more Children | 0 (0.0%) | 267 (53.6%) |
| Total | 1,263 (12.3%) | 10,486 (26.0%) |
Income Below Poverty Among Married-Couple vs Single-Parent Households in District Of Columbia
The poverty data for District Of Columbia shows that 2,382 of the married-couple family households (3.0%) and 11,749 of the single-parent households (23.2%) are living below the poverty level. Within the married-couple family households, those with 5 or more children have the highest poverty rate, with 30 households (15.1%) falling below the poverty line. Among the single-parent households, those with 5 or more children have the highest poverty rate, with 267 household (53.6%) living below poverty.
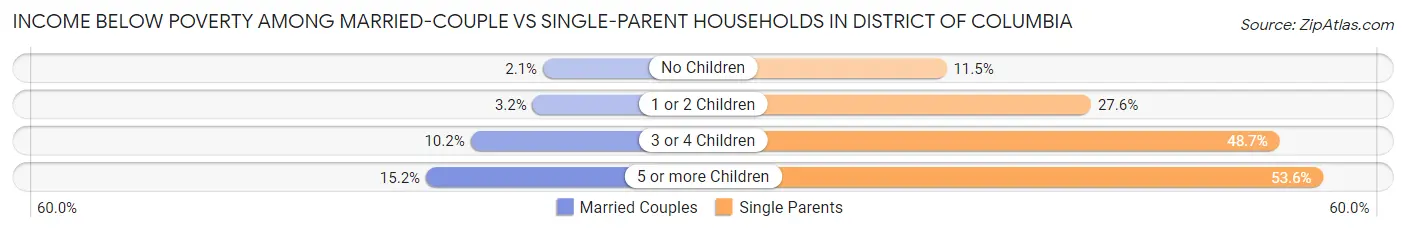
| Children | Married-Couple Families | Single-Parent Households |
| No Children | 990 (2.1%) | 2,419 (11.5%) |
| 1 or 2 Children | 874 (3.2%) | 6,657 (27.6%) |
| 3 or 4 Children | 488 (10.2%) | 2,406 (48.7%) |
| 5 or more Children | 30 (15.1%) | 267 (53.6%) |
| Total | 2,382 (3.0%) | 11,749 (23.2%) |
Largest Zip Codes by Population in District Of Columbia
The largest zip codes in District Of Columbia by population are 20002 (70,043), 20011 (67,127), 20019 (64,631), 20020 (52,349), and 20009 (50,247).
1.20002
70,043 (10.45%)
2.20011
67,127 (10.01%)
3.20019
64,631 (9.64%)
4.20020
52,349 (7.81%)
5.20009
50,247 (7.49%)
6.20001
44,056 (6.57%)
7.20032
40,266 (6.00%)
8.20003
34,585 (5.16%)
9.20016
32,570 (4.86%)
10.20010
32,254 (4.81%)
11.20008
29,545 (4.41%)
12.20007
23,797 (3.55%)
13.20017
20,643 (3.08%)
14.20018
20,475 (3.05%)
15.20012
17,637 (2.63%)
16.20024
15,444 (2.30%)
17.20015
15,394 (2.30%)
18.20005
13,014 (1.94%)
19.20037
11,833 (1.76%)
20.20036
4,734 (0.71%)
21.20057
2,354 (0.35%)
22.20052
1,915 (0.29%)
23.20004
1,782 (0.27%)
24.20006
1,257 (0.19%)
25.20064
1,101 (0.16%)
26.20059
785 (0.12%)
27.20390
331 (0.05%)
28.20373
321 (0.05%)
29.20422
54 (0.01%)
30.20319
43 (0.01%)
Race in District Of Columbia
The most populous races in District Of Columbia are Black / African American (297,101 | 44.3%), White / Caucasian (265,633 | 39.6%), and Hispanic or Latino (77,168 | 11.5%).
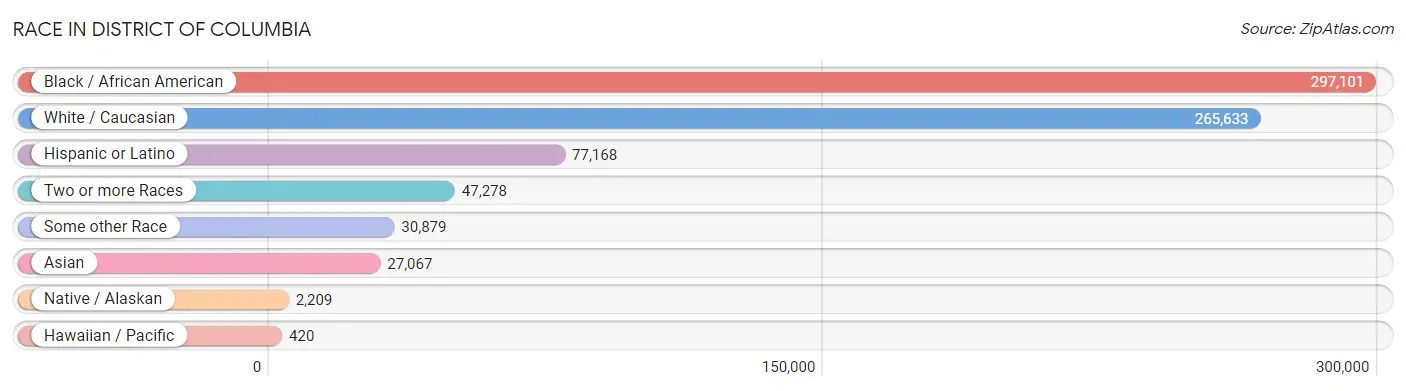
| Race | # Population | % Population |
| Asian | 27,067 | 4.0% |
| Black / African American | 297,101 | 44.3% |
| Hawaiian / Pacific | 420 | 0.1% |
| Hispanic or Latino | 77,168 | 11.5% |
| Native / Alaskan | 2,209 | 0.3% |
| White / Caucasian | 265,633 | 39.6% |
| Two or more Races | 47,278 | 7.0% |
| Some other Race | 30,879 | 4.6% |
| Total | 670,587 | 100.0% |
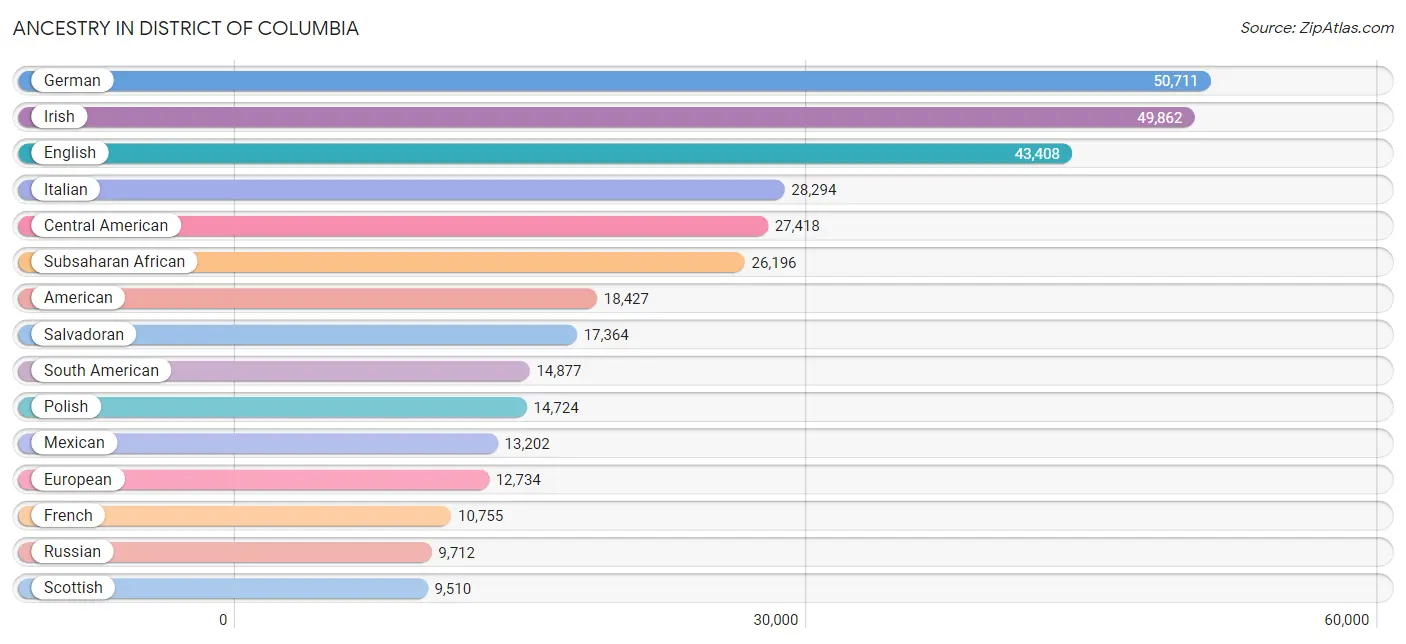
Ancestry in District Of Columbia
The most populous ancestries reported in District Of Columbia are German (50,711 | 7.6%), Irish (49,862 | 7.4%), English (43,408 | 6.5%), Italian (28,294 | 4.2%), and Central American (27,418 | 4.1%), together accounting for 29.8% of all District Of Columbia residents.
| Ancestry | # Population | % Population |
| Afghan | 141 | 0.0% |
| African | 8,930 | 1.3% |
| Alaska Native | 20 | 0.0% |
| Albanian | 579 | 0.1% |
| Alsatian | 63 | 0.0% |
| American | 18,427 | 2.8% |
| Apache | 187 | 0.0% |
| Arab | 6,041 | 0.9% |
| Argentinean | 1,801 | 0.3% |
| Armenian | 884 | 0.1% |
| Assyrian / Chaldean / Syriac | 80 | 0.0% |
| Australian | 325 | 0.1% |
| Austrian | 2,233 | 0.3% |
| Bahamian | 91 | 0.0% |
| Bangladeshi | 5 | 0.0% |
| Barbadian | 101 | 0.0% |
| Basque | 153 | 0.0% |
| Belgian | 514 | 0.1% |
| Belizean | 116 | 0.0% |
| Bermudan | 85 | 0.0% |
| Bhutanese | 2,719 | 0.4% |
| Blackfeet | 723 | 0.1% |
| Bolivian | 794 | 0.1% |
| Brazilian | 1,250 | 0.2% |
| British | 5,673 | 0.9% |
| British West Indian | 439 | 0.1% |
| Bulgarian | 606 | 0.1% |
| Burmese | 4,502 | 0.7% |
| Cajun | 136 | 0.0% |
| Cambodian | 48 | 0.0% |
| Canadian | 1,228 | 0.2% |
| Cape Verdean | 175 | 0.0% |
| Carpatho Rusyn | 2 | 0.0% |
| Celtic | 49 | 0.0% |
| Central American | 27,418 | 4.1% |
| Central American Indian | 1,358 | 0.2% |
| Cherokee | 1,874 | 0.3% |
| Cheyenne | 3 | 0.0% |
| Chickasaw | 49 | 0.0% |
| Chilean | 1,306 | 0.2% |
| Chinese | 48 | 0.0% |
| Chippewa | 40 | 0.0% |
| Choctaw | 130 | 0.0% |
| Colombian | 5,058 | 0.7% |
| Colville | 59 | 0.0% |
| Comanche | 14 | 0.0% |
| Costa Rican | 1,205 | 0.2% |
| Cree | 38 | 0.0% |
| Creek | 79 | 0.0% |
| Croatian | 839 | 0.1% |
| Cuban | 3,250 | 0.5% |
| Cypriot | 111 | 0.0% |
| Czech | 2,190 | 0.3% |
| Czechoslovakian | 257 | 0.0% |
| Danish | 1,743 | 0.3% |
| Delaware | 12 | 0.0% |
| Dominican | 4,483 | 0.7% |
| Dutch | 4,819 | 0.7% |
| Eastern European | 7,091 | 1.1% |
| Ecuadorian | 946 | 0.1% |
| Egyptian | 613 | 0.1% |
| English | 43,408 | 6.5% |
| Estonian | 90 | 0.0% |
| Ethiopian | 7,736 | 1.1% |
| European | 12,734 | 1.9% |
| Fijian | 16 | 0.0% |
| Filipino | 831 | 0.1% |
| Finnish | 904 | 0.1% |
| French | 10,755 | 1.6% |
| French American Indian | 60 | 0.0% |
| French Canadian | 2,273 | 0.3% |
| German | 50,711 | 7.6% |
| German Russian | 24 | 0.0% |
| Ghanaian | 639 | 0.1% |
| Greek | 3,108 | 0.5% |
| Guamanian / Chamorro | 163 | 0.0% |
| Guatemalan | 3,397 | 0.5% |
| Guyanese | 718 | 0.1% |
| Haitian | 1,484 | 0.2% |
| Hmong | 3 | 0.0% |
| Honduran | 3,073 | 0.5% |
| Hungarian | 2,672 | 0.4% |
| Icelander | 269 | 0.0% |
| Indian (Asian) | 9,401 | 1.4% |
| Indonesian | 198 | 0.0% |
| Inupiat | 9 | 0.0% |
| Iranian | 2,439 | 0.4% |
| Iraqi | 432 | 0.1% |
| Irish | 49,862 | 7.4% |
| Iroquois | 36 | 0.0% |
| Israeli | 696 | 0.1% |
| Italian | 28,294 | 4.2% |
| Jamaican | 6,074 | 0.9% |
| Japanese | 208 | 0.0% |
| Jordanian | 73 | 0.0% |
| Kenyan | 553 | 0.1% |
| Korean | 3,831 | 0.6% |
| Laotian | 430 | 0.1% |
| Latvian | 540 | 0.1% |
| Lebanese | 1,934 | 0.3% |
| Liberian | 208 | 0.0% |
| Lithuanian | 2,487 | 0.4% |
| Lumbee | 39 | 0.0% |
| Luxembourger | 107 | 0.0% |
| Macedonian | 148 | 0.0% |
| Malaysian | 46 | 0.0% |
| Maltese | 135 | 0.0% |
| Mexican | 13,202 | 2.0% |
| Mexican American Indian | 709 | 0.1% |
| Mongolian | 80 | 0.0% |
| Moroccan | 564 | 0.1% |
| Native Hawaiian | 621 | 0.1% |
| Navajo | 103 | 0.0% |
| New Zealander | 162 | 0.0% |
| Nicaraguan | 1,138 | 0.2% |
| Nigerian | 4,069 | 0.6% |
| Northern European | 1,508 | 0.2% |
| Norwegian | 3,790 | 0.6% |
| Okinawan | 18 | 0.0% |
| Osage | 14 | 0.0% |
| Pakistani | 378 | 0.1% |
| Palestinian | 354 | 0.1% |
| Panamanian | 987 | 0.2% |
| Paraguayan | 293 | 0.0% |
| Pennsylvania German | 214 | 0.0% |
| Peruvian | 2,471 | 0.4% |
| Polish | 14,724 | 2.2% |
| Portuguese | 1,360 | 0.2% |
| Potawatomi | 7 | 0.0% |
| Pueblo | 57 | 0.0% |
| Puerto Rican | 6,020 | 0.9% |
| Romanian | 1,392 | 0.2% |
| Russian | 9,712 | 1.5% |
| Salvadoran | 17,364 | 2.6% |
| Samoan | 62 | 0.0% |
| Scandinavian | 1,083 | 0.2% |
| Scotch-Irish | 4,321 | 0.6% |
| Scottish | 9,510 | 1.4% |
| Seminole | 64 | 0.0% |
| Senegalese | 300 | 0.0% |
| Serbian | 438 | 0.1% |
| Sierra Leonean | 277 | 0.0% |
| Sioux | 8 | 0.0% |
| Slavic | 121 | 0.0% |
| Slovak | 1,273 | 0.2% |
| Slovene | 317 | 0.1% |
| Somali | 136 | 0.0% |
| South African | 439 | 0.1% |
| South American | 14,877 | 2.2% |
| South American Indian | 312 | 0.1% |
| Soviet Union | 15 | 0.0% |
| Spaniard | 4,116 | 0.6% |
| Spanish | 1,506 | 0.2% |
| Sri Lankan | 2,763 | 0.4% |
| Subsaharan African | 26,196 | 3.9% |
| Sudanese | 118 | 0.0% |
| Swedish | 5,839 | 0.9% |
| Swiss | 1,733 | 0.3% |
| Syrian | 599 | 0.1% |
| Taiwanese | 15 | 0.0% |
| Thai | 9,497 | 1.4% |
| Tlingit-Haida | 33 | 0.0% |
| Tongan | 23 | 0.0% |
| Trinidadian and Tobagonian | 2,117 | 0.3% |
| Turkish | 1,153 | 0.2% |
| U.S. Virgin Islander | 98 | 0.0% |
| Ugandan | 168 | 0.0% |
| Ukrainian | 3,348 | 0.5% |
| Uruguayan | 492 | 0.1% |
| Venezuelan | 1,649 | 0.3% |
| Vietnamese | 516 | 0.1% |
| Welsh | 3,030 | 0.4% |
| West Indian | 1,501 | 0.2% |
| Yaqui | 19 | 0.0% |
| Yugoslavian | 162 | 0.0% |
| Zimbabwean | 62 | 0.0% | View All 176 Rows |
Immigrants in District Of Columbia
The most numerous immigrant groups reported in District Of Columbia came from Latin America (37,323 | 5.6%), Asia (19,290 | 2.9%), Central America (19,006 | 2.8%), Africa (15,742 | 2.4%), and Europe (14,780 | 2.2%), together accounting for 15.8% of all District Of Columbia residents.
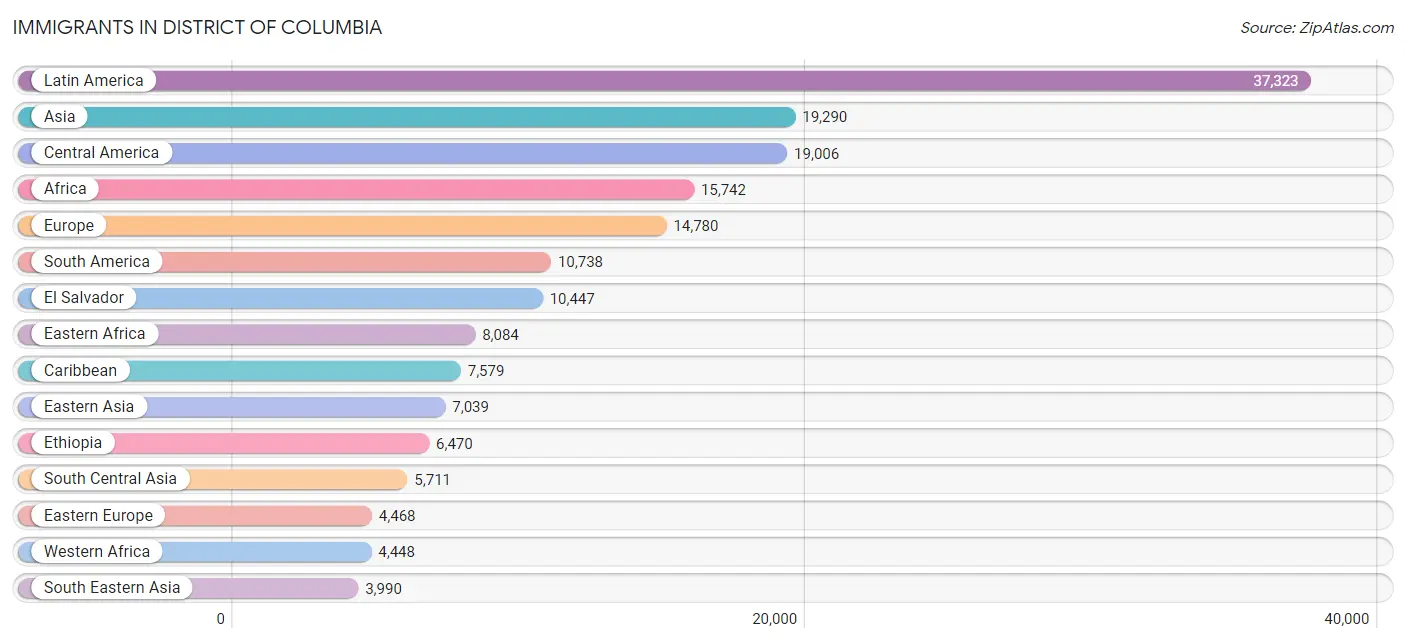
| Immigration Origin | # Population | % Population |
| Afghanistan | 92 | 0.0% |
| Africa | 15,742 | 2.4% |
| Albania | 258 | 0.0% |
| Argentina | 1,026 | 0.2% |
| Armenia | 139 | 0.0% |
| Asia | 19,290 | 2.9% |
| Australia | 603 | 0.1% |
| Austria | 52 | 0.0% |
| Bahamas | 44 | 0.0% |
| Bangladesh | 381 | 0.1% |
| Barbados | 58 | 0.0% |
| Belarus | 162 | 0.0% |
| Belgium | 264 | 0.0% |
| Belize | 49 | 0.0% |
| Bolivia | 461 | 0.1% |
| Brazil | 1,324 | 0.2% |
| Bulgaria | 411 | 0.1% |
| Cabo Verde | 2 | 0.0% |
| Cambodia | 53 | 0.0% |
| Cameroon | 959 | 0.1% |
| Canada | 2,077 | 0.3% |
| Caribbean | 7,579 | 1.1% |
| Central America | 19,006 | 2.8% |
| Chile | 640 | 0.1% |
| China | 3,974 | 0.6% |
| Colombia | 2,899 | 0.4% |
| Congo | 15 | 0.0% |
| Costa Rica | 458 | 0.1% |
| Croatia | 88 | 0.0% |
| Cuba | 635 | 0.1% |
| Czechoslovakia | 205 | 0.0% |
| Denmark | 27 | 0.0% |
| Dominica | 125 | 0.0% |
| Dominican Republic | 2,028 | 0.3% |
| Eastern Africa | 8,084 | 1.2% |
| Eastern Asia | 7,039 | 1.1% |
| Eastern Europe | 4,468 | 0.7% |
| Ecuador | 540 | 0.1% |
| Egypt | 258 | 0.0% |
| El Salvador | 10,447 | 1.6% |
| England | 762 | 0.1% |
| Eritrea | 299 | 0.0% |
| Ethiopia | 6,470 | 1.0% |
| Europe | 14,780 | 2.2% |
| France | 1,612 | 0.2% |
| Germany | 1,465 | 0.2% |
| Ghana | 547 | 0.1% |
| Greece | 281 | 0.0% |
| Grenada | 110 | 0.0% |
| Guatemala | 1,852 | 0.3% |
| Guyana | 556 | 0.1% |
| Haiti | 305 | 0.1% |
| Honduras | 1,685 | 0.3% |
| Hong Kong | 376 | 0.1% |
| Hungary | 134 | 0.0% |
| India | 3,088 | 0.5% |
| Indonesia | 297 | 0.0% |
| Iran | 1,199 | 0.2% |
| Iraq | 176 | 0.0% |
| Ireland | 302 | 0.1% |
| Israel | 402 | 0.1% |
| Italy | 876 | 0.1% |
| Jamaica | 2,468 | 0.4% |
| Japan | 953 | 0.1% |
| Jordan | 42 | 0.0% |
| Kazakhstan | 152 | 0.0% |
| Kenya | 515 | 0.1% |
| Korea | 2,083 | 0.3% |
| Kuwait | 59 | 0.0% |
| Laos | 10 | 0.0% |
| Latin America | 37,323 | 5.6% |
| Latvia | 115 | 0.0% |
| Lebanon | 329 | 0.1% |
| Liberia | 156 | 0.0% |
| Lithuania | 152 | 0.0% |
| Malaysia | 130 | 0.0% |
| Mexico | 3,373 | 0.5% |
| Middle Africa | 1,430 | 0.2% |
| Moldova | 12 | 0.0% |
| Morocco | 443 | 0.1% |
| Nepal | 232 | 0.0% |
| Netherlands | 290 | 0.0% |
| Nicaragua | 699 | 0.1% |
| Nigeria | 2,332 | 0.4% |
| Northern Africa | 985 | 0.2% |
| Northern Europe | 3,527 | 0.5% |
| Norway | 111 | 0.0% |
| Oceania | 795 | 0.1% |
| Pakistan | 413 | 0.1% |
| Panama | 443 | 0.1% |
| Peru | 1,377 | 0.2% |
| Philippines | 1,508 | 0.2% |
| Poland | 292 | 0.0% |
| Portugal | 112 | 0.0% |
| Romania | 361 | 0.1% |
| Russia | 1,075 | 0.2% |
| Saudi Arabia | 215 | 0.0% |
| Scotland | 37 | 0.0% |
| Senegal | 291 | 0.0% |
| Serbia | 225 | 0.0% |
| Sierra Leone | 291 | 0.0% |
| Singapore | 151 | 0.0% |
| Somalia | 37 | 0.0% |
| South Africa | 492 | 0.1% |
| South America | 10,738 | 1.6% |
| South Central Asia | 5,711 | 0.9% |
| South Eastern Asia | 3,990 | 0.6% |
| Southern Europe | 2,901 | 0.4% |
| Spain | 1,632 | 0.2% |
| Sri Lanka | 77 | 0.0% |
| St. Vincent and the Grenadines | 115 | 0.0% |
| Sudan | 91 | 0.0% |
| Sweden | 405 | 0.1% |
| Switzerland | 188 | 0.0% |
| Syria | 223 | 0.0% |
| Taiwan | 334 | 0.1% |
| Thailand | 159 | 0.0% |
| Trinidad and Tobago | 1,494 | 0.2% |
| Turkey | 378 | 0.1% |
| Uganda | 155 | 0.0% |
| Ukraine | 438 | 0.1% |
| Uruguay | 454 | 0.1% |
| Uzbekistan | 77 | 0.0% |
| Venezuela | 1,166 | 0.2% |
| Vietnam | 1,503 | 0.2% |
| West Indies | 37 | 0.0% |
| Western Africa | 4,448 | 0.7% |
| Western Asia | 2,546 | 0.4% |
| Western Europe | 3,871 | 0.6% |
| Zaire | 347 | 0.1% |
| Zimbabwe | 51 | 0.0% | View All 131 Rows |
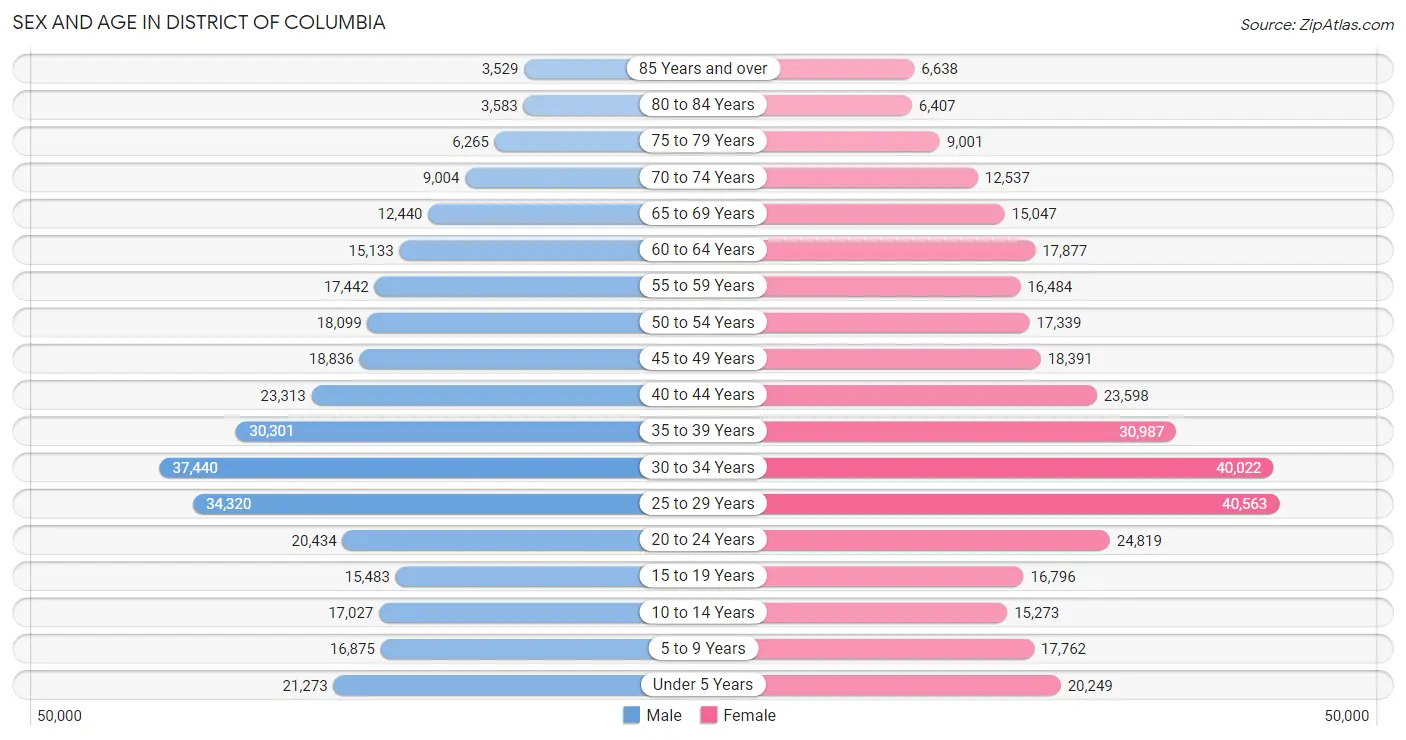
Sex and Age in District Of Columbia
Sex and Age in District Of Columbia
The most populous age groups in District Of Columbia are 30 to 34 Years (37,440 | 11.7%) for men and 25 to 29 Years (40,563 | 11.6%) for women.
| Age Bracket | Male | Female |
| Under 5 Years | 21,273 (6.6%) | 20,249 (5.8%) |
| 5 to 9 Years | 16,875 (5.3%) | 17,762 (5.1%) |
| 10 to 14 Years | 17,027 (5.3%) | 15,273 (4.4%) |
| 15 to 19 Years | 15,483 (4.8%) | 16,796 (4.8%) |
| 20 to 24 Years | 20,434 (6.4%) | 24,819 (7.1%) |
| 25 to 29 Years | 34,320 (10.7%) | 40,563 (11.6%) |
| 30 to 34 Years | 37,440 (11.7%) | 40,022 (11.4%) |
| 35 to 39 Years | 30,301 (9.5%) | 30,987 (8.9%) |
| 40 to 44 Years | 23,313 (7.3%) | 23,598 (6.8%) |
| 45 to 49 Years | 18,836 (5.9%) | 18,391 (5.3%) |
| 50 to 54 Years | 18,099 (5.6%) | 17,339 (5.0%) |
| 55 to 59 Years | 17,442 (5.4%) | 16,484 (4.7%) |
| 60 to 64 Years | 15,133 (4.7%) | 17,877 (5.1%) |
| 65 to 69 Years | 12,440 (3.9%) | 15,047 (4.3%) |
| 70 to 74 Years | 9,004 (2.8%) | 12,537 (3.6%) |
| 75 to 79 Years | 6,265 (1.9%) | 9,001 (2.6%) |
| 80 to 84 Years | 3,583 (1.1%) | 6,407 (1.8%) |
| 85 Years and over | 3,529 (1.1%) | 6,638 (1.9%) |
| Total | 320,797 (100.0%) | 349,790 (100.0%) |
Families and Households in District Of Columbia
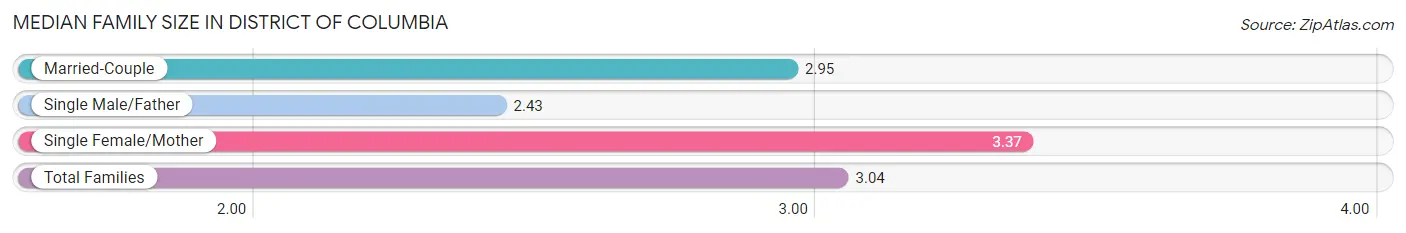
Median Family Size in District Of Columbia
The median family size in District Of Columbia is 3.04 persons per family, with single female/mother families (40,342 | 30.9%) accounting for the largest median family size of 3.37 persons per family. On the other hand, single male/father families (10,227 | 7.8%) represent the smallest median family size with 2.43 persons per family.
| Family Type | # Families | Family Size |
| Married-Couple | 79,884 (61.2%) | 2.95 |
| Single Male/Father | 10,227 (7.8%) | 2.43 |
| Single Female/Mother | 40,342 (30.9%) | 3.37 |
| Total Families | 130,453 (100.0%) | 3.04 |
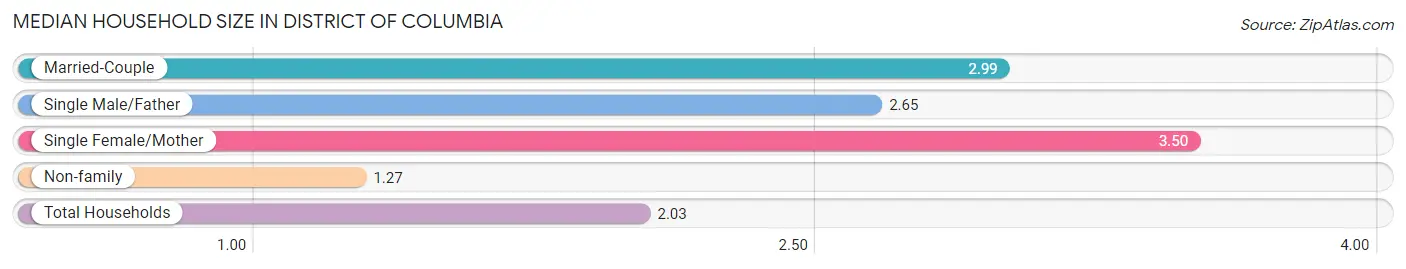
Median Household Size in District Of Columbia
The median household size in District Of Columbia is 2.03 persons per household, with single female/mother households (40,342 | 12.8%) accounting for the largest median household size of 3.5 persons per household. non-family households (185,332 | 58.7%) represent the smallest median household size with 1.27 persons per household.
| Household Type | # Households | Household Size |
| Married-Couple | 79,884 (25.3%) | 2.99 |
| Single Male/Father | 10,227 (3.2%) | 2.65 |
| Single Female/Mother | 40,342 (12.8%) | 3.50 |
| Non-family | 185,332 (58.7%) | 1.27 |
| Total Households | 315,785 (100.0%) | 2.03 |
Household Size by Marriage Status in District Of Columbia
Out of a total of 315,785 households in District Of Columbia, 130,453 (41.3%) are family households, while 185,332 (58.7%) are nonfamily households. The most numerous type of family households are 2-person households, comprising 64,147, and the most common type of nonfamily households are 1-person households, comprising 146,319.
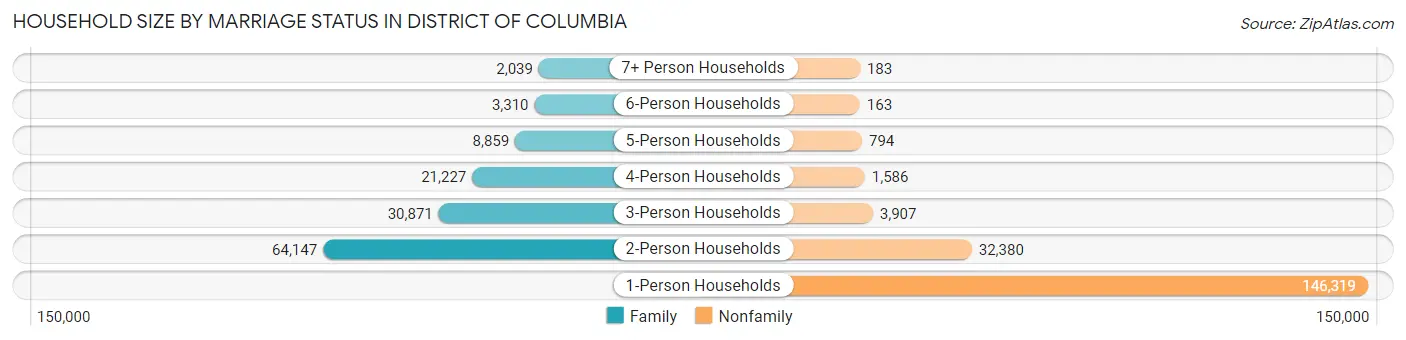
| Household Size | Family Households | Nonfamily Households |
| 1-Person Households | - | 146,319 (46.3%) |
| 2-Person Households | 64,147 (20.3%) | 32,380 (10.2%) |
| 3-Person Households | 30,871 (9.8%) | 3,907 (1.2%) |
| 4-Person Households | 21,227 (6.7%) | 1,586 (0.5%) |
| 5-Person Households | 8,859 (2.8%) | 794 (0.3%) |
| 6-Person Households | 3,310 (1.1%) | 163 (0.1%) |
| 7+ Person Households | 2,039 (0.6%) | 183 (0.1%) |
| Total | 130,453 (41.3%) | 185,332 (58.7%) |
Female Fertility in District Of Columbia
Fertility by Age in District Of Columbia
Average fertility rate in District Of Columbia is 42.0 births per 1,000 women. Women in the age bracket of 20 to 34 years have the highest fertility rate with 47.0 births per 1,000 women. Women in the age bracket of 20 to 34 years acount for 59.2% of all women with births.
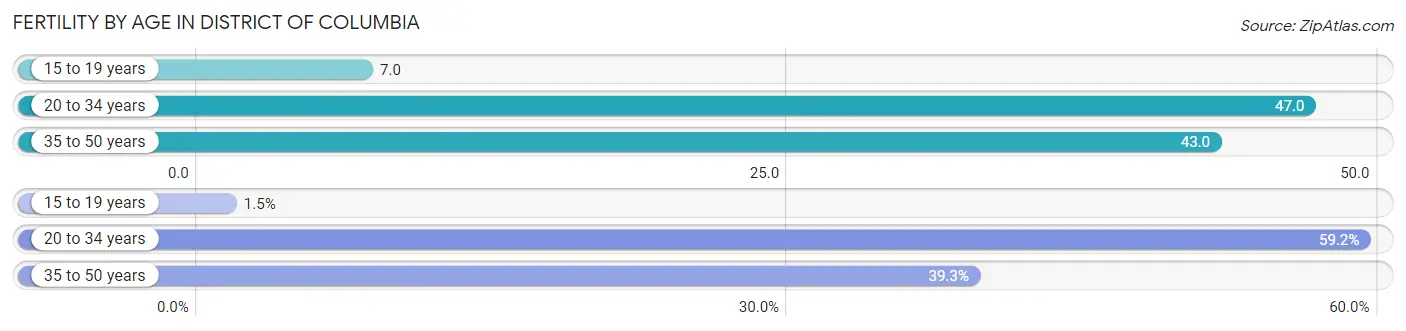
| Age Bracket | Women with Births | Births / 1,000 Women |
| 15 to 19 years | 123 (1.5%) | 7.0 |
| 20 to 34 years | 4,937 (59.2%) | 47.0 |
| 35 to 50 years | 3,279 (39.3%) | 43.0 |
| Total | 8,339 (100.0%) | 42.0 |
Fertility by Age by Marriage Status in District Of Columbia
56.6% of women with births (8,339) in District Of Columbia are married. The highest percentage of unmarried women with births falls into 15 to 19 years age bracket with 100.0% of them unmarried at the time of birth, while the lowest percentage of unmarried women with births belong to 35 to 50 years age bracket with 25.2% of them unmarried.
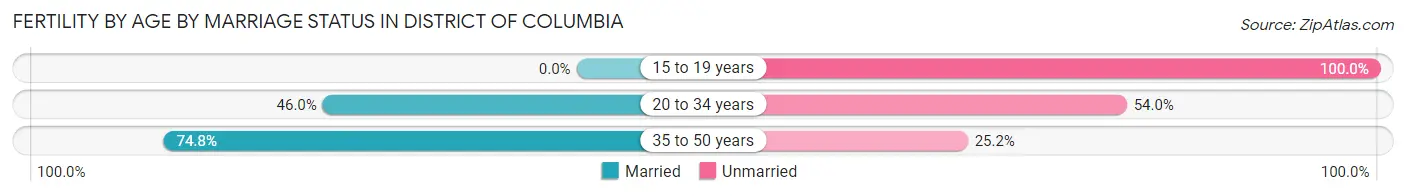
| Age Bracket | Married | Unmarried |
| 15 to 19 years | 0 (0.0%) | 123 (100.0%) |
| 20 to 34 years | 2,271 (46.0%) | 2,666 (54.0%) |
| 35 to 50 years | 2,453 (74.8%) | 826 (25.2%) |
| Total | 4,720 (56.6%) | 3,619 (43.4%) |
Fertility by Education in District Of Columbia
Average fertility rate in District Of Columbia is 42.0 births per 1,000 women. Women with the education attainment of less than high school have the highest fertility rate of 56.0 births per 1,000 women, while women with the education attainment of bachelor's degree have the lowest fertility at 32.0 births per 1,000 women. Women with the education attainment of graduate degree represent 32.9% of all women with births.
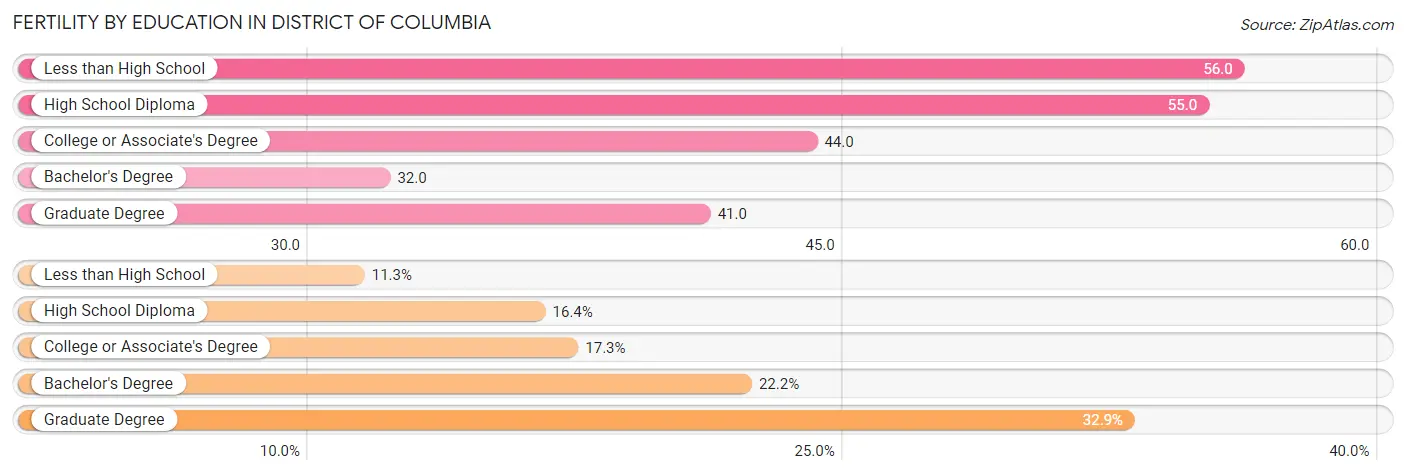
| Educational Attainment | Women with Births | Births / 1,000 Women |
| Less than High School | 941 (11.3%) | 56.0 |
| High School Diploma | 1,364 (16.4%) | 55.0 |
| College or Associate's Degree | 1,441 (17.3%) | 44.0 |
| Bachelor's Degree | 1,848 (22.2%) | 32.0 |
| Graduate Degree | 2,745 (32.9%) | 41.0 |
| Total | 8,339 (100.0%) | 42.0 |
Fertility by Education by Marriage Status in District Of Columbia
43.4% of women with births in District Of Columbia are unmarried. Women with the educational attainment of graduate degree are most likely to be married with 95.8% of them married at childbirth, while women with the educational attainment of less than high school are least likely to be married with 82.9% of them unmarried at childbirth.
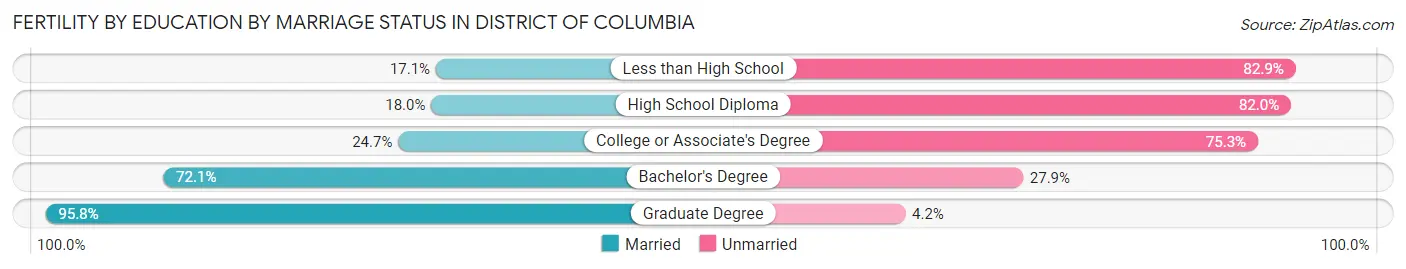
| Educational Attainment | Married | Unmarried |
| Less than High School | 161 (17.1%) | 780 (82.9%) |
| High School Diploma | 246 (18.0%) | 1,118 (82.0%) |
| College or Associate's Degree | 356 (24.7%) | 1,085 (75.3%) |
| Bachelor's Degree | 1,332 (72.1%) | 516 (27.9%) |
| Graduate Degree | 2,630 (95.8%) | 115 (4.2%) |
| Total | 4,720 (56.6%) | 3,619 (43.4%) |
Employment Characteristics in District Of Columbia
Employment by Class of Employer in District Of Columbia
Among the 366,965 employed individuals in District Of Columbia, private company employees (171,653 | 46.8%), not-for-profit organizations (71,618 | 19.5%), and federal government employees (69,582 | 19.0%) make up the most common classes of employment.
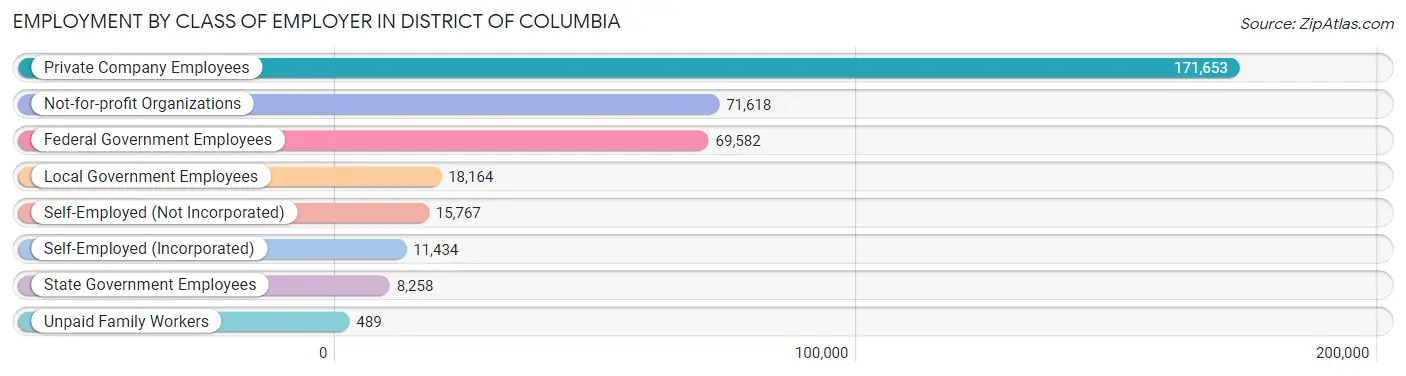
| Employer Class | # Employees | % Employees |
| Private Company Employees | 171,653 | 46.8% |
| Self-Employed (Incorporated) | 11,434 | 3.1% |
| Self-Employed (Not Incorporated) | 15,767 | 4.3% |
| Not-for-profit Organizations | 71,618 | 19.5% |
| Local Government Employees | 18,164 | 5.0% |
| State Government Employees | 8,258 | 2.2% |
| Federal Government Employees | 69,582 | 19.0% |
| Unpaid Family Workers | 489 | 0.1% |
| Total | 366,965 | 100.0% |
Employment Status by Age in District Of Columbia
According to the labor force statistics for District Of Columbia, out of the total population over 16 years of age (556,781), 72.0% or 400,882 individuals are in the labor force, with 7.1% or 28,463 of them unemployed. The age group with the highest labor force participation rate is 30 to 34 years, with 91.1% or 70,568 individuals in the labor force. Within the labor force, the 16 to 19 years age range has the highest percentage of unemployed individuals, with 30.6% or 2,382 of them being unemployed.
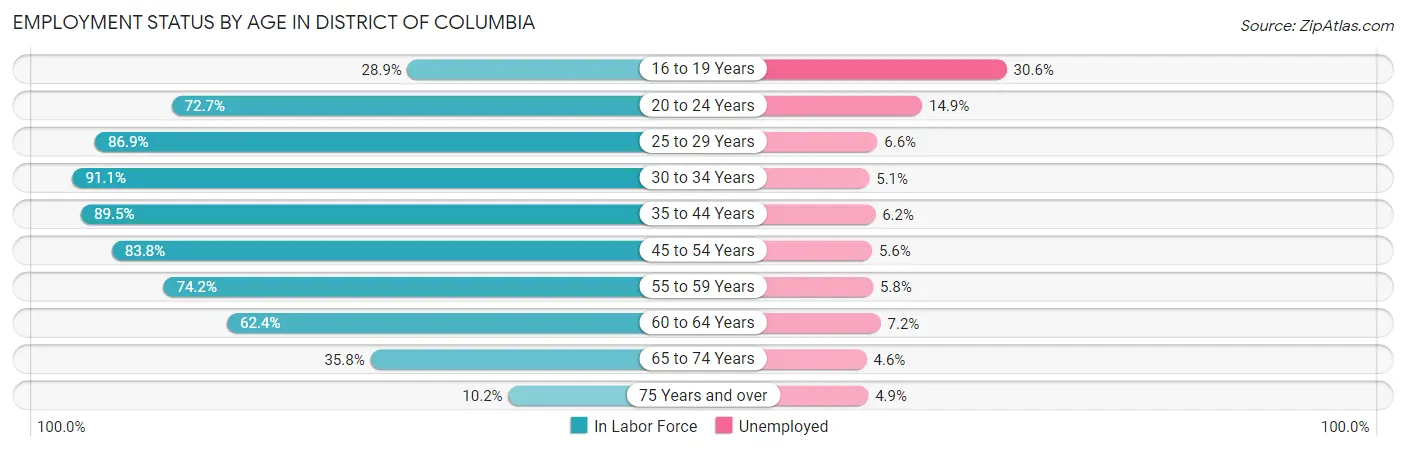
| Age Bracket | In Labor Force | Unemployed |
| 16 to 19 Years | 7,783 (28.9%) | 2,382 (30.6%) |
| 20 to 24 Years | 32,899 (72.7%) | 4,902 (14.9%) |
| 25 to 29 Years | 65,073 (86.9%) | 4,295 (6.6%) |
| 30 to 34 Years | 70,568 (91.1%) | 3,599 (5.1%) |
| 35 to 44 Years | 96,838 (89.5%) | 6,004 (6.2%) |
| 45 to 54 Years | 60,893 (83.8%) | 3,410 (5.6%) |
| 55 to 59 Years | 25,173 (74.2%) | 1,460 (5.8%) |
| 60 to 64 Years | 20,598 (62.4%) | 1,483 (7.2%) |
| 65 to 74 Years | 17,552 (35.8%) | 807 (4.6%) |
| 75 Years and over | 3,613 (10.2%) | 177 (4.9%) |
| Total | 400,882 (72.0%) | 28,463 (7.1%) |
Employment Status by Educational Attainment in District Of Columbia
According to labor force statistics for District Of Columbia, 84.7% of individuals (338,923) out of the total population between 25 and 64 years of age (400,145) are in the labor force, with 6.0% or 20,335 of them being unemployed. The group with the highest labor force participation rate are those with the educational attainment of bachelor's degree or higher, with 92.7% or 243,065 individuals in the labor force. Within the labor force, individuals with less than high school education have the highest percentage of unemployment, with 23.0% or 3,141 of them being unemployed.
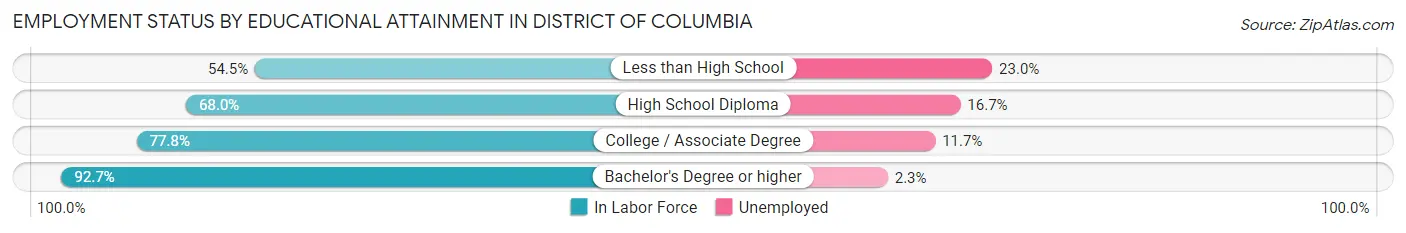
| Educational Attainment | In Labor Force | Unemployed |
| Less than High School | 13,657 (54.5%) | 5,764 (23.0%) |
| High School Diploma | 37,541 (68.0%) | 9,220 (16.7%) |
| College / Associate Degree | 44,870 (77.8%) | 6,748 (11.7%) |
| Bachelor's Degree or higher | 243,065 (92.7%) | 6,031 (2.3%) |
| Total | 338,923 (84.7%) | 24,009 (6.0%) |
Employment Occupations by Sex in District Of Columbia
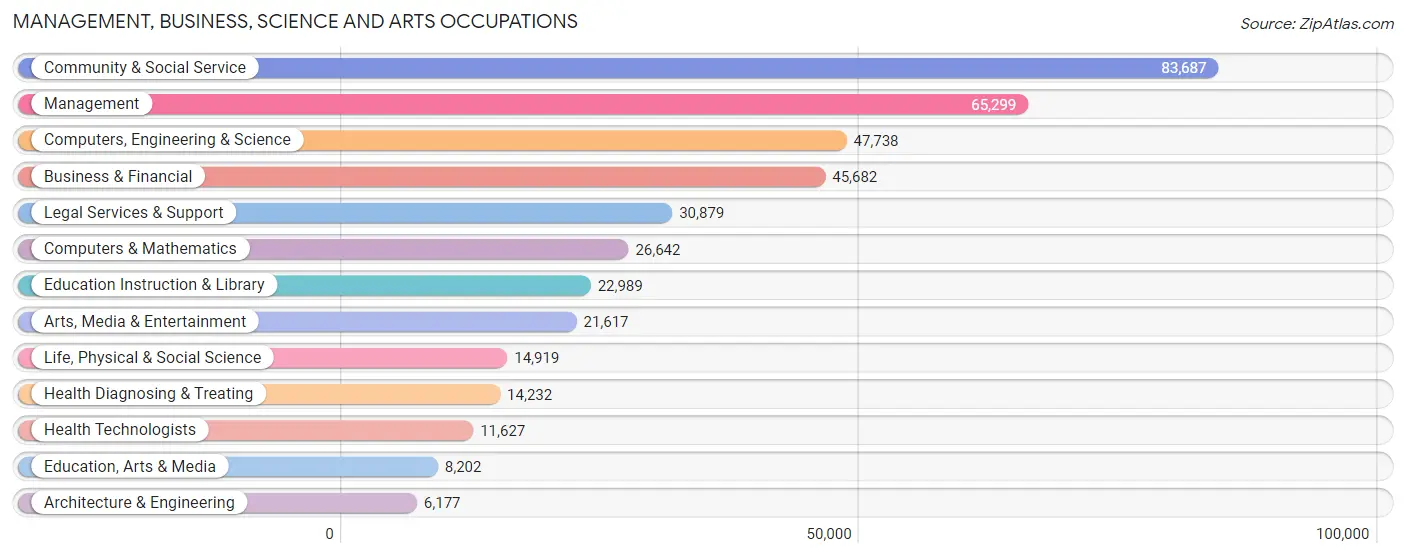
Management, Business, Science and Arts Occupations
The most common Management, Business, Science and Arts occupations in District Of Columbia are Community & Social Service (83,687 | 22.7%), Management (65,299 | 17.7%), Computers, Engineering & Science (47,738 | 12.9%), Business & Financial (45,682 | 12.4%), and Legal Services & Support (30,879 | 8.4%).
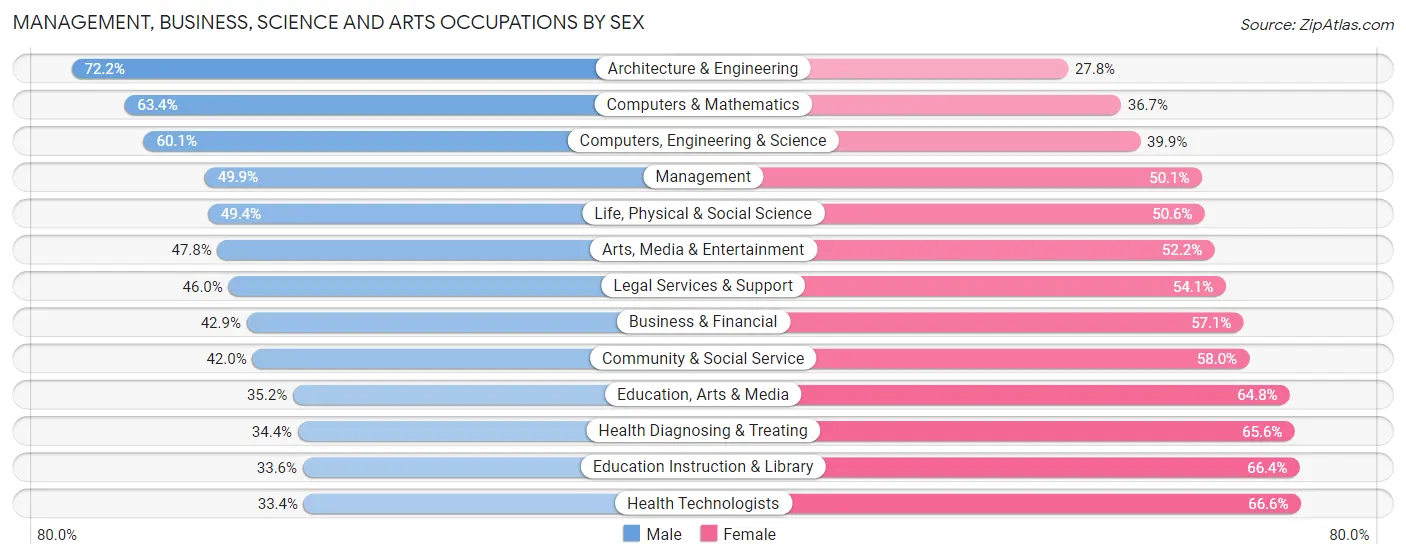
Management, Business, Science and Arts Occupations by Sex
Within the Management, Business, Science and Arts occupations in District Of Columbia, the most male-oriented occupations are Architecture & Engineering (72.2%), Computers & Mathematics (63.3%), and Computers, Engineering & Science (60.1%), while the most female-oriented occupations are Health Technologists (66.6%), Education Instruction & Library (66.4%), and Health Diagnosing & Treating (65.6%).
| Occupation | Male | Female |
| Management | 32,600 (49.9%) | 32,699 (50.1%) |
| Business & Financial | 19,611 (42.9%) | 26,071 (57.1%) |
| Computers, Engineering & Science | 28,707 (60.1%) | 19,031 (39.9%) |
| Computers & Mathematics | 16,878 (63.3%) | 9,764 (36.6%) |
| Architecture & Engineering | 4,458 (72.2%) | 1,719 (27.8%) |
| Life, Physical & Social Science | 7,371 (49.4%) | 7,548 (50.6%) |
| Community & Social Service | 35,125 (42.0%) | 48,562 (58.0%) |
| Education, Arts & Media | 2,888 (35.2%) | 5,314 (64.8%) |
| Legal Services & Support | 14,189 (46.0%) | 16,690 (54.0%) |
| Education Instruction & Library | 7,716 (33.6%) | 15,273 (66.4%) |
| Arts, Media & Entertainment | 10,332 (47.8%) | 11,285 (52.2%) |
| Health Diagnosing & Treating | 4,895 (34.4%) | 9,337 (65.6%) |
| Health Technologists | 3,883 (33.4%) | 7,744 (66.6%) |
| Total (Category) | 120,938 (47.1%) | 135,700 (52.9%) |
| Total (Overall) | 178,439 (48.3%) | 190,959 (51.7%) |
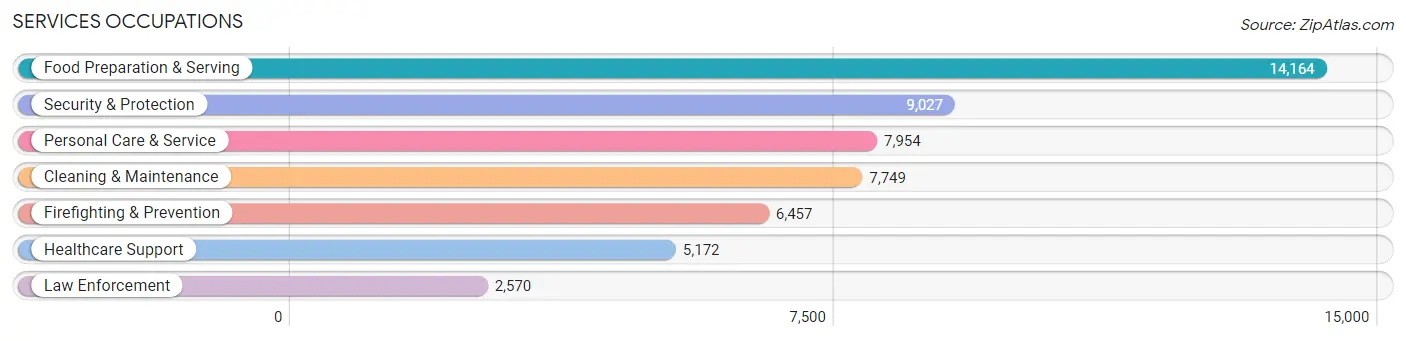
Services Occupations
The most common Services occupations in District Of Columbia are Food Preparation & Serving (14,164 | 3.8%), Security & Protection (9,027 | 2.4%), Personal Care & Service (7,954 | 2.1%), Cleaning & Maintenance (7,749 | 2.1%), and Firefighting & Prevention (6,457 | 1.8%).
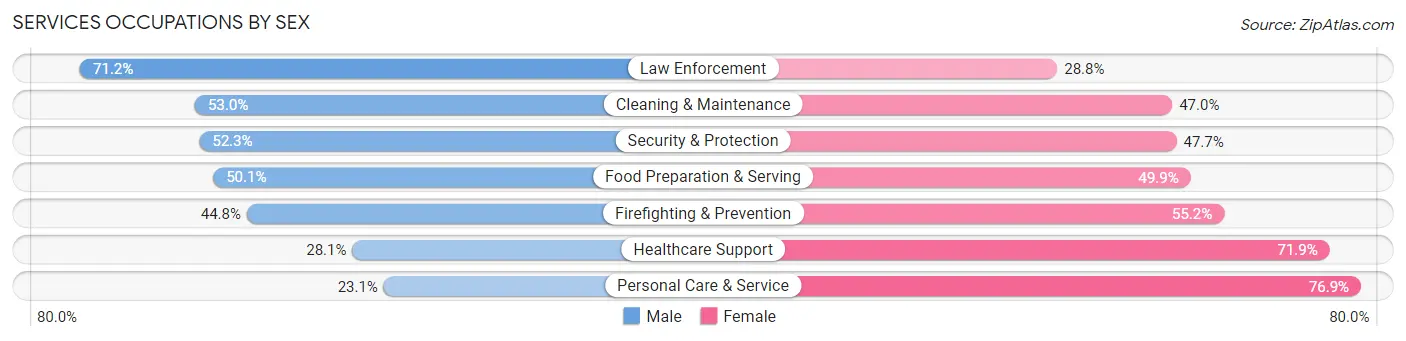
Services Occupations by Sex
Within the Services occupations in District Of Columbia, the most male-oriented occupations are Law Enforcement (71.2%), Cleaning & Maintenance (53.0%), and Security & Protection (52.3%), while the most female-oriented occupations are Personal Care & Service (76.9%), Healthcare Support (71.9%), and Firefighting & Prevention (55.2%).
| Occupation | Male | Female |
| Healthcare Support | 1,453 (28.1%) | 3,719 (71.9%) |
| Security & Protection | 4,723 (52.3%) | 4,304 (47.7%) |
| Firefighting & Prevention | 2,893 (44.8%) | 3,564 (55.2%) |
| Law Enforcement | 1,830 (71.2%) | 740 (28.8%) |
| Food Preparation & Serving | 7,098 (50.1%) | 7,066 (49.9%) |
| Cleaning & Maintenance | 4,107 (53.0%) | 3,642 (47.0%) |
| Personal Care & Service | 1,838 (23.1%) | 6,116 (76.9%) |
| Total (Category) | 19,219 (43.6%) | 24,847 (56.4%) |
| Total (Overall) | 178,439 (48.3%) | 190,959 (51.7%) |
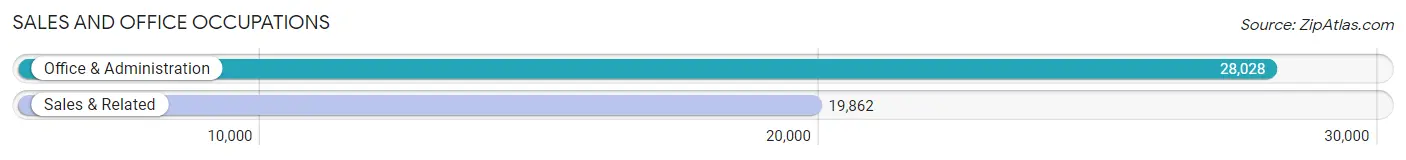
Sales and Office Occupations
The most common Sales and Office occupations in District Of Columbia are Office & Administration (28,028 | 7.6%), and Sales & Related (19,862 | 5.4%).
Sales and Office Occupations by Sex
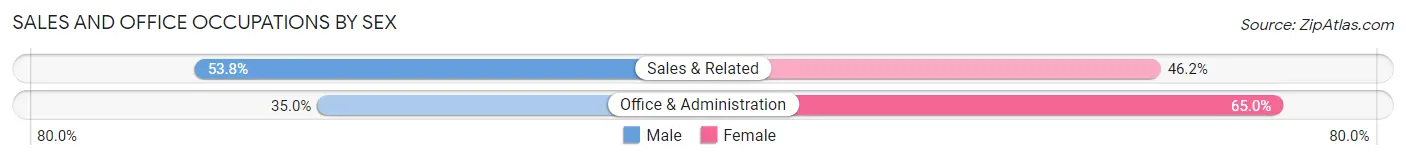
| Occupation | Male | Female |
| Sales & Related | 10,689 (53.8%) | 9,173 (46.2%) |
| Office & Administration | 9,807 (35.0%) | 18,221 (65.0%) |
| Total (Category) | 20,496 (42.8%) | 27,394 (57.2%) |
| Total (Overall) | 178,439 (48.3%) | 190,959 (51.7%) |
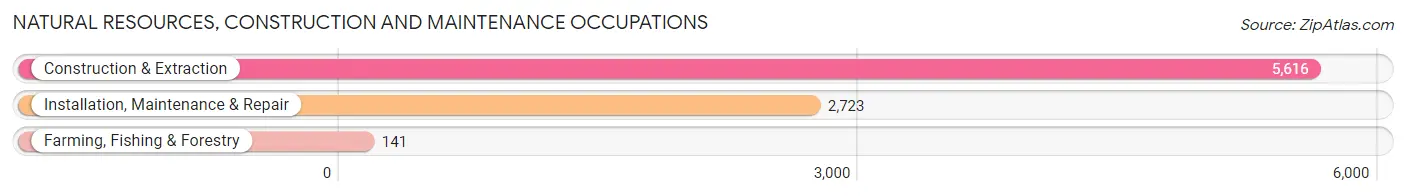
Natural Resources, Construction and Maintenance Occupations
The most common Natural Resources, Construction and Maintenance occupations in District Of Columbia are Construction & Extraction (5,616 | 1.5%), Installation, Maintenance & Repair (2,723 | 0.7%), and Farming, Fishing & Forestry (141 | 0.0%).
Natural Resources, Construction and Maintenance Occupations by Sex
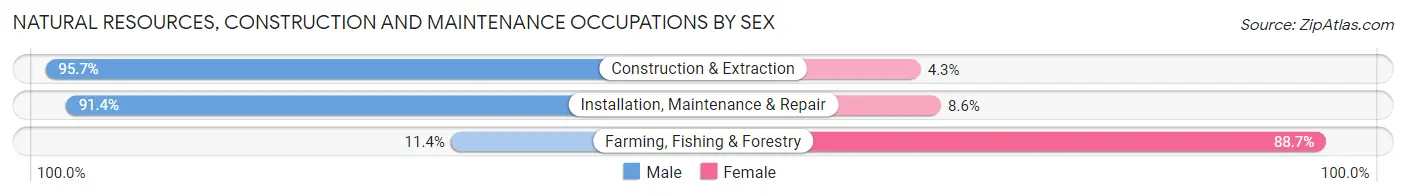
| Occupation | Male | Female |
| Farming, Fishing & Forestry | 16 (11.4%) | 125 (88.6%) |
| Construction & Extraction | 5,372 (95.7%) | 244 (4.3%) |
| Installation, Maintenance & Repair | 2,490 (91.4%) | 233 (8.6%) |
| Total (Category) | 7,878 (92.9%) | 602 (7.1%) |
| Total (Overall) | 178,439 (48.3%) | 190,959 (51.7%) |
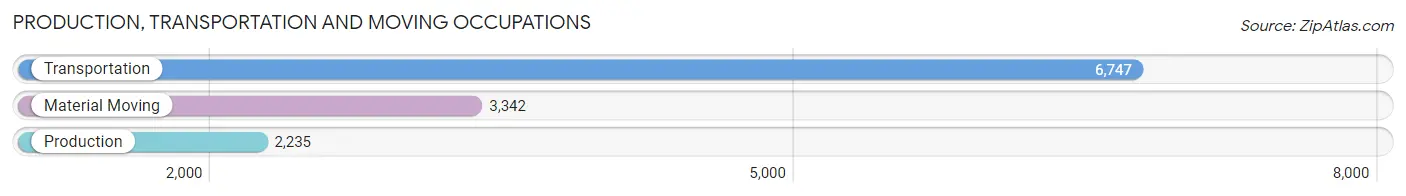
Production, Transportation and Moving Occupations
The most common Production, Transportation and Moving occupations in District Of Columbia are Transportation (6,747 | 1.8%), Material Moving (3,342 | 0.9%), and Production (2,235 | 0.6%).
Production, Transportation and Moving Occupations by Sex
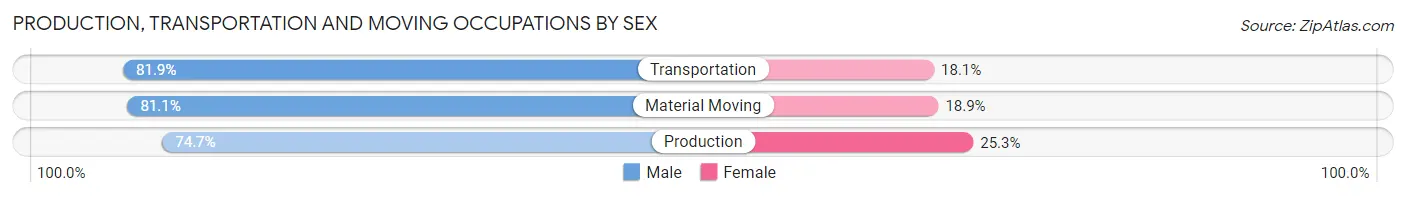
| Occupation | Male | Female |
| Production | 1,670 (74.7%) | 565 (25.3%) |
| Transportation | 5,527 (81.9%) | 1,220 (18.1%) |
| Material Moving | 2,711 (81.1%) | 631 (18.9%) |
| Total (Category) | 9,908 (80.4%) | 2,416 (19.6%) |
| Total (Overall) | 178,439 (48.3%) | 190,959 (51.7%) |
Employment Industries by Sex in District Of Columbia
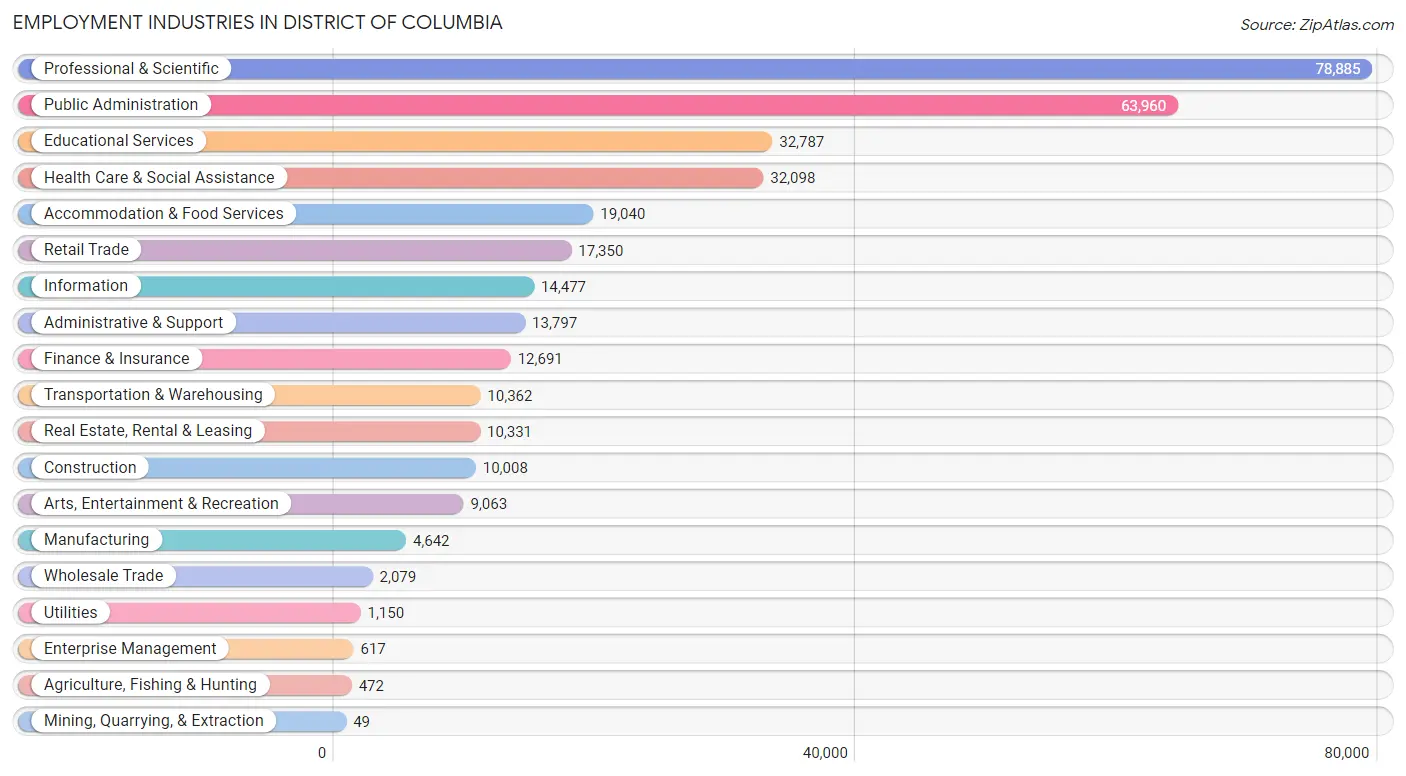
Employment Industries in District Of Columbia
The major employment industries in District Of Columbia include Professional & Scientific (78,885 | 21.4%), Public Administration (63,960 | 17.3%), Educational Services (32,787 | 8.9%), Health Care & Social Assistance (32,098 | 8.7%), and Accommodation & Food Services (19,040 | 5.1%).
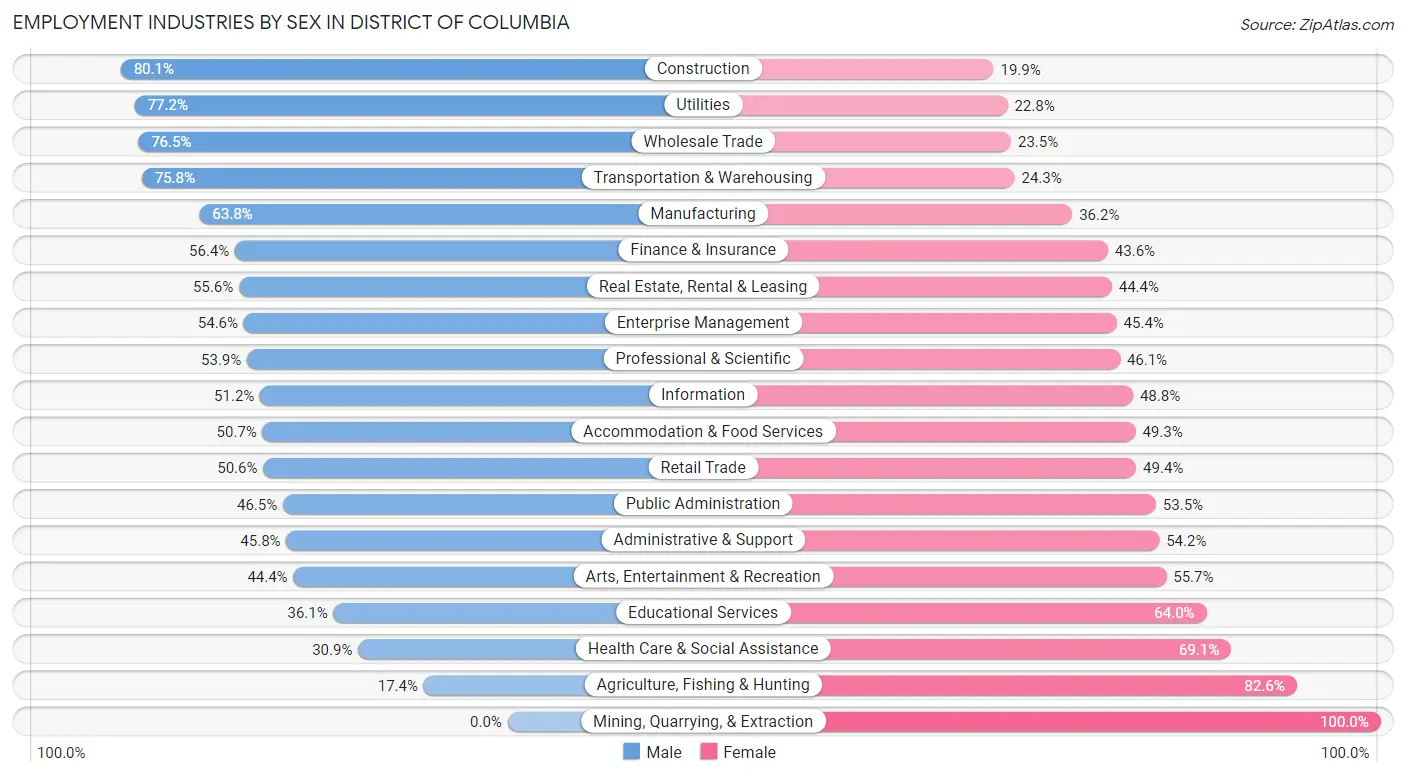
Employment Industries by Sex in District Of Columbia
The District Of Columbia industries that see more men than women are Construction (80.1%), Utilities (77.2%), and Wholesale Trade (76.5%), whereas the industries that tend to have a higher number of women are Mining, Quarrying, & Extraction (100.0%), Agriculture, Fishing & Hunting (82.6%), and Health Care & Social Assistance (69.1%).
| Industry | Male | Female |
| Agriculture, Fishing & Hunting | 82 (17.4%) | 390 (82.6%) |
| Mining, Quarrying, & Extraction | 0 (0.0%) | 49 (100.0%) |
| Construction | 8,016 (80.1%) | 1,992 (19.9%) |
| Manufacturing | 2,962 (63.8%) | 1,680 (36.2%) |
| Wholesale Trade | 1,590 (76.5%) | 489 (23.5%) |
| Retail Trade | 8,778 (50.6%) | 8,572 (49.4%) |
| Transportation & Warehousing | 7,849 (75.7%) | 2,513 (24.2%) |
| Utilities | 888 (77.2%) | 262 (22.8%) |
| Information | 7,418 (51.2%) | 7,059 (48.8%) |
| Finance & Insurance | 7,161 (56.4%) | 5,530 (43.6%) |
| Real Estate, Rental & Leasing | 5,747 (55.6%) | 4,584 (44.4%) |
| Professional & Scientific | 42,552 (53.9%) | 36,333 (46.1%) |
| Enterprise Management | 337 (54.6%) | 280 (45.4%) |
| Administrative & Support | 6,321 (45.8%) | 7,476 (54.2%) |
| Educational Services | 11,821 (36.0%) | 20,966 (63.9%) |
| Health Care & Social Assistance | 9,931 (30.9%) | 22,167 (69.1%) |
| Arts, Entertainment & Recreation | 4,019 (44.4%) | 5,044 (55.6%) |
| Accommodation & Food Services | 9,658 (50.7%) | 9,382 (49.3%) |
| Public Administration | 29,739 (46.5%) | 34,221 (53.5%) |
| Total | 178,439 (48.3%) | 190,959 (51.7%) |
Education in District Of Columbia
School Enrollment in District Of Columbia
The most common levels of schooling among the 156,326 students in District Of Columbia are college / undergraduate (35,568 | 22.8%), elementary school (27,222 | 17.4%), and middle school (24,556 | 15.7%).
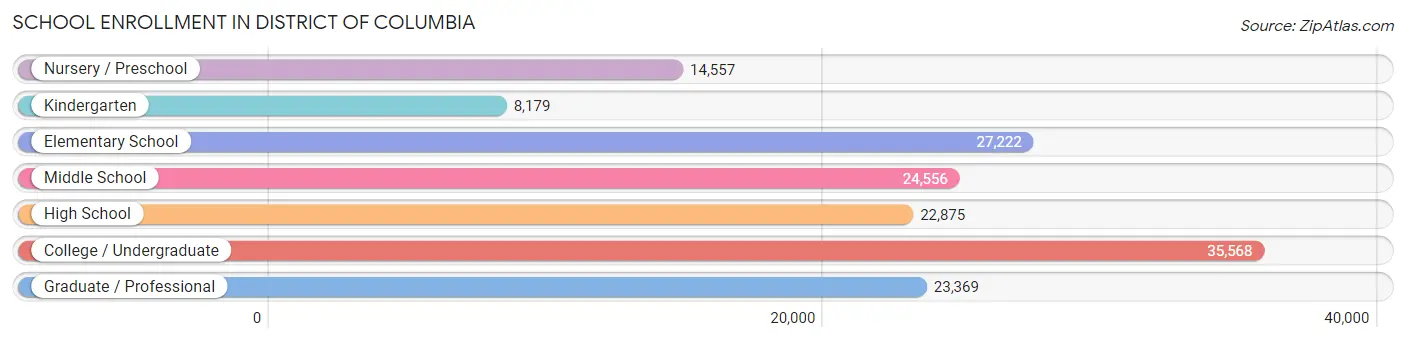
| School Level | # Students | % Students |
| Nursery / Preschool | 14,557 | 9.3% |
| Kindergarten | 8,179 | 5.2% |
| Elementary School | 27,222 | 17.4% |
| Middle School | 24,556 | 15.7% |
| High School | 22,875 | 14.6% |
| College / Undergraduate | 35,568 | 22.8% |
| Graduate / Professional | 23,369 | 14.9% |
| Total | 156,326 | 100.0% |
School Enrollment by Age by Funding Source in District Of Columbia
Out of a total of 156,326 students who are enrolled in schools in District Of Columbia, 56,746 (36.3%) attend a private institution, while the remaining 99,580 (63.7%) are enrolled in public schools. The age group of 20 to 24 year olds has the highest likelihood of being enrolled in private schools, with 14,069 (76.1% in the age bracket) enrolled. Conversely, the age group of 5 to 9 year old has the lowest likelihood of being enrolled in a private school, with 29,084 (87.3% in the age bracket) attending a public institution.
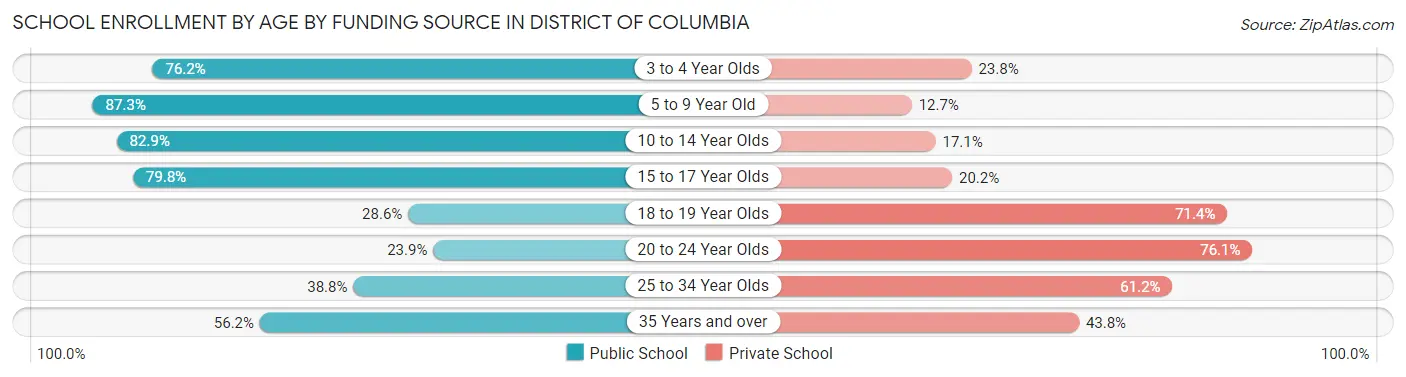
| Age Bracket | Public School | Private School |
| 3 to 4 Year Olds | 10,250 (76.2%) | 3,204 (23.8%) |
| 5 to 9 Year Old | 29,084 (87.3%) | 4,219 (12.7%) |
| 10 to 14 Year Olds | 25,951 (82.9%) | 5,361 (17.1%) |
| 15 to 17 Year Olds | 11,990 (79.8%) | 3,031 (20.2%) |
| 18 to 19 Year Olds | 3,986 (28.6%) | 9,971 (71.4%) |
| 20 to 24 Year Olds | 4,415 (23.9%) | 14,069 (76.1%) |
| 25 to 34 Year Olds | 7,548 (38.8%) | 11,921 (61.2%) |
| 35 Years and over | 6,363 (56.2%) | 4,963 (43.8%) |
| Total | 99,580 (63.7%) | 56,746 (36.3%) |
Educational Attainment by Field of Study in District Of Columbia
Social sciences (89,758 | 26.0%), business (41,444 | 12.0%), liberal arts & history (31,057 | 9.0%), literature & languages (28,114 | 8.2%), and communications (19,553 | 5.7%) are the most common fields of study among 345,038 individuals in District Of Columbia who have obtained a bachelor's degree or higher.
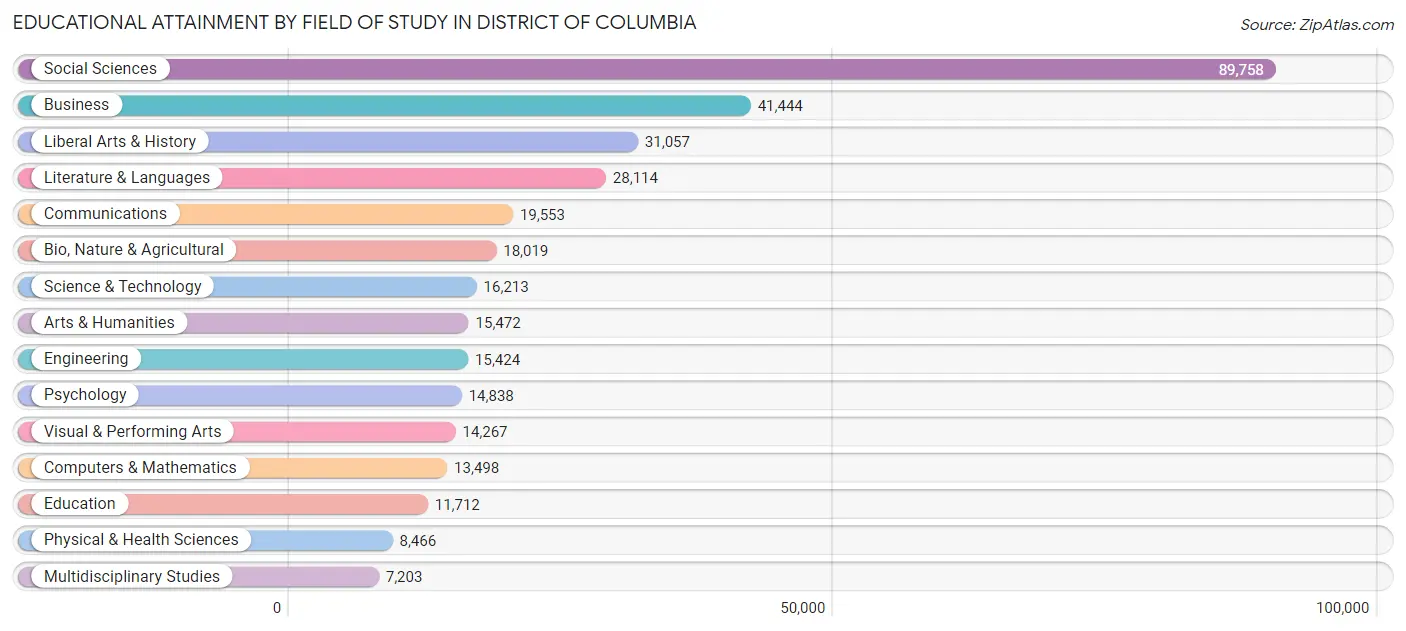
| Field of Study | # Graduates | % Graduates |
| Computers & Mathematics | 13,498 | 3.9% |
| Bio, Nature & Agricultural | 18,019 | 5.2% |
| Physical & Health Sciences | 8,466 | 2.5% |
| Psychology | 14,838 | 4.3% |
| Social Sciences | 89,758 | 26.0% |
| Engineering | 15,424 | 4.5% |
| Multidisciplinary Studies | 7,203 | 2.1% |
| Science & Technology | 16,213 | 4.7% |
| Business | 41,444 | 12.0% |
| Education | 11,712 | 3.4% |
| Literature & Languages | 28,114 | 8.2% |
| Liberal Arts & History | 31,057 | 9.0% |
| Visual & Performing Arts | 14,267 | 4.1% |
| Communications | 19,553 | 5.7% |
| Arts & Humanities | 15,472 | 4.5% |
| Total | 345,038 | 100.0% |
Transportation & Commute in District Of Columbia
Vehicle Availability by Sex in District Of Columbia
The most prevalent vehicle ownership categories in District Of Columbia are males with 1 vehicle (80,205, accounting for 45.6%) and females with 1 vehicle (87,501, making up 43.4%).
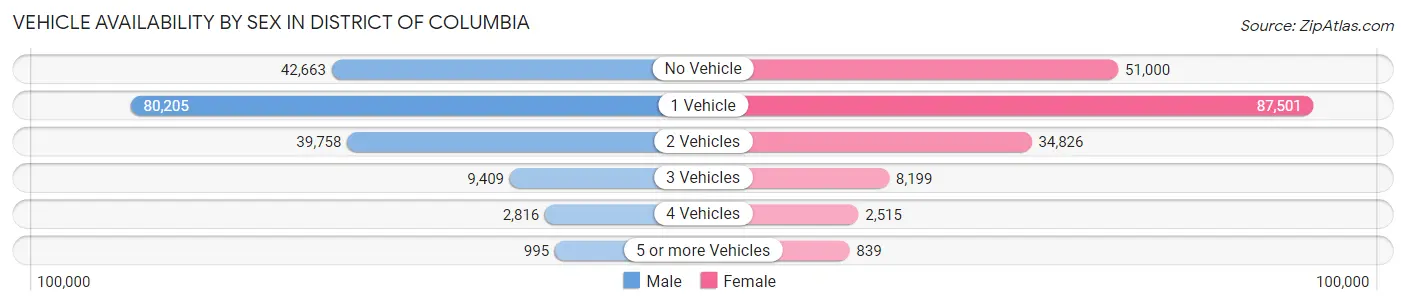
| Vehicles Available | Male | Female |
| No Vehicle | 42,663 (24.3%) | 51,000 (27.6%) |
| 1 Vehicle | 80,205 (45.6%) | 87,501 (47.3%) |
| 2 Vehicles | 39,758 (22.6%) | 34,826 (18.8%) |
| 3 Vehicles | 9,409 (5.3%) | 8,199 (4.4%) |
| 4 Vehicles | 2,816 (1.6%) | 2,515 (1.4%) |
| 5 or more Vehicles | 995 (0.6%) | 839 (0.4%) |
| Total | 175,846 (100.0%) | 184,880 (100.0%) |
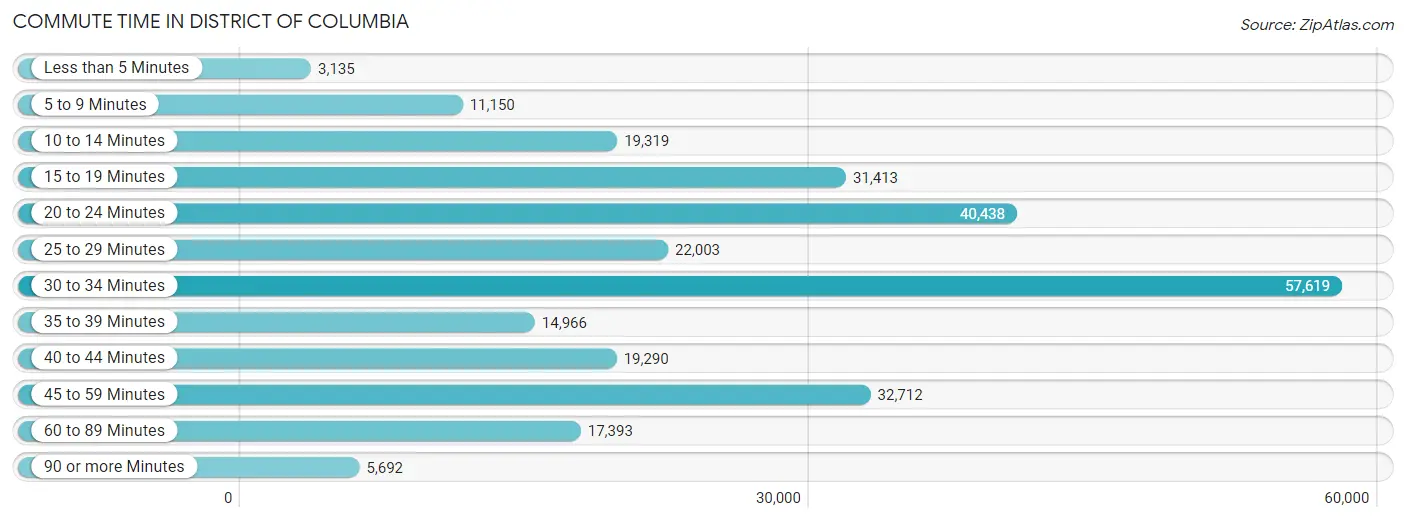
Commute Time in District Of Columbia
The most frequently occuring commute durations in District Of Columbia are 30 to 34 minutes (57,619 commuters, 20.9%), 20 to 24 minutes (40,438 commuters, 14.7%), and 45 to 59 minutes (32,712 commuters, 11.9%).
| Commute Time | # Commuters | % Commuters |
| Less than 5 Minutes | 3,135 | 1.1% |
| 5 to 9 Minutes | 11,150 | 4.1% |
| 10 to 14 Minutes | 19,319 | 7.0% |
| 15 to 19 Minutes | 31,413 | 11.4% |
| 20 to 24 Minutes | 40,438 | 14.7% |
| 25 to 29 Minutes | 22,003 | 8.0% |
| 30 to 34 Minutes | 57,619 | 20.9% |
| 35 to 39 Minutes | 14,966 | 5.4% |
| 40 to 44 Minutes | 19,290 | 7.0% |
| 45 to 59 Minutes | 32,712 | 11.9% |
| 60 to 89 Minutes | 17,393 | 6.3% |
| 90 or more Minutes | 5,692 | 2.1% |
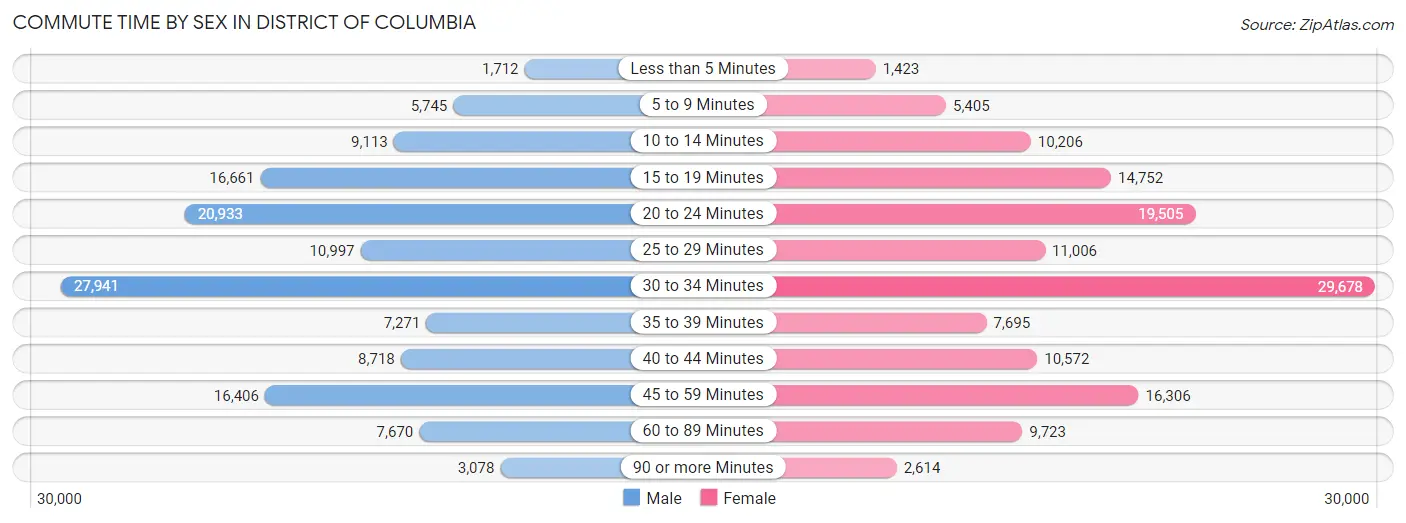
Commute Time by Sex in District Of Columbia
The most common commute times in District Of Columbia are 30 to 34 minutes (27,941 commuters, 20.5%) for males and 30 to 34 minutes (29,678 commuters, 21.4%) for females.
| Commute Time | Male | Female |
| Less than 5 Minutes | 1,712 (1.3%) | 1,423 (1.0%) |
| 5 to 9 Minutes | 5,745 (4.2%) | 5,405 (3.9%) |
| 10 to 14 Minutes | 9,113 (6.7%) | 10,206 (7.3%) |
| 15 to 19 Minutes | 16,661 (12.2%) | 14,752 (10.6%) |
| 20 to 24 Minutes | 20,933 (15.4%) | 19,505 (14.0%) |
| 25 to 29 Minutes | 10,997 (8.1%) | 11,006 (7.9%) |
| 30 to 34 Minutes | 27,941 (20.5%) | 29,678 (21.4%) |
| 35 to 39 Minutes | 7,271 (5.3%) | 7,695 (5.5%) |
| 40 to 44 Minutes | 8,718 (6.4%) | 10,572 (7.6%) |
| 45 to 59 Minutes | 16,406 (12.0%) | 16,306 (11.7%) |
| 60 to 89 Minutes | 7,670 (5.6%) | 9,723 (7.0%) |
| 90 or more Minutes | 3,078 (2.3%) | 2,614 (1.9%) |
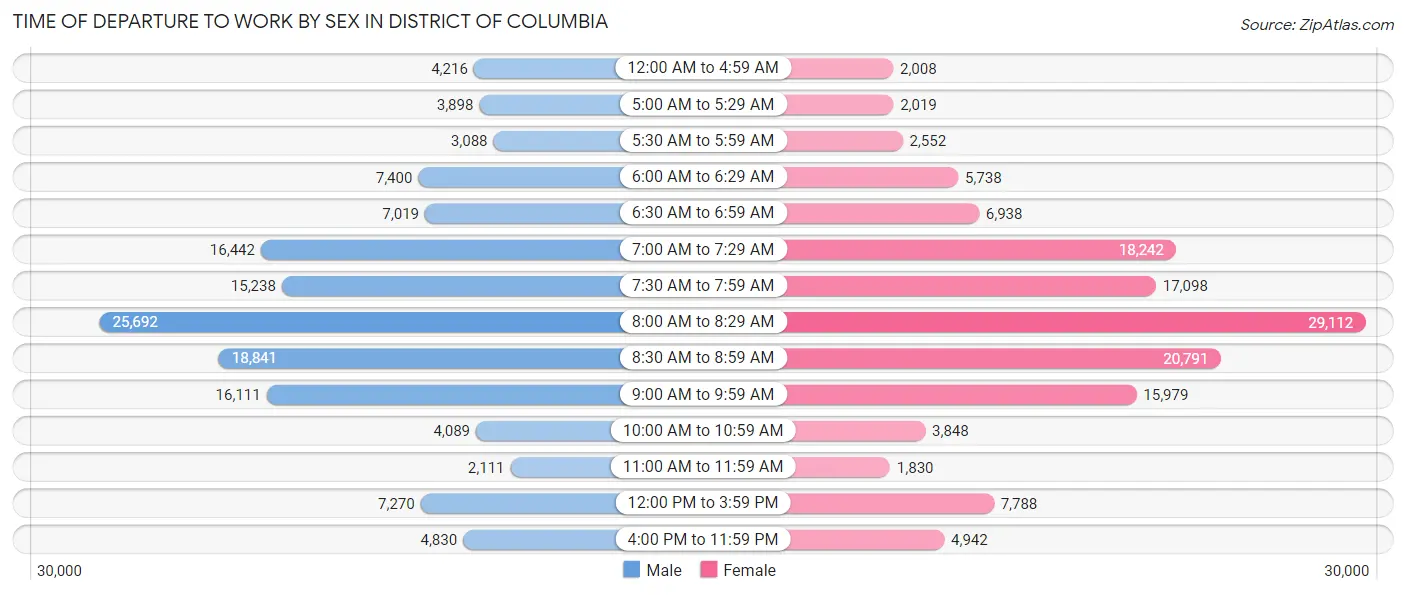
Time of Departure to Work by Sex in District Of Columbia
The most frequent times of departure to work in District Of Columbia are 8:00 AM to 8:29 AM (25,692, 18.9%) for males and 8:00 AM to 8:29 AM (29,112, 21.0%) for females.
| Time of Departure | Male | Female |
| 12:00 AM to 4:59 AM | 4,216 (3.1%) | 2,008 (1.5%) |
| 5:00 AM to 5:29 AM | 3,898 (2.9%) | 2,019 (1.5%) |
| 5:30 AM to 5:59 AM | 3,088 (2.3%) | 2,552 (1.8%) |
| 6:00 AM to 6:29 AM | 7,400 (5.4%) | 5,738 (4.1%) |
| 6:30 AM to 6:59 AM | 7,019 (5.1%) | 6,938 (5.0%) |
| 7:00 AM to 7:29 AM | 16,442 (12.1%) | 18,242 (13.1%) |
| 7:30 AM to 7:59 AM | 15,238 (11.2%) | 17,098 (12.3%) |
| 8:00 AM to 8:29 AM | 25,692 (18.9%) | 29,112 (21.0%) |
| 8:30 AM to 8:59 AM | 18,841 (13.8%) | 20,791 (15.0%) |
| 9:00 AM to 9:59 AM | 16,111 (11.8%) | 15,979 (11.5%) |
| 10:00 AM to 10:59 AM | 4,089 (3.0%) | 3,848 (2.8%) |
| 11:00 AM to 11:59 AM | 2,111 (1.5%) | 1,830 (1.3%) |
| 12:00 PM to 3:59 PM | 7,270 (5.3%) | 7,788 (5.6%) |
| 4:00 PM to 11:59 PM | 4,830 (3.5%) | 4,942 (3.6%) |
| Total | 136,245 (100.0%) | 138,885 (100.0%) |
Housing Occupancy in District Of Columbia
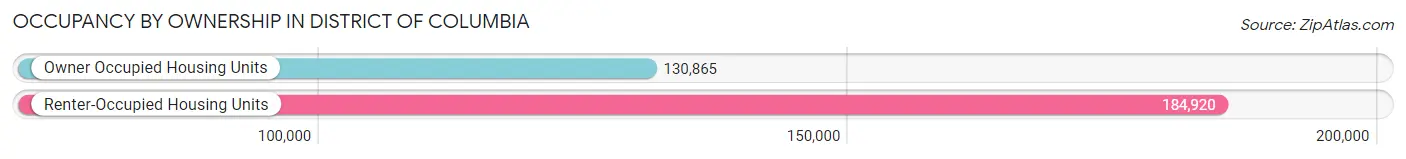
Occupancy by Ownership in District Of Columbia
Of the total 315,785 dwellings in District Of Columbia, owner-occupied units account for 130,865 (41.4%), while renter-occupied units make up 184,920 (58.6%).
| Occupancy | # Housing Units | % Housing Units |
| Owner Occupied Housing Units | 130,865 | 41.4% |
| Renter-Occupied Housing Units | 184,920 | 58.6% |
| Total Occupied Housing Units | 315,785 | 100.0% |
Occupancy by Household Size in District Of Columbia
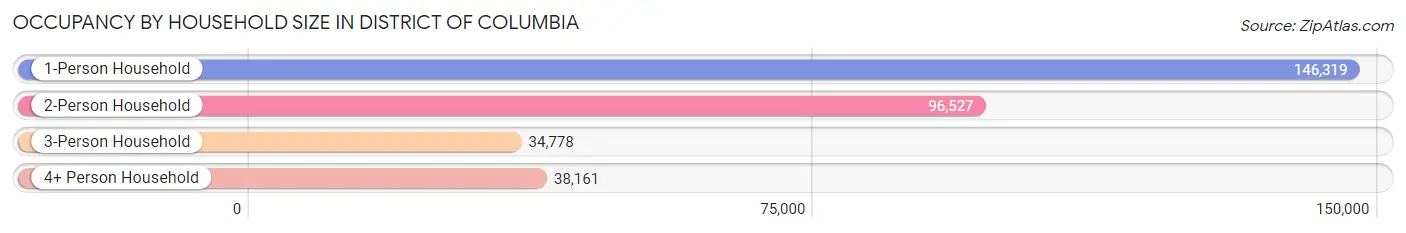
| Household Size | # Housing Units | % Housing Units |
| 1-Person Household | 146,319 | 46.3% |
| 2-Person Household | 96,527 | 30.6% |
| 3-Person Household | 34,778 | 11.0% |
| 4+ Person Household | 38,161 | 12.1% |
| Total Housing Units | 315,785 | 100.0% |
Occupancy by Ownership by Household Size in District Of Columbia
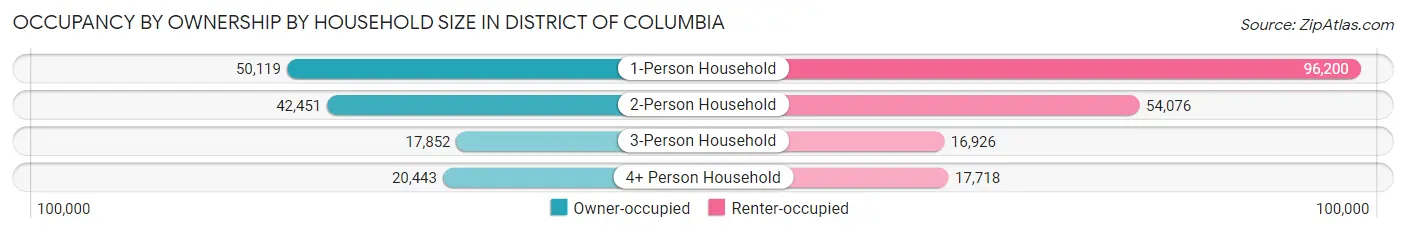
| Household Size | Owner-occupied | Renter-occupied |
| 1-Person Household | 50,119 (34.3%) | 96,200 (65.7%) |
| 2-Person Household | 42,451 (44.0%) | 54,076 (56.0%) |
| 3-Person Household | 17,852 (51.3%) | 16,926 (48.7%) |
| 4+ Person Household | 20,443 (53.6%) | 17,718 (46.4%) |
| Total Housing Units | 130,865 (41.4%) | 184,920 (58.6%) |
Occupancy by Educational Attainment in District Of Columbia
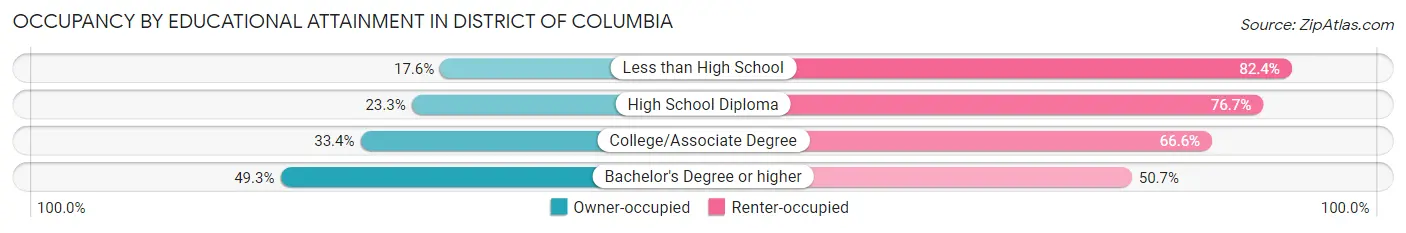
| Household Size | Owner-occupied | Renter-occupied |
| Less than High School | 3,670 (17.6%) | 17,146 (82.4%) |
| High School Diploma | 9,708 (23.3%) | 31,950 (76.7%) |
| College/Associate Degree | 15,659 (33.4%) | 31,168 (66.6%) |
| Bachelor's Degree or higher | 101,828 (49.3%) | 104,656 (50.7%) |
Occupancy by Age of Householder in District Of Columbia
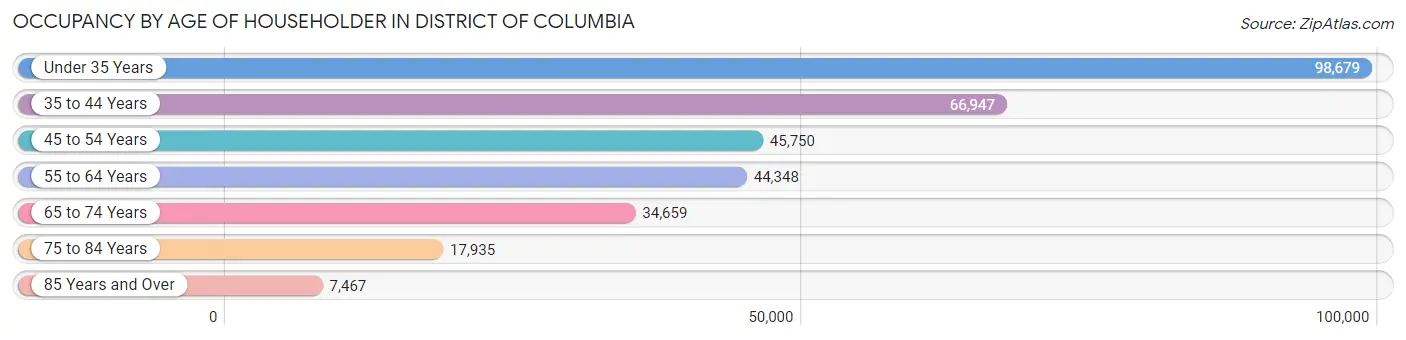
| Age Bracket | # Households | % Households |
| Under 35 Years | 98,679 | 31.2% |
| 35 to 44 Years | 66,947 | 21.2% |
| 45 to 54 Years | 45,750 | 14.5% |
| 55 to 64 Years | 44,348 | 14.0% |
| 65 to 74 Years | 34,659 | 11.0% |
| 75 to 84 Years | 17,935 | 5.7% |
| 85 Years and Over | 7,467 | 2.4% |
| Total | 315,785 | 100.0% |
Housing Finances in District Of Columbia
Median Income by Occupancy in District Of Columbia
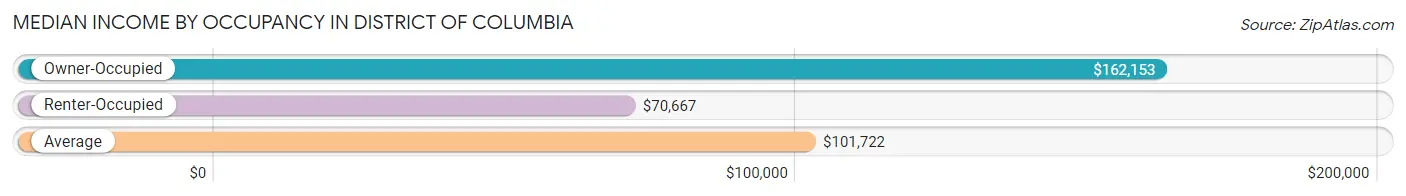
| Occupancy Type | # Households | Median Income |
| Owner-Occupied | 130,865 (41.4%) | $162,153 |
| Renter-Occupied | 184,920 (58.6%) | $70,667 |
| Average | 315,785 (100.0%) | $101,722 |
Occupancy by Householder Income Bracket in District Of Columbia
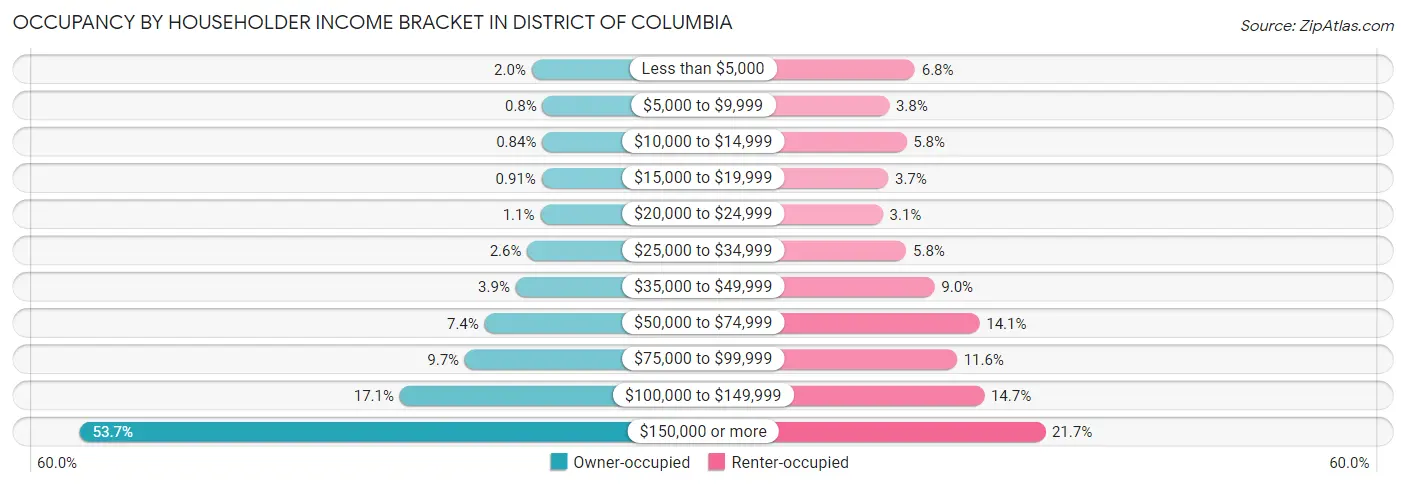
| Income Bracket | Owner-occupied | Renter-occupied |
| Less than $5,000 | 2,664 (2.0%) | 12,512 (6.8%) |
| $5,000 to $9,999 | 1,045 (0.8%) | 7,066 (3.8%) |
| $10,000 to $14,999 | 1,094 (0.8%) | 10,725 (5.8%) |
| $15,000 to $19,999 | 1,189 (0.9%) | 6,852 (3.7%) |
| $20,000 to $24,999 | 1,393 (1.1%) | 5,709 (3.1%) |
| $25,000 to $34,999 | 3,338 (2.5%) | 10,681 (5.8%) |
| $35,000 to $49,999 | 5,060 (3.9%) | 16,667 (9.0%) |
| $50,000 to $74,999 | 9,721 (7.4%) | 26,156 (14.1%) |
| $75,000 to $99,999 | 12,665 (9.7%) | 21,379 (11.6%) |
| $100,000 to $149,999 | 22,403 (17.1%) | 27,140 (14.7%) |
| $150,000 or more | 70,293 (53.7%) | 40,033 (21.6%) |
| Total | 130,865 (100.0%) | 184,920 (100.0%) |
Monthly Housing Cost Tiers in District Of Columbia
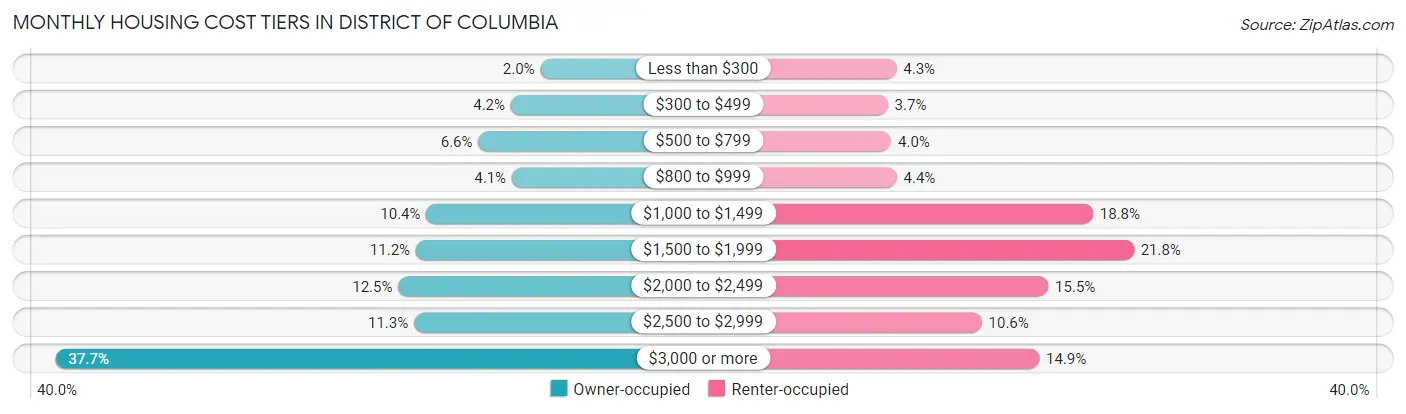
| Monthly Cost | Owner-occupied | Renter-occupied |
| Less than $300 | 2,627 (2.0%) | 8,019 (4.3%) |
| $300 to $499 | 5,487 (4.2%) | 6,851 (3.7%) |
| $500 to $799 | 8,612 (6.6%) | 7,307 (4.0%) |
| $800 to $999 | 5,384 (4.1%) | 8,065 (4.4%) |
| $1,000 to $1,499 | 13,629 (10.4%) | 34,782 (18.8%) |
| $1,500 to $1,999 | 14,626 (11.2%) | 40,355 (21.8%) |
| $2,000 to $2,499 | 16,330 (12.5%) | 28,691 (15.5%) |
| $2,500 to $2,999 | 14,813 (11.3%) | 19,639 (10.6%) |
| $3,000 or more | 49,357 (37.7%) | 27,463 (14.8%) |
| Total | 130,865 (100.0%) | 184,920 (100.0%) |
Physical Housing Characteristics in District Of Columbia
Housing Structures in District Of Columbia
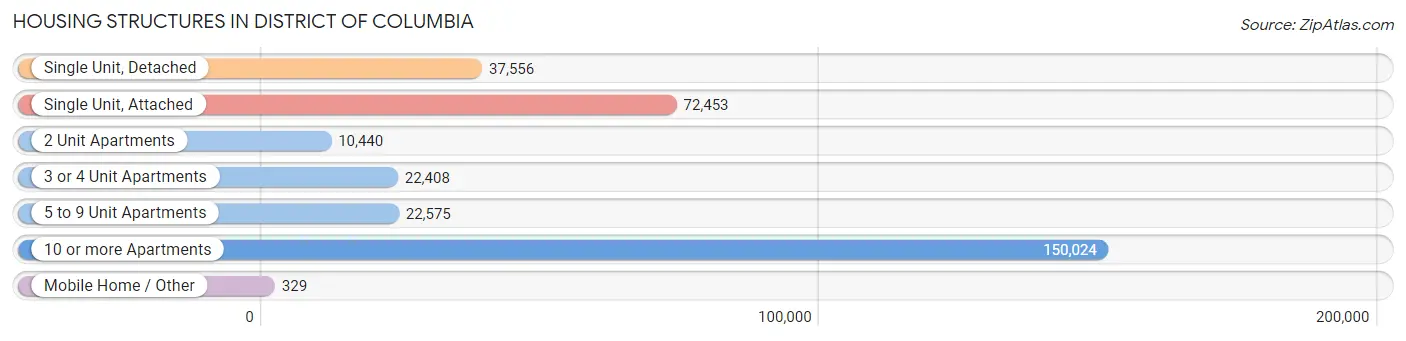
| Structure Type | # Housing Units | % Housing Units |
| Single Unit, Detached | 37,556 | 11.9% |
| Single Unit, Attached | 72,453 | 22.9% |
| 2 Unit Apartments | 10,440 | 3.3% |
| 3 or 4 Unit Apartments | 22,408 | 7.1% |
| 5 to 9 Unit Apartments | 22,575 | 7.1% |
| 10 or more Apartments | 150,024 | 47.5% |
| Mobile Home / Other | 329 | 0.1% |
| Total | 315,785 | 100.0% |
Housing Structures by Occupancy in District Of Columbia
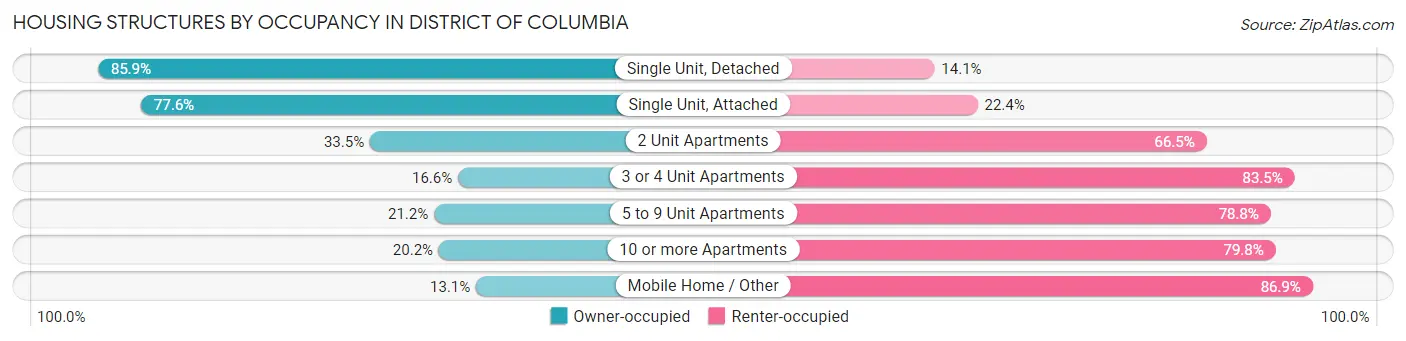
| Structure Type | Owner-occupied | Renter-occupied |
| Single Unit, Detached | 32,261 (85.9%) | 5,295 (14.1%) |
| Single Unit, Attached | 56,223 (77.6%) | 16,230 (22.4%) |
| 2 Unit Apartments | 3,497 (33.5%) | 6,943 (66.5%) |
| 3 or 4 Unit Apartments | 3,709 (16.6%) | 18,699 (83.5%) |
| 5 to 9 Unit Apartments | 4,776 (21.2%) | 17,799 (78.8%) |
| 10 or more Apartments | 30,356 (20.2%) | 119,668 (79.8%) |
| Mobile Home / Other | 43 (13.1%) | 286 (86.9%) |
| Total | 130,865 (41.4%) | 184,920 (58.6%) |
Housing Structures by Number of Rooms in District Of Columbia
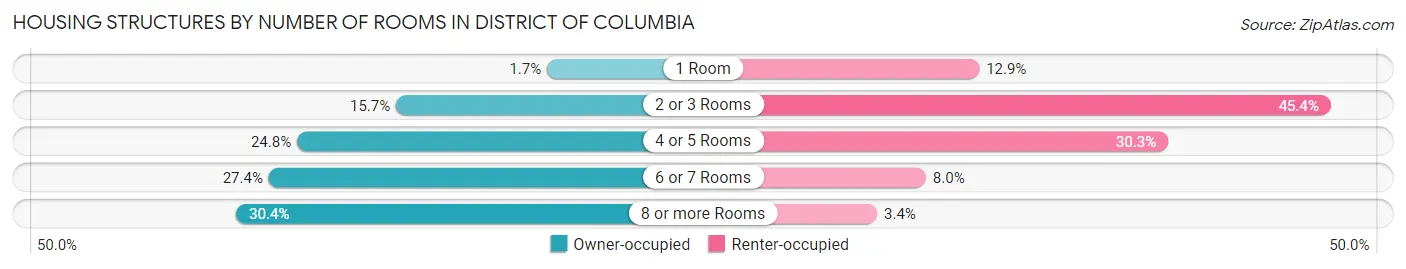
| Number of Rooms | Owner-occupied | Renter-occupied |
| 1 Room | 2,204 (1.7%) | 23,816 (12.9%) |
| 2 or 3 Rooms | 20,483 (15.7%) | 83,931 (45.4%) |
| 4 or 5 Rooms | 32,471 (24.8%) | 56,102 (30.3%) |
| 6 or 7 Rooms | 35,880 (27.4%) | 14,702 (8.0%) |
| 8 or more Rooms | 39,827 (30.4%) | 6,369 (3.4%) |
| Total | 130,865 (100.0%) | 184,920 (100.0%) |
Housing Structure by Heating Type in District Of Columbia
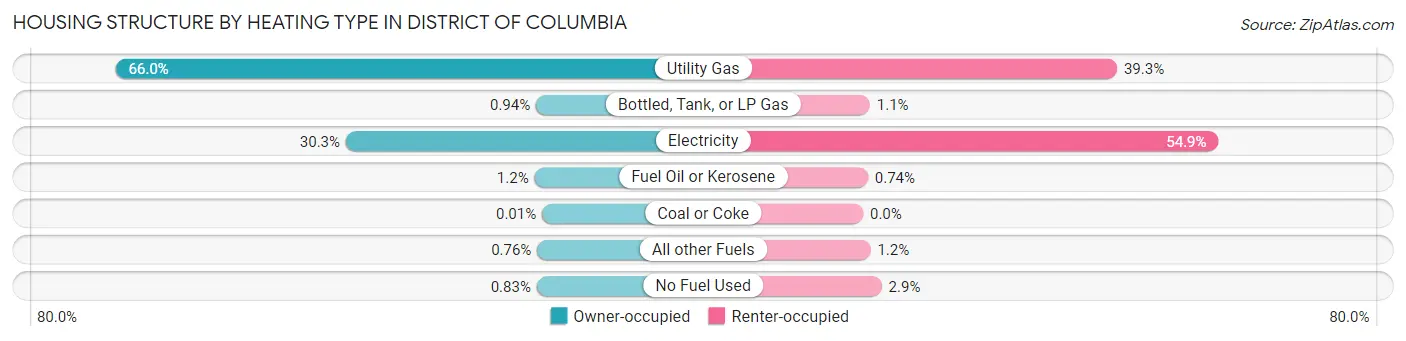
| Heating Type | Owner-occupied | Renter-occupied |
| Utility Gas | 86,308 (65.9%) | 72,596 (39.3%) |
| Bottled, Tank, or LP Gas | 1,230 (0.9%) | 1,947 (1.1%) |
| Electricity | 39,699 (30.3%) | 101,556 (54.9%) |
| Fuel Oil or Kerosene | 1,541 (1.2%) | 1,366 (0.7%) |
| Coal or Coke | 13 (0.0%) | 0 (0.0%) |
| All other Fuels | 989 (0.8%) | 2,135 (1.1%) |
| No Fuel Used | 1,085 (0.8%) | 5,320 (2.9%) |
| Total | 130,865 (100.0%) | 184,920 (100.0%) |
Household Vehicle Usage in District Of Columbia
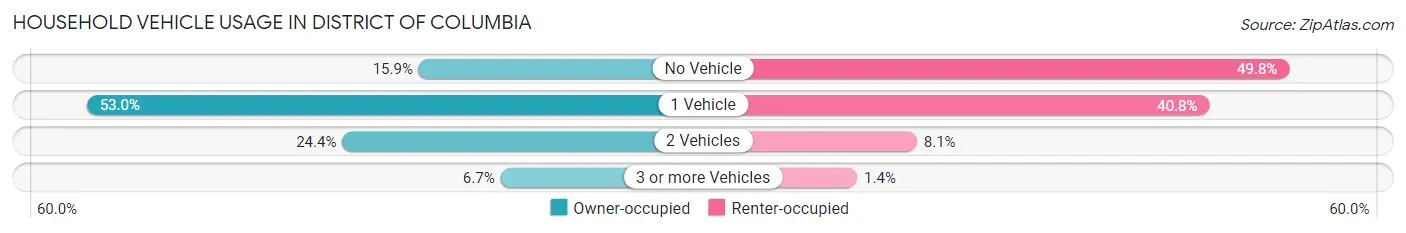
| Vehicles per Household | Owner-occupied | Renter-occupied |
| No Vehicle | 20,745 (15.9%) | 92,017 (49.8%) |
| 1 Vehicle | 69,411 (53.0%) | 75,469 (40.8%) |
| 2 Vehicles | 31,959 (24.4%) | 14,905 (8.1%) |
| 3 or more Vehicles | 8,750 (6.7%) | 2,529 (1.4%) |
| Total | 130,865 (100.0%) | 184,920 (100.0%) |
Real Estate & Mortgages in District Of Columbia
Real Estate and Mortgage Overview in District Of Columbia
| Characteristic | Without Mortgage | With Mortgage |
| Housing Units | 31,753 | 99,112 |
| Median Property Value | $704,400 | $705,200 |
| Median Household Income | $117,459 | $58,132 |
| Monthly Housing Costs | $821 | $48,396 |
| Real Estate Taxes | $3,488 | $1,909 |
Property Value by Mortgage Status in District Of Columbia
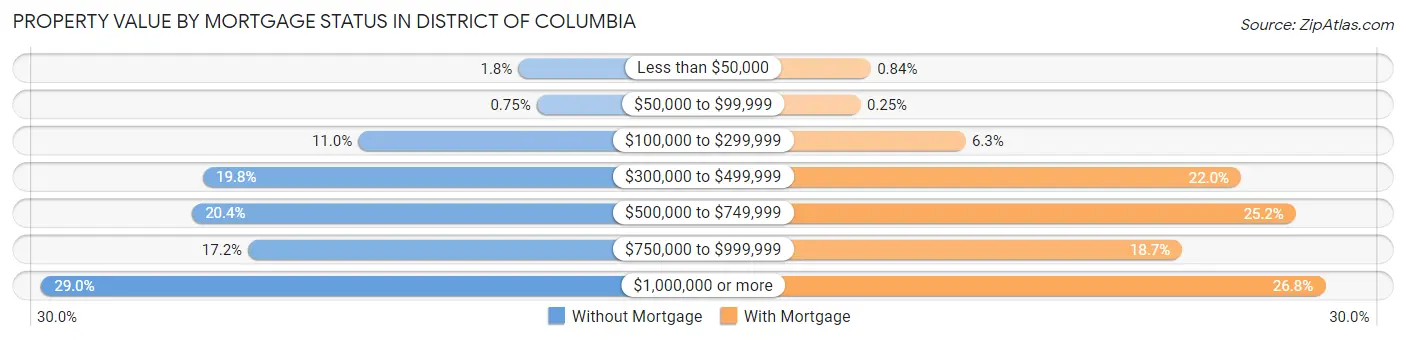
| Property Value | Without Mortgage | With Mortgage |
| Less than $50,000 | 573 (1.8%) | 833 (0.8%) |
| $50,000 to $99,999 | 238 (0.7%) | 243 (0.3%) |
| $100,000 to $299,999 | 3,477 (11.0%) | 6,199 (6.2%) |
| $300,000 to $499,999 | 6,287 (19.8%) | 21,827 (22.0%) |
| $500,000 to $749,999 | 6,485 (20.4%) | 24,924 (25.2%) |
| $750,000 to $999,999 | 5,473 (17.2%) | 18,491 (18.7%) |
| $1,000,000 or more | 9,220 (29.0%) | 26,595 (26.8%) |
| Total | 31,753 (100.0%) | 99,112 (100.0%) |
Household Income by Mortgage Status in District Of Columbia
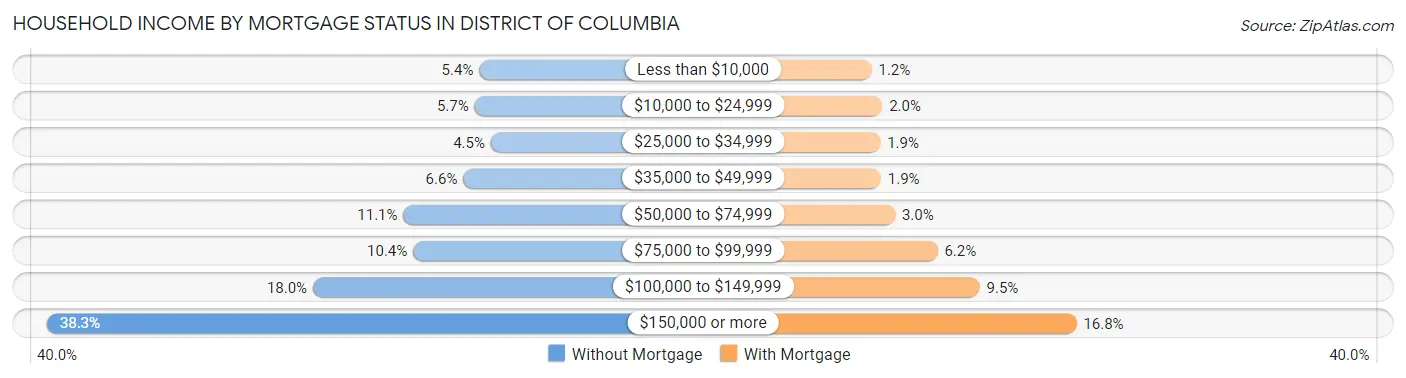
| Household Income | Without Mortgage | With Mortgage |
| Less than $10,000 | 1,701 (5.4%) | 1,205 (1.2%) |
| $10,000 to $24,999 | 1,817 (5.7%) | 2,008 (2.0%) |
| $25,000 to $34,999 | 1,421 (4.5%) | 1,859 (1.9%) |
| $35,000 to $49,999 | 2,088 (6.6%) | 1,917 (1.9%) |
| $50,000 to $74,999 | 3,537 (11.1%) | 2,972 (3.0%) |
| $75,000 to $99,999 | 3,302 (10.4%) | 6,184 (6.2%) |
| $100,000 to $149,999 | 5,726 (18.0%) | 9,363 (9.5%) |
| $150,000 or more | 12,161 (38.3%) | 16,677 (16.8%) |
| Total | 31,753 (100.0%) | 99,112 (100.0%) |
Property Value to Household Income Ratio in District Of Columbia
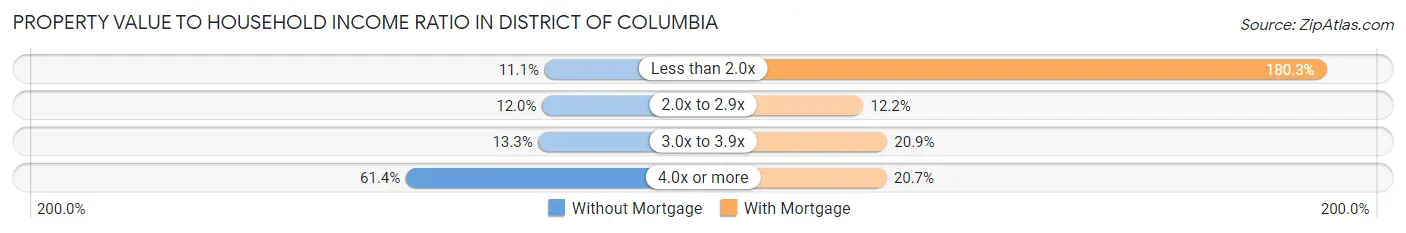
| Value-to-Income Ratio | Without Mortgage | With Mortgage |
| Less than 2.0x | 3,518 (11.1%) | 178,717 (180.3%) |
| 2.0x to 2.9x | 3,798 (12.0%) | 12,101 (12.2%) |
| 3.0x to 3.9x | 4,236 (13.3%) | 20,679 (20.9%) |
| 4.0x or more | 19,505 (61.4%) | 20,509 (20.7%) |
| Total | 31,753 (100.0%) | 99,112 (100.0%) |
Real Estate Taxes by Mortgage Status in District Of Columbia
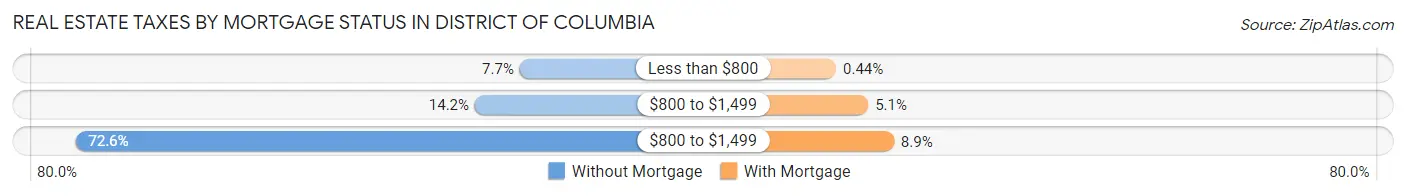
| Property Taxes | Without Mortgage | With Mortgage |
| Less than $800 | 2,428 (7.6%) | 435 (0.4%) |
| $800 to $1,499 | 4,511 (14.2%) | 5,092 (5.1%) |
| $800 to $1,499 | 23,047 (72.6%) | 8,814 (8.9%) |
| Total | 31,753 (100.0%) | 99,112 (100.0%) |
Health & Disability in District Of Columbia
Health Insurance Coverage by Age in District Of Columbia
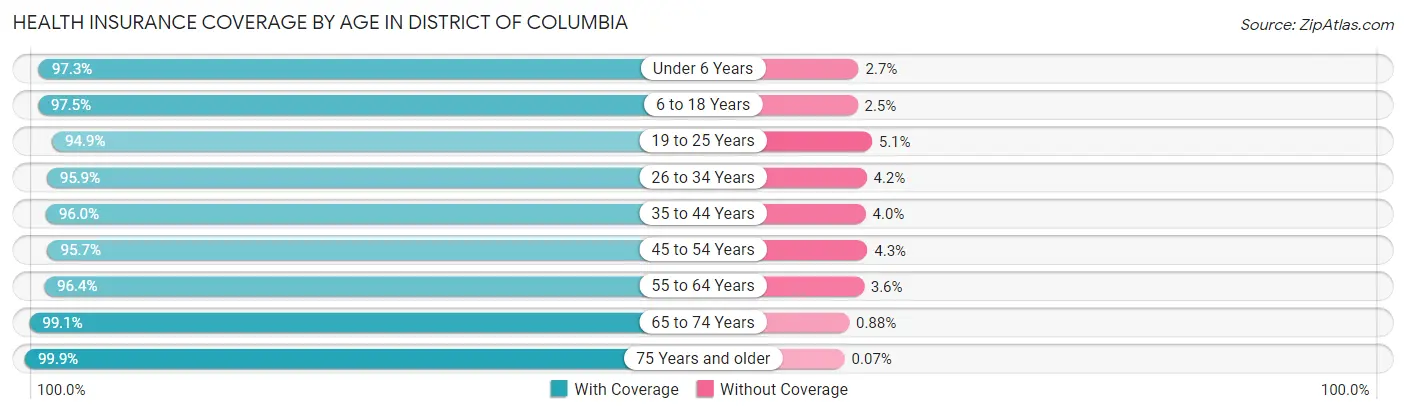
| Age Bracket | With Coverage | Without Coverage |
| Under 6 Years | 47,278 (97.3%) | 1,296 (2.7%) |
| 6 to 18 Years | 81,447 (97.5%) | 2,063 (2.5%) |
| 19 to 25 Years | 63,370 (94.9%) | 3,425 (5.1%) |
| 26 to 34 Years | 130,335 (95.9%) | 5,647 (4.2%) |
| 35 to 44 Years | 102,153 (96.0%) | 4,219 (4.0%) |
| 45 to 54 Years | 68,811 (95.7%) | 3,094 (4.3%) |
| 55 to 64 Years | 63,825 (96.4%) | 2,403 (3.6%) |
| 65 to 74 Years | 47,767 (99.1%) | 422 (0.9%) |
| 75 Years and older | 34,018 (99.9%) | 23 (0.1%) |
| Total | 639,004 (96.6%) | 22,592 (3.4%) |
Health Insurance Coverage by Citizenship Status in District Of Columbia
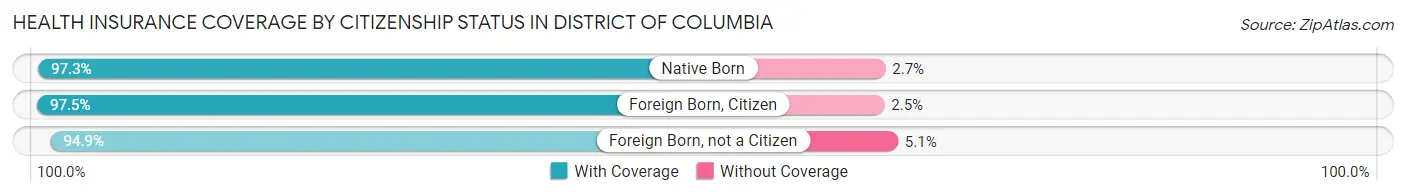
| Citizenship Status | With Coverage | Without Coverage |
| Native Born | 47,278 (97.3%) | 1,296 (2.7%) |
| Foreign Born, Citizen | 81,447 (97.5%) | 2,063 (2.5%) |
| Foreign Born, not a Citizen | 63,370 (94.9%) | 3,425 (5.1%) |
Health Insurance Coverage by Household Income in District Of Columbia
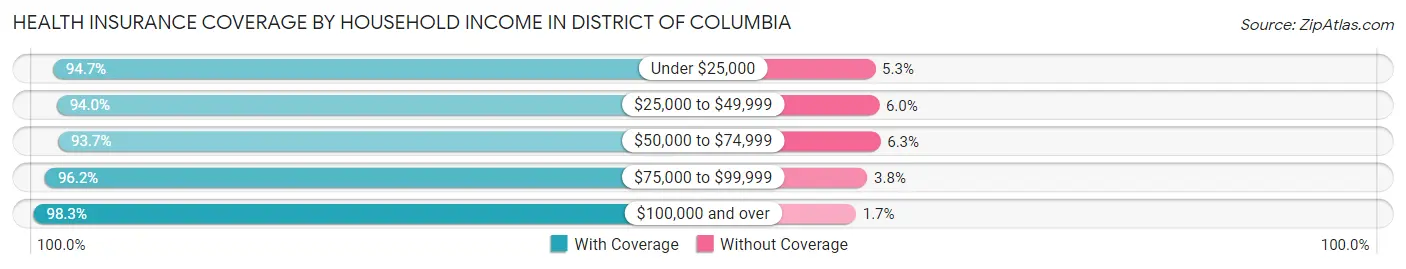
| Household Income | With Coverage | Without Coverage |
| Under $25,000 | 82,182 (94.7%) | 4,606 (5.3%) |
| $25,000 to $49,999 | 63,862 (94.0%) | 4,093 (6.0%) |
| $50,000 to $74,999 | 59,517 (93.7%) | 3,979 (6.3%) |
| $75,000 to $99,999 | 54,640 (96.2%) | 2,173 (3.8%) |
| $100,000 and over | 357,904 (98.3%) | 6,145 (1.7%) |
Public vs Private Health Insurance Coverage by Age in District Of Columbia
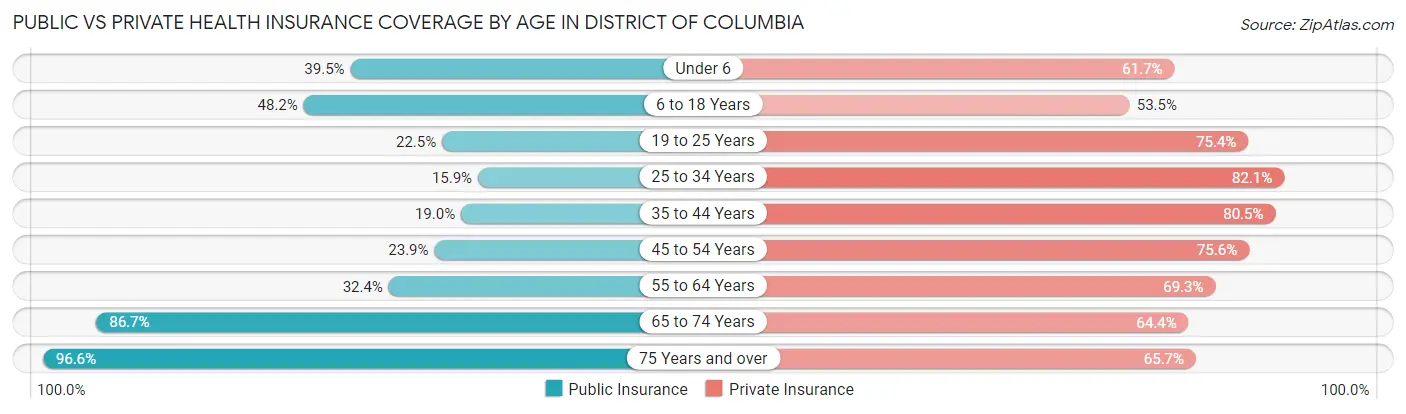
| Age Bracket | Public Insurance | Private Insurance |
| Under 6 | 19,203 (39.5%) | 29,985 (61.7%) |
| 6 to 18 Years | 40,260 (48.2%) | 44,641 (53.5%) |
| 19 to 25 Years | 15,043 (22.5%) | 50,383 (75.4%) |
| 25 to 34 Years | 21,548 (15.9%) | 111,632 (82.1%) |
| 35 to 44 Years | 20,208 (19.0%) | 85,591 (80.5%) |
| 45 to 54 Years | 17,212 (23.9%) | 54,338 (75.6%) |
| 55 to 64 Years | 21,474 (32.4%) | 45,906 (69.3%) |
| 65 to 74 Years | 41,774 (86.7%) | 31,017 (64.4%) |
| 75 Years and over | 32,885 (96.6%) | 22,369 (65.7%) |
| Total | 229,607 (34.7%) | 475,862 (71.9%) |
Disability Status by Sex by Age in District Of Columbia
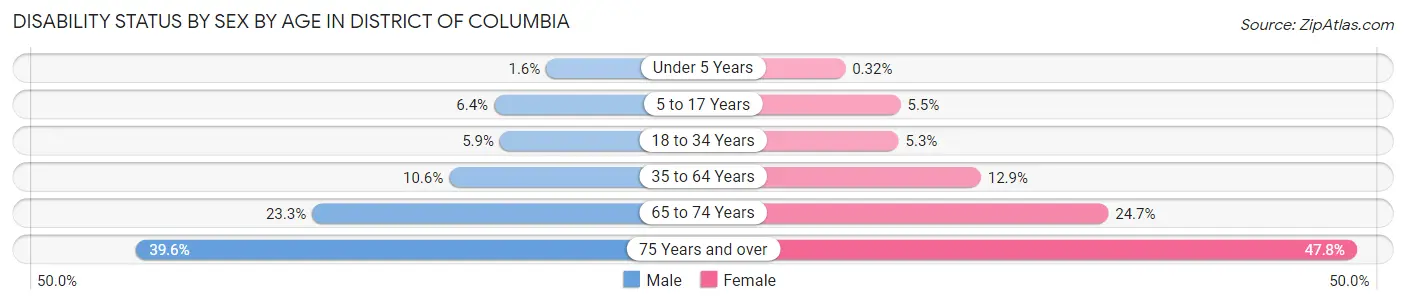
| Age Bracket | Male | Female |
| Under 5 Years | 341 (1.6%) | 64 (0.3%) |
| 5 to 17 Years | 2,670 (6.4%) | 2,227 (5.4%) |
| 18 to 34 Years | 5,731 (5.9%) | 5,999 (5.3%) |
| 35 to 64 Years | 12,781 (10.6%) | 16,002 (12.9%) |
| 65 to 74 Years | 4,888 (23.3%) | 6,735 (24.7%) |
| 75 Years and over | 5,102 (39.6%) | 10,119 (47.8%) |
Disability Class by Sex by Age in District Of Columbia
Disability Class: Hearing Difficulty
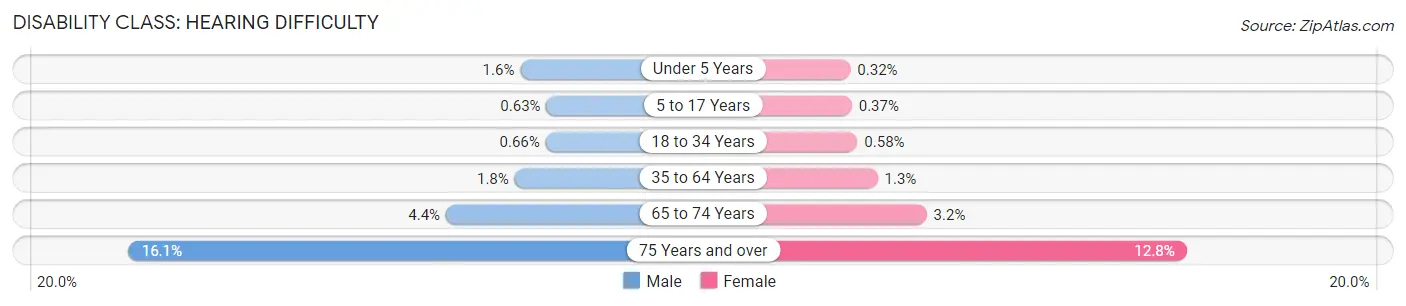
| Age Bracket | Male | Female |
| Under 5 Years | 341 (1.6%) | 64 (0.3%) |
| 5 to 17 Years | 260 (0.6%) | 151 (0.4%) |
| 18 to 34 Years | 646 (0.7%) | 665 (0.6%) |
| 35 to 64 Years | 2,182 (1.8%) | 1,651 (1.3%) |
| 65 to 74 Years | 913 (4.4%) | 859 (3.2%) |
| 75 Years and over | 2,077 (16.1%) | 2,709 (12.8%) |
Disability Class: Vision Difficulty
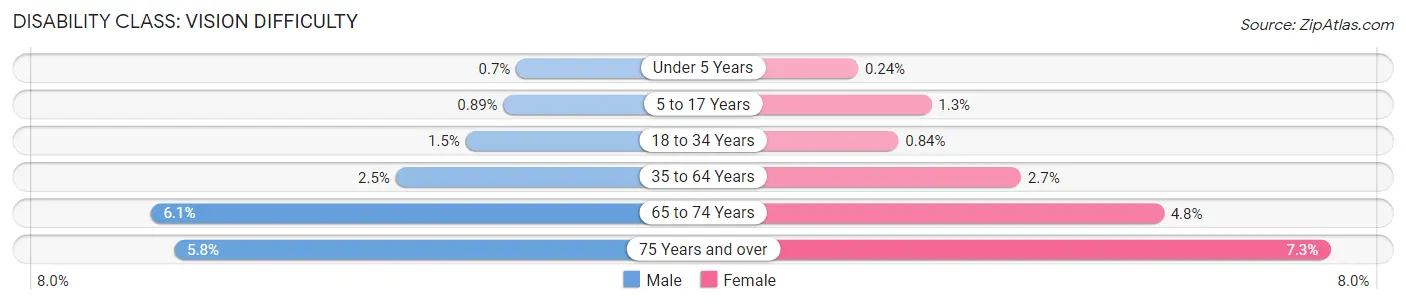
| Age Bracket | Male | Female |
| Under 5 Years | 149 (0.7%) | 49 (0.2%) |
| 5 to 17 Years | 369 (0.9%) | 545 (1.3%) |
| 18 to 34 Years | 1,406 (1.5%) | 958 (0.8%) |
| 35 to 64 Years | 3,002 (2.5%) | 3,297 (2.7%) |
| 65 to 74 Years | 1,285 (6.1%) | 1,302 (4.8%) |
| 75 Years and over | 744 (5.8%) | 1,534 (7.2%) |
Disability Class: Cognitive Difficulty
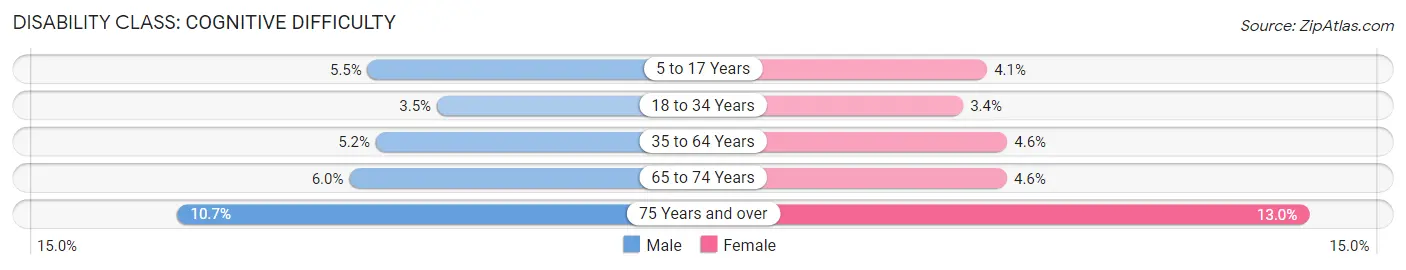
| Age Bracket | Male | Female |
| 5 to 17 Years | 2,261 (5.4%) | 1,652 (4.1%) |
| 18 to 34 Years | 3,417 (3.5%) | 3,855 (3.4%) |
| 35 to 64 Years | 6,288 (5.2%) | 5,723 (4.6%) |
| 65 to 74 Years | 1,249 (6.0%) | 1,252 (4.6%) |
| 75 Years and over | 1,383 (10.7%) | 2,754 (13.0%) |
Disability Class: Ambulatory Difficulty
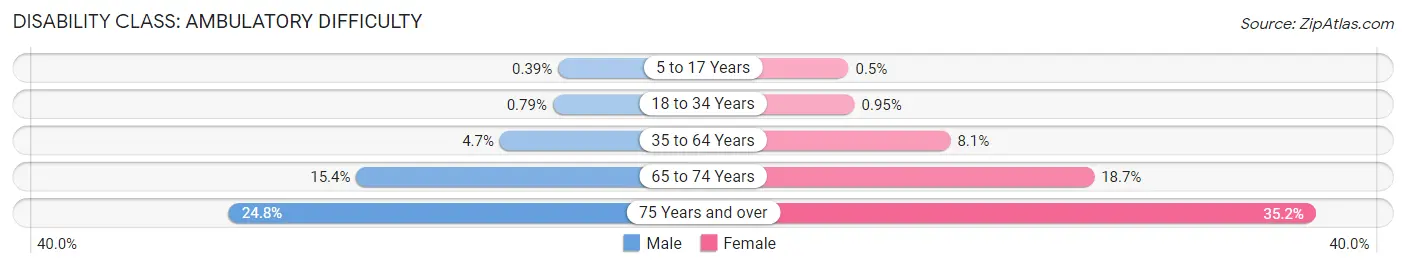
| Age Bracket | Male | Female |
| 5 to 17 Years | 161 (0.4%) | 205 (0.5%) |
| 18 to 34 Years | 769 (0.8%) | 1,078 (0.9%) |
| 35 to 64 Years | 5,691 (4.7%) | 10,013 (8.1%) |
| 65 to 74 Years | 3,220 (15.4%) | 5,105 (18.7%) |
| 75 Years and over | 3,197 (24.8%) | 7,446 (35.2%) |
Disability Class: Self-Care Difficulty
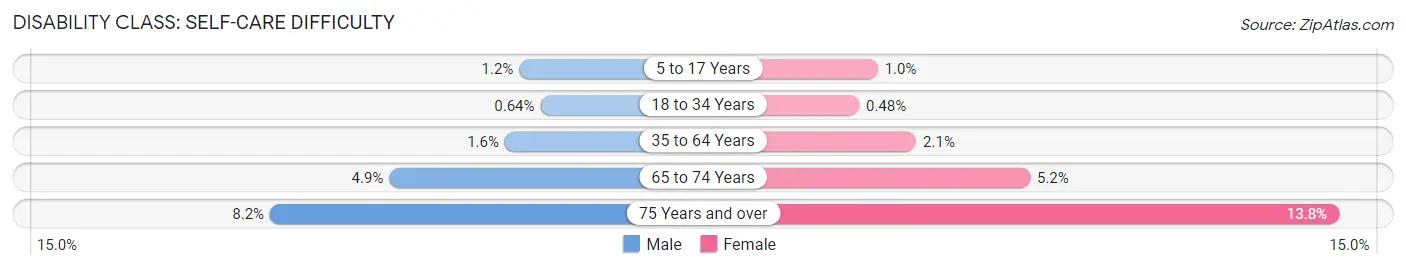
| Age Bracket | Male | Female |
| 5 to 17 Years | 509 (1.2%) | 407 (1.0%) |
| 18 to 34 Years | 617 (0.6%) | 545 (0.5%) |
| 35 to 64 Years | 1,964 (1.6%) | 2,566 (2.1%) |
| 65 to 74 Years | 1,017 (4.9%) | 1,427 (5.2%) |
| 75 Years and over | 1,052 (8.2%) | 2,929 (13.8%) |
Technology Access in District Of Columbia
Computing Device Access in District Of Columbia
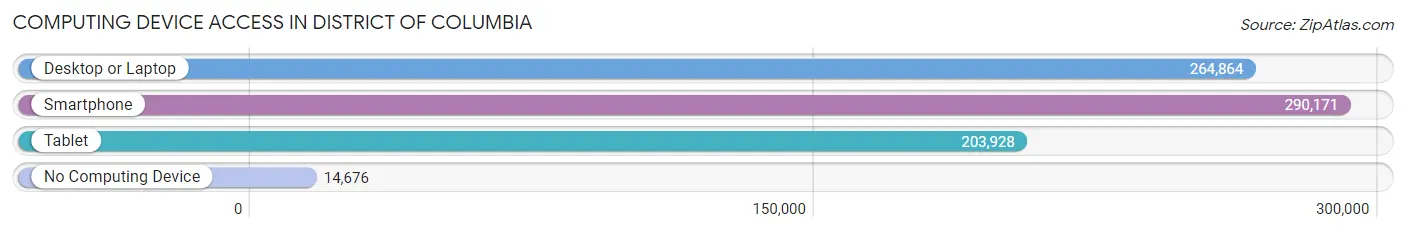
| Device Type | # Households | % Households |
| Desktop or Laptop | 264,864 | 83.9% |
| Smartphone | 290,171 | 91.9% |
| Tablet | 203,928 | 64.6% |
| No Computing Device | 14,676 | 4.6% |
| Total | 315,785 | 100.0% |
Internet Access in District Of Columbia
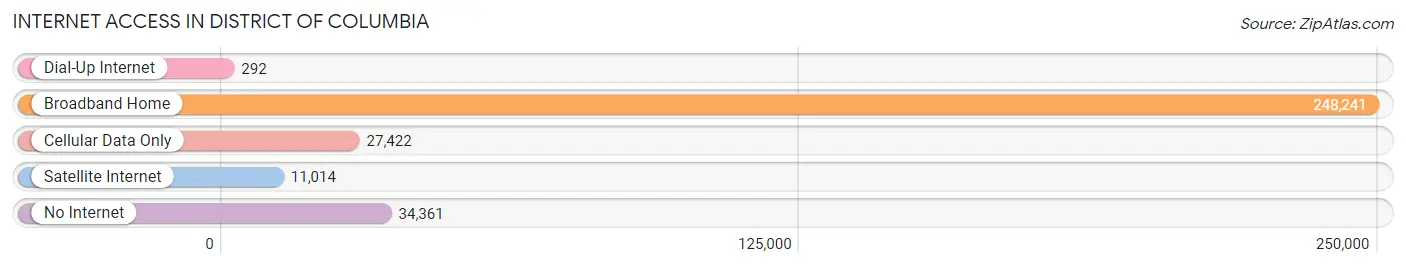
| Internet Type | # Households | % Households |
| Dial-Up Internet | 292 | 0.1% |
| Broadband Home | 248,241 | 78.6% |
| Cellular Data Only | 27,422 | 8.7% |
| Satellite Internet | 11,014 | 3.5% |
| No Internet | 34,361 | 10.9% |
| Total | 315,785 | 100.0% |
District Of Columbia Summary
The District of Columbia, commonly referred to as Washington, D.C., is the capital of the United States of America. It is located on the Potomac River, between the states of Maryland and Virginia. The District of Columbia is a federal district, not a state, and is not part of any state. It is the only federal district in the United States.
History
The District of Columbia was established in 1790 as the permanent seat of the federal government. The area was chosen by President George Washington and was originally part of the states of Maryland and Virginia. The area was ceded to the federal government by both states in 1790. The city was named after George Washington and was designed by Pierre Charles L’Enfant.
The city was initially divided into four quadrants, with the Capitol Building located at the center. The city was planned to be a model of urban planning, with wide streets, parks, and public squares. The city was also designed to be a symbol of the federal government, with the Capitol Building at the center and the White House and other government buildings located nearby.
The city grew rapidly in the 19th century, becoming a major center of government and commerce. The city was the site of several major events in American history, including the assassination of President Abraham Lincoln in 1865 and the March on Washington in 1963.
Geography
The District of Columbia is located on the east coast of the United States, between the states of Maryland and Virginia. It is bordered by the Potomac River to the south and west, and the Anacostia River to the east. The city covers an area of 68.3 square miles, making it the smallest federal district in the United States.
The city is divided into four quadrants: Northwest, Northeast, Southeast, and Southwest. The Capitol Building is located at the center of the city, and the White House is located in the Northwest quadrant. The city is divided into eight wards, with each ward represented by a member of the city council.
The city is located at the confluence of the Potomac and Anacostia Rivers, and is home to several parks and monuments. The city is also home to several universities, including Georgetown University, George Washington University, and American University.
Economy
The District of Columbia has a strong and diverse economy. The city is home to several major corporations, including Fannie Mae, Lockheed Martin, and Marriott International. The city is also home to several government agencies, including the Department of Defense, the Department of Homeland Security, and the Department of State.
The city is a major center of tourism, with millions of visitors each year. The city is home to several major attractions, including the Smithsonian Institution, the National Mall, and the White House. The city is also home to several professional sports teams, including the Washington Nationals baseball team and the Washington Redskins football team.
Demographics
As of 2020, the District of Columbia had a population of 705,749. The city is racially and ethnically diverse, with a majority of the population identifying as African American (47.3%), followed by White (37.2%), Hispanic or Latino (9.2%), and Asian (4.3%). The city is also home to a large immigrant population, with over 20% of the population born outside of the United States.
The city has a median household income of $77,649, and a poverty rate of 16.3%. The city is home to several universities, including Georgetown University, George Washington University, and American University.
Conclusion
The District of Columbia is the capital of the United States and the seat of the federal government. It is located on the east coast of the United States, between the states of Maryland and Virginia. The city was established in 1790 and was designed by Pierre Charles L’Enfant. The city has a strong and diverse economy, and is a major center of tourism. The city is racially and ethnically diverse, with a majority of the population identifying as African American. The city is home to several universities, professional sports teams, and major attractions.
Common Questions
When was District Of Columbia Incorporated?
District Of Columbia was Incorporated into the Union on Jun 16, 1790.
What is the Total Area of District Of Columbia?
Total Area of District Of Columbia is 68 Square Miles.
What is the Total Land Area of District Of Columbia?
Total Land Area of District Of Columbia is 61 Square Miles.
What is the Total Water Area of District Of Columbia?
Total Water Area of District Of Columbia is 7 Square Miles.
What is the Average Elevation in District Of Columbia?
Average Elevation in District Of Columbia is 20 Feet.
What is the Highest Elevation in District Of Columbia?
Highest Elevation in District Of Columbia is 409 Feet.
What is the Lowest Elevation in District Of Columbia?
Lowest Elevation in District Of Columbia is 0 Feet.
What is the Population Density in District Of Columbia?
Population Density in District Of Columbia is 10,993.2 People per Square Mile.
What is Per Capita Income in District Of Columbia?
Per Capita income in District Of Columbia is $71,297.
What is the Median Family Income in District Of Columbia?
Median Family Income in District Of Columbia is $142,328.
What is the Median Household income in District Of Columbia?
Median Household Income in District Of Columbia is $101,722.
What is Income or Wage Gap in District Of Columbia?
Income or Wage Gap in District Of Columbia is 13.7%.
Women in District Of Columbia earn 86.3 cents for every dollar earned by a man.
What is Family Income Deficit in District Of Columbia?
Family Income Deficit in District Of Columbia is $13,486.
Families that are below poverty line in District Of Columbia earn $13,486 less on average than the poverty threshold level.
What is Inequality or Gini Index in District Of Columbia?
Inequality or Gini Index in District Of Columbia is 0.52.
What is the Total Population of District Of Columbia?
Total Population of District Of Columbia is 670,587.
What is the Total Male Population of District Of Columbia?
Total Male Population of District Of Columbia is 320,797.
What is the Total Female Population of District Of Columbia?
Total Female Population of District Of Columbia is 349,790.
What is the Ratio of Males per 100 Females in District Of Columbia?
There are 91.71 Males per 100 Females in District Of Columbia.
What is the Ratio of Females per 100 Males in District Of Columbia?
There are 109.04 Females per 100 Males in District Of Columbia.
What is the Median Population Age in District Of Columbia?
Median Population Age in District Of Columbia is 34.8 Years.
What is the Average Family Size in District Of Columbia
Average Family Size in District Of Columbia is 3.0 People.
What is the Average Household Size in District Of Columbia
Average Household Size in District Of Columbia is 2.0 People.
How Large is the Labor Force in District Of Columbia?
There are 400,882 People in the Labor Forcein in District Of Columbia.
What is the Percentage of People in the Labor Force in District Of Columbia?
72.0% of People are in the Labor Force in District Of Columbia.
What is the Unemployment Rate in District Of Columbia?
Unemployment Rate in District Of Columbia is 7.1%.