Cities with the Highest Percentage of Korean Population in California
RELATED REPORTS & OPTIONS
Korean
California
Compare Cities
Map of Cities with the Highest Percentage of Korean Population in California
0.00%
100.00%
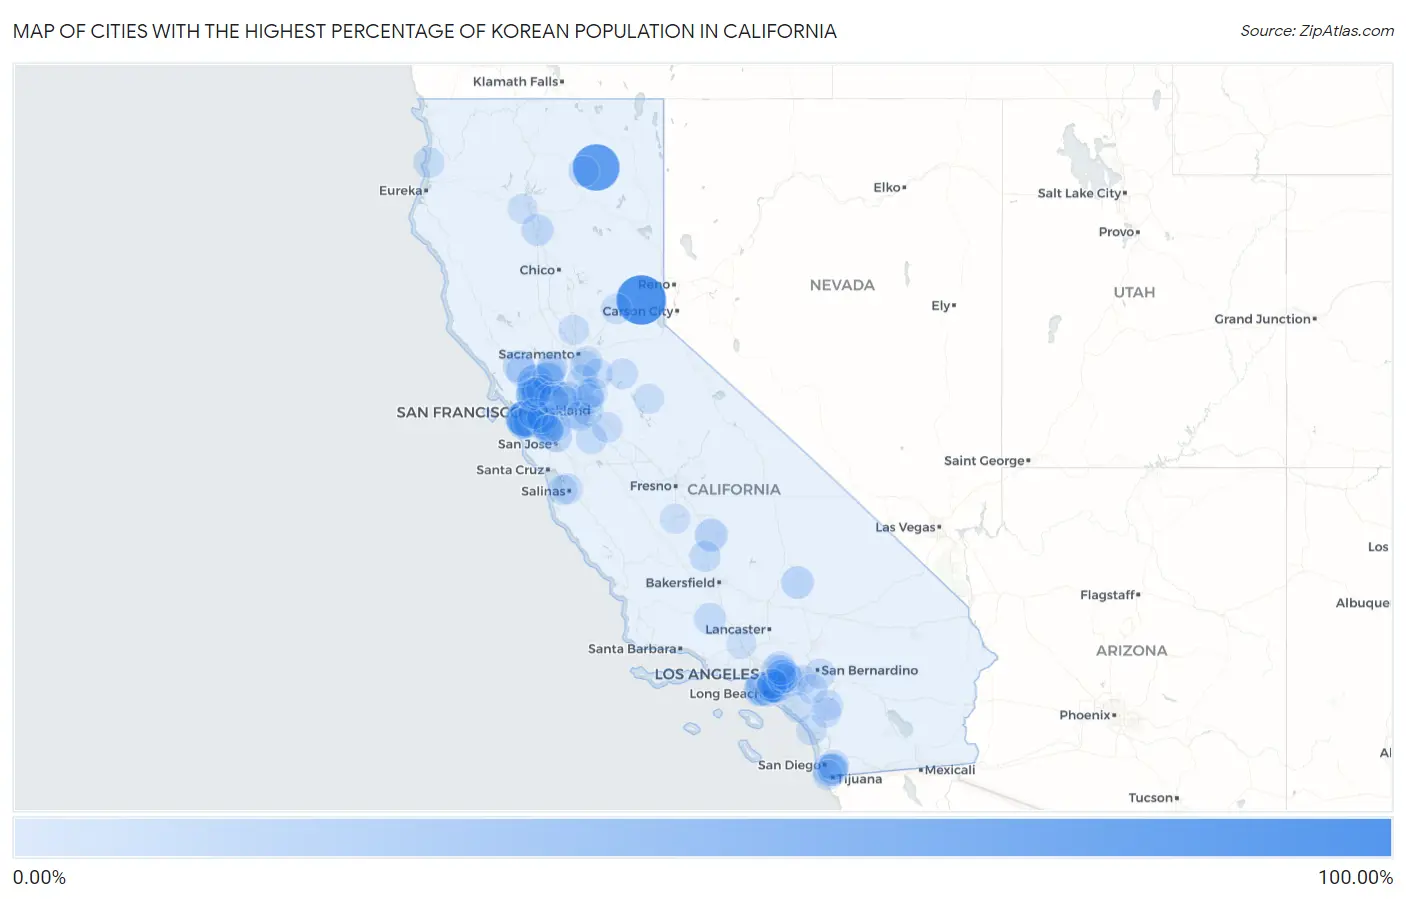
Cities with the Highest Percentage of Korean Population in California
| City | Korean | vs State | vs National | |
| 1. | Soda Springs | 100.00% | 4.29%(+95.7)#1 | 1.31%(+98.7)#1 |
| 2. | Nubieber | 85.71% | 4.29%(+81.4)#2 | 1.31%(+84.4)#4 |
| 3. | Knights Ferry | 55.56% | 4.29%(+51.3)#3 | 1.31%(+54.2)#18 |
| 4. | Daly City | 32.65% | 4.29%(+28.4)#4 | 1.31%(+31.3)#55 |
| 5. | American Canyon | 31.70% | 4.29%(+27.4)#5 | 1.31%(+30.4)#58 |
| 6. | Broadmoor | 26.75% | 4.29%(+22.5)#6 | 1.31%(+25.4)#83 |
| 7. | Colma | 26.53% | 4.29%(+22.2)#7 | 1.31%(+25.2)#86 |
| 8. | South San Francisco | 23.03% | 4.29%(+18.7)#8 | 1.31%(+21.7)#104 |
| 9. | Carson | 22.92% | 4.29%(+18.6)#9 | 1.31%(+21.6)#107 |
| 10. | Vallejo | 21.77% | 4.29%(+17.5)#10 | 1.31%(+20.5)#113 |
| 11. | Hercules | 20.69% | 4.29%(+16.4)#11 | 1.31%(+19.4)#122 |
| 12. | West Carson | 20.09% | 4.29%(+15.8)#12 | 1.31%(+18.8)#127 |
| 13. | Union City | 19.65% | 4.29%(+15.4)#13 | 1.31%(+18.3)#130 |
| 14. | Poplar Cotton Center | 18.82% | 4.29%(+14.5)#14 | 1.31%(+17.5)#134 |
| 15. | Johannesburg | 18.09% | 4.29%(+13.8)#15 | 1.31%(+16.8)#139 |
| 16. | Rodeo | 17.97% | 4.29%(+13.7)#16 | 1.31%(+16.7)#141 |
| 17. | Cerritos | 17.42% | 4.29%(+13.1)#17 | 1.31%(+16.1)#142 |
| 18. | National City | 17.23% | 4.29%(+12.9)#18 | 1.31%(+15.9)#147 |
| 19. | Artesia | 17.18% | 4.29%(+12.9)#19 | 1.31%(+15.9)#148 |
| 20. | Suisun City | 16.36% | 4.29%(+12.1)#20 | 1.31%(+15.0)#157 |
| 21. | Mountain House | 16.13% | 4.29%(+11.8)#21 | 1.31%(+14.8)#160 |
| 22. | Bend | 14.98% | 4.29%(+10.7)#22 | 1.31%(+13.7)#176 |
| 23. | La Palma | 14.88% | 4.29%(+10.6)#23 | 1.31%(+13.6)#177 |
| 24. | Kenwood | 14.78% | 4.29%(+10.5)#24 | 1.31%(+13.5)#178 |
| 25. | Milpitas | 14.49% | 4.29%(+10.2)#25 | 1.31%(+13.2)#182 |
| 26. | Harmony Grove | 14.17% | 4.29%(+9.88)#26 | 1.31%(+12.9)#185 |
| 27. | Pittsburg | 14.15% | 4.29%(+9.86)#27 | 1.31%(+12.8)#187 |
| 28. | Chula Vista | 14.03% | 4.29%(+9.74)#28 | 1.31%(+12.7)#188 |
| 29. | Fairfield | 13.90% | 4.29%(+9.61)#29 | 1.31%(+12.6)#190 |
| 30. | Pine Mountain Club | 13.58% | 4.29%(+9.29)#30 | 1.31%(+12.3)#194 |
| 31. | San Lorenzo | 13.53% | 4.29%(+9.24)#31 | 1.31%(+12.2)#195 |
| 32. | Hayward | 13.51% | 4.29%(+9.22)#32 | 1.31%(+12.2)#196 |
| 33. | Yermo | 13.35% | 4.29%(+9.06)#33 | 1.31%(+12.0)#201 |
| 34. | Lathrop | 13.35% | 4.29%(+9.06)#34 | 1.31%(+12.0)#202 |
| 35. | San Bruno | 13.00% | 4.29%(+8.71)#35 | 1.31%(+11.7)#209 |
| 36. | Delano | 12.64% | 4.29%(+8.35)#36 | 1.31%(+11.3)#212 |
| 37. | San Leandro | 11.53% | 4.29%(+7.24)#37 | 1.31%(+10.2)#229 |
| 38. | Walnut | 11.49% | 4.29%(+7.20)#38 | 1.31%(+10.2)#232 |
| 39. | Pinole | 11.38% | 4.29%(+7.09)#39 | 1.31%(+10.1)#233 |
| 40. | Newark | 11.29% | 4.29%(+7.00)#40 | 1.31%(+9.98)#238 |
| 41. | Diablo Grande | 11.22% | 4.29%(+6.93)#41 | 1.31%(+9.91)#241 |
| 42. | Elk Grove | 11.13% | 4.29%(+6.84)#42 | 1.31%(+9.82)#243 |
| 43. | Lincoln Village | 11.00% | 4.29%(+6.71)#43 | 1.31%(+9.69)#246 |
| 44. | Lakewood | 10.87% | 4.29%(+6.58)#44 | 1.31%(+9.56)#248 |
| 45. | North El Monte | 10.72% | 4.29%(+6.43)#45 | 1.31%(+9.41)#251 |
| 46. | French Valley | 10.68% | 4.29%(+6.39)#46 | 1.31%(+9.37)#252 |
| 47. | Big Lagoon | 10.58% | 4.29%(+6.29)#47 | 1.31%(+9.27)#254 |
| 48. | Eldridge | 10.55% | 4.29%(+6.26)#48 | 1.31%(+9.24)#255 |
| 49. | Pacifica | 10.42% | 4.29%(+6.13)#49 | 1.31%(+9.11)#257 |
| 50. | Bonita | 10.35% | 4.29%(+6.06)#50 | 1.31%(+9.04)#259 |
| 51. | Ashland | 10.35% | 4.29%(+6.06)#51 | 1.31%(+9.04)#260 |
| 52. | Thornton | 10.31% | 4.29%(+6.02)#52 | 1.31%(+9.00)#261 |
| 53. | Mountain Meadows | 10.24% | 4.29%(+5.95)#53 | 1.31%(+8.93)#266 |
| 54. | Hartley | 10.19% | 4.29%(+5.90)#54 | 1.31%(+8.88)#267 |
| 55. | Signal Hill | 10.16% | 4.29%(+5.87)#55 | 1.31%(+8.85)#268 |
| 56. | Mcarthur | 10.12% | 4.29%(+5.83)#56 | 1.31%(+8.81)#269 |
| 57. | Buena Park | 10.00% | 4.29%(+5.71)#57 | 1.31%(+8.69)#273 |
| 58. | Mokelumne Hill | 9.78% | 4.29%(+5.49)#58 | 1.31%(+8.47)#278 |
| 59. | Boronda | 9.66% | 4.29%(+5.36)#59 | 1.31%(+8.35)#279 |
| 60. | Dutch Flat | 9.62% | 4.29%(+5.33)#60 | 1.31%(+8.31)#282 |
| 61. | Stockton | 9.46% | 4.29%(+5.17)#61 | 1.31%(+8.15)#287 |
| 62. | West Covina | 9.14% | 4.29%(+4.85)#62 | 1.31%(+7.83)#299 |
| 63. | Cowan | 9.13% | 4.29%(+4.84)#63 | 1.31%(+7.82)#300 |
| 64. | Benicia | 8.98% | 4.29%(+4.69)#64 | 1.31%(+7.67)#305 |
| 65. | La Presa | 8.86% | 4.29%(+4.57)#65 | 1.31%(+7.55)#312 |
| 66. | Chino Hills | 8.83% | 4.29%(+4.54)#66 | 1.31%(+7.52)#313 |
| 67. | Nicolaus | 8.80% | 4.29%(+4.51)#67 | 1.31%(+7.49)#316 |
| 68. | Eastvale | 8.79% | 4.29%(+4.50)#68 | 1.31%(+7.48)#317 |
| 69. | Duarte | 8.67% | 4.29%(+4.38)#69 | 1.31%(+7.36)#320 |
| 70. | Camp Pendleton South | 8.54% | 4.29%(+4.25)#70 | 1.31%(+7.23)#326 |
| 71. | Alameda | 8.35% | 4.29%(+4.06)#71 | 1.31%(+7.04)#337 |
| 72. | Imperial Beach | 8.30% | 4.29%(+4.01)#72 | 1.31%(+6.99)#340 |
| 73. | Antioch | 8.19% | 4.29%(+3.90)#73 | 1.31%(+6.88)#344 |
| 74. | Tuolumne City | 8.17% | 4.29%(+3.88)#74 | 1.31%(+6.86)#348 |
| 75. | Temecula | 8.15% | 4.29%(+3.85)#75 | 1.31%(+6.84)#351 |
| 76. | Clay | 8.12% | 4.29%(+3.83)#76 | 1.31%(+6.81)#352 |
| 77. | Tracy | 8.08% | 4.29%(+3.79)#77 | 1.31%(+6.77)#358 |
| 78. | Diamond Bar | 8.06% | 4.29%(+3.77)#78 | 1.31%(+6.75)#361 |
| 79. | Loma Linda | 8.03% | 4.29%(+3.74)#79 | 1.31%(+6.72)#364 |
| 80. | Concord | 8.03% | 4.29%(+3.74)#80 | 1.31%(+6.72)#365 |
| 81. | Oakley | 7.91% | 4.29%(+3.62)#81 | 1.31%(+6.60)#370 |
| 82. | Marina | 7.86% | 4.29%(+3.56)#82 | 1.31%(+6.55)#377 |
| 83. | Lemoore | 7.84% | 4.29%(+3.55)#83 | 1.31%(+6.53)#378 |
| 84. | Sunol | 7.83% | 4.29%(+3.54)#84 | 1.31%(+6.52)#379 |
| 85. | Crockett | 7.81% | 4.29%(+3.52)#85 | 1.31%(+6.50)#381 |
| 86. | Brentwood | 7.79% | 4.29%(+3.49)#86 | 1.31%(+6.48)#383 |
| 87. | Rowland Heights | 7.65% | 4.29%(+3.36)#87 | 1.31%(+6.34)#389 |
| 88. | Castaic | 7.53% | 4.29%(+3.24)#88 | 1.31%(+6.22)#396 |
| 89. | Vineyard | 7.51% | 4.29%(+3.22)#89 | 1.31%(+6.20)#397 |
| 90. | Lake Mathews | 7.47% | 4.29%(+3.18)#90 | 1.31%(+6.16)#399 |
| 91. | Clayton | 7.36% | 4.29%(+3.07)#91 | 1.31%(+6.05)#402 |
| 92. | Ladera Ranch | 7.35% | 4.29%(+3.06)#92 | 1.31%(+6.04)#405 |
| 93. | Jones Valley | 7.33% | 4.29%(+3.04)#93 | 1.31%(+6.02)#407 |
| 94. | Fremont | 7.26% | 4.29%(+2.97)#94 | 1.31%(+5.95)#413 |
| 95. | Valinda | 7.21% | 4.29%(+2.92)#95 | 1.31%(+5.90)#417 |
| 96. | Norwalk | 7.18% | 4.29%(+2.89)#96 | 1.31%(+5.87)#421 |
| 97. | Centerville | 7.17% | 4.29%(+2.88)#97 | 1.31%(+5.86)#422 |
| 98. | Morada | 7.17% | 4.29%(+2.88)#98 | 1.31%(+5.86)#423 |
| 99. | Vincent | 7.11% | 4.29%(+2.82)#99 | 1.31%(+5.80)#428 |
| 100. | Vacaville | 7.08% | 4.29%(+2.79)#100 | 1.31%(+5.77)#431 |
Common Questions
What are the Top 10 Cities with the Highest Percentage of Korean Population in California?
Top 10 Cities with the Highest Percentage of Korean Population in California are:
#1
100.00%
#2
85.71%
#3
32.65%
#4
31.70%
#5
26.75%
#6
26.53%
#7
23.03%
#8
22.92%
#9
21.77%
#10
20.69%
What city has the Highest Percentage of Korean Population in California?
Soda Springs has the Highest Percentage of Korean Population in California with 100.00%.
What is the Percentage of Korean Population in the State of California?
Percentage of Korean Population in California is 4.29%.
What is the Percentage of Korean Population in the United States?
Percentage of Korean Population in the United States is 1.31%.