Cities with the Highest Percentage of Immigrants from South America in California
RELATED REPORTS & OPTIONS
South America
California
Compare Cities
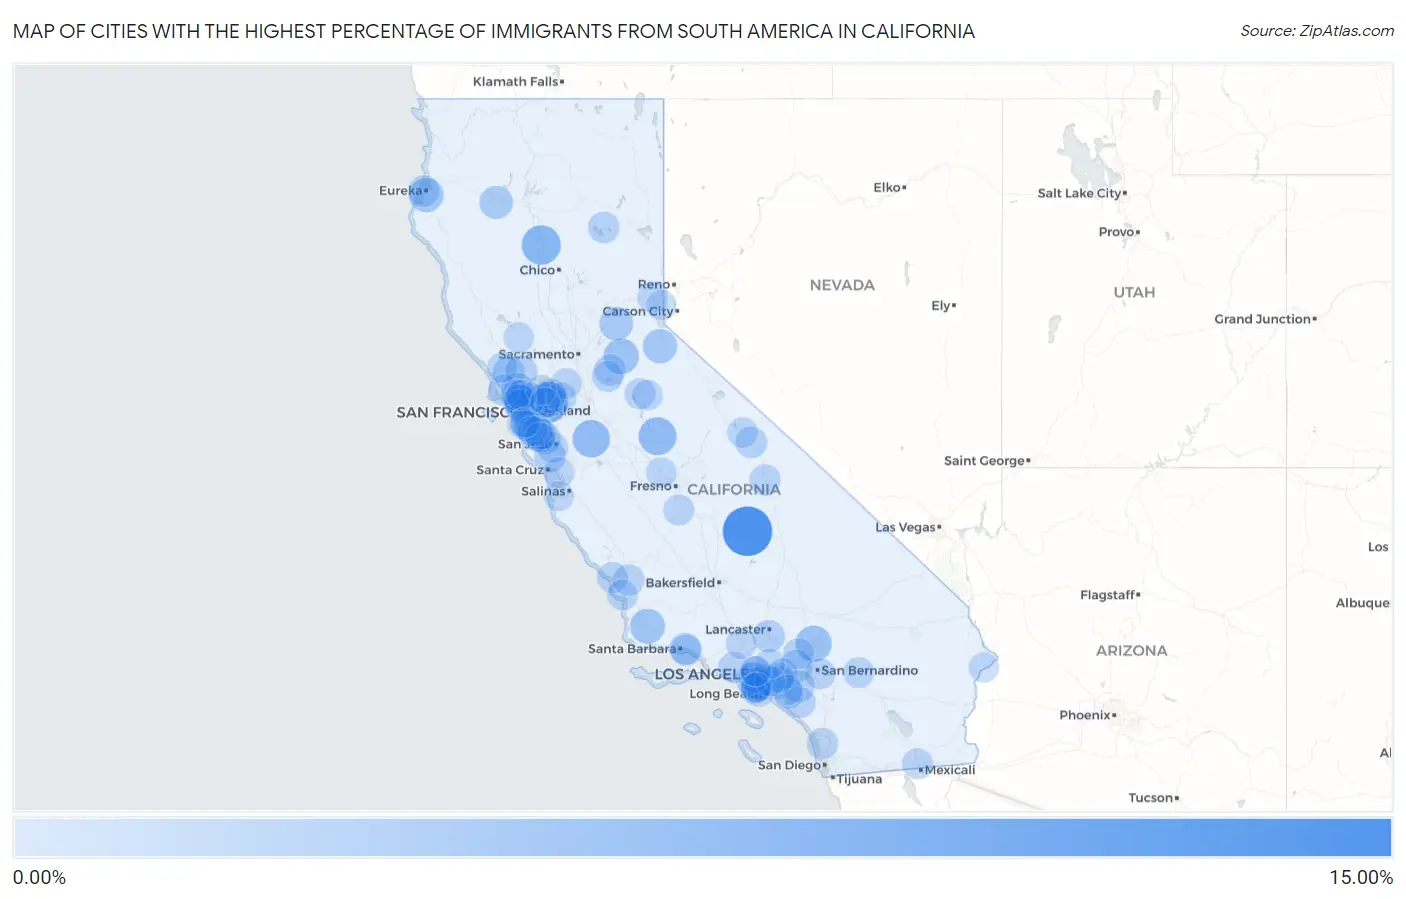
Map of Cities with the Highest Percentage of Immigrants from South America in California
0.00%
15.00%
Cities with the Highest Percentage of Immigrants from South America in California
| City | South America | vs State | vs National | |
| 1. | Ponderosa | 13.79% | 0.74%(+13.1)#341 | 1.10%(+12.7)#1,081 |
| 2. | Shell Ridge | 8.17% | 0.74%(+7.43)#342 | 1.10%(+7.07)#1,082 |
| 3. | Gerber | 7.10% | 0.74%(+6.37)#343 | 1.10%(+6.01)#1,083 |
| 4. | Catheys Valley | 6.22% | 0.74%(+5.49)#857 | 1.10%(+5.13)#5,212 |
| 5. | Tiburon | 5.89% | 0.74%(+5.15)#1,141 | 1.10%(+4.79)#10,641 |
| 6. | Diablo Grande | 5.89% | 0.74%(+5.15)#1,142 | 1.10%(+4.79)#10,642 |
| 7. | Mountain View Acres | 5.15% | 0.74%(+4.41)#1,143 | 1.10%(+4.05)#10,643 |
| 8. | River Pines | 4.72% | 0.74%(+3.99)#1,144 | 1.10%(+3.62)#10,644 |
| 9. | Los Alamos | 4.44% | 0.74%(+3.70)#1,145 | 1.10%(+3.34)#10,645 |
| 10. | Pine Hills | 4.05% | 0.74%(+3.31)#1,216 | 1.10%(+2.95)#13,989 |
| 11. | Kirkwood | 4.02% | 0.74%(+3.28)#1,217 | 1.10%(+2.92)#13,990 |
| 12. | North Fair Oaks | 3.75% | 0.74%(+3.01)#1,218 | 1.10%(+2.65)#13,991 |
| 13. | Contra Costa Centre | 3.68% | 0.74%(+2.94)#1,219 | 1.10%(+2.58)#13,992 |
| 14. | Foresthill | 3.65% | 0.74%(+2.91)#1,220 | 1.10%(+2.55)#13,993 |
| 15. | Douglas City | 3.35% | 0.74%(+2.62)#1,221 | 1.10%(+2.26)#13,994 |
| 16. | Lawndale | 3.34% | 0.74%(+2.60)#1,222 | 1.10%(+2.24)#13,995 |
| 17. | East Whittier | 3.01% | 0.74%(+2.27)#1,223 | 1.10%(+1.91)#13,996 |
| 18. | San Antonio Heights | 2.88% | 0.74%(+2.15)#1,224 | 1.10%(+1.79)#13,997 |
| 19. | El Macero | 2.86% | 0.74%(+2.13)#1,225 | 1.10%(+1.76)#13,998 |
| 20. | Desert View Highlands | 2.72% | 0.74%(+1.98)#1,226 | 1.10%(+1.62)#13,999 |
| 21. | Corte Madera | 2.71% | 0.74%(+1.97)#1,227 | 1.10%(+1.61)#14,000 |
| 22. | Cotati | 2.64% | 0.74%(+1.90)#1,228 | 1.10%(+1.54)#14,001 |
| 23. | Eldridge | 2.60% | 0.74%(+1.87)#1,229 | 1.10%(+1.50)#14,002 |
| 24. | Coronita | 2.60% | 0.74%(+1.86)#1,230 | 1.10%(+1.50)#14,003 |
| 25. | Novato | 2.59% | 0.74%(+1.86)#1,231 | 1.10%(+1.49)#14,004 |
| 26. | Lexington Hills | 2.47% | 0.74%(+1.74)#1,232 | 1.10%(+1.38)#14,005 |
| 27. | Marina Del Rey | 2.40% | 0.74%(+1.67)#1,233 | 1.10%(+1.31)#14,006 |
| 28. | West Bishop | 2.39% | 0.74%(+1.65)#1,234 | 1.10%(+1.29)#14,007 |
| 29. | Fairhaven | 2.35% | 0.74%(+1.61)#1,235 | 1.10%(+1.25)#14,008 |
| 30. | Richmond | 2.30% | 0.74%(+1.57)#1,236 | 1.10%(+1.21)#14,009 |
| 31. | Mountain View | 2.30% | 0.74%(+1.56)#1,237 | 1.10%(+1.20)#14,010 |
| 32. | Montecito | 2.29% | 0.74%(+1.55)#1,238 | 1.10%(+1.19)#14,011 |
| 33. | Clear Creek | 2.28% | 0.74%(+1.54)#1,239 | 1.10%(+1.18)#14,012 |
| 34. | Kentfield | 2.23% | 0.74%(+1.49)#1,240 | 1.10%(+1.13)#14,013 |
| 35. | San Mateo | 2.21% | 0.74%(+1.48)#1,241 | 1.10%(+1.11)#14,014 |
| 36. | Ione | 2.20% | 0.74%(+1.46)#1,242 | 1.10%(+1.10)#14,015 |
| 37. | Concord | 2.19% | 0.74%(+1.46)#1,243 | 1.10%(+1.09)#14,016 |
| 38. | Rancho Santa Fe | 2.18% | 0.74%(+1.44)#1,244 | 1.10%(+1.08)#14,017 |
| 39. | Garden Farms | 2.16% | 0.74%(+1.43)#1,245 | 1.10%(+1.06)#14,018 |
| 40. | Larkspur | 2.14% | 0.74%(+1.40)#1,246 | 1.10%(+1.04)#14,019 |
| 41. | Summerland | 2.12% | 0.74%(+1.38)#1,247 | 1.10%(+1.02)#14,020 |
| 42. | Independence | 2.12% | 0.74%(+1.38)#1,248 | 1.10%(+1.02)#14,021 |
| 43. | Hawthorne | 2.11% | 0.74%(+1.37)#1,249 | 1.10%(+1.01)#14,022 |
| 44. | Point Reyes Station | 2.09% | 0.74%(+1.35)#1,250 | 1.10%(+0.990)#14,023 |
| 45. | Rancho Santa Margarita | 2.06% | 0.74%(+1.33)#1,251 | 1.10%(+0.967)#14,024 |
| 46. | Camanche Village | 2.06% | 0.74%(+1.32)#1,252 | 1.10%(+0.958)#14,025 |
| 47. | Campbell | 2.04% | 0.74%(+1.30)#1,253 | 1.10%(+0.942)#14,026 |
| 48. | Agoura Hills | 2.04% | 0.74%(+1.30)#1,254 | 1.10%(+0.938)#14,027 |
| 49. | Wrightwood | 2.02% | 0.74%(+1.28)#1,255 | 1.10%(+0.919)#14,028 |
| 50. | Menlo Park | 2.01% | 0.74%(+1.27)#1,256 | 1.10%(+0.912)#14,029 |
| 51. | Cayucos | 1.99% | 0.74%(+1.25)#1,257 | 1.10%(+0.892)#14,030 |
| 52. | Strawberry Cdp Marin County | 1.99% | 0.74%(+1.25)#1,258 | 1.10%(+0.890)#14,031 |
| 53. | Columbia | 1.97% | 0.74%(+1.23)#1,259 | 1.10%(+0.870)#14,032 |
| 54. | Marin City | 1.96% | 0.74%(+1.22)#1,260 | 1.10%(+0.861)#14,033 |
| 55. | Walnut Park | 1.95% | 0.74%(+1.21)#1,261 | 1.10%(+0.851)#14,034 |
| 56. | Morongo Valley | 1.89% | 0.74%(+1.15)#1,262 | 1.10%(+0.791)#14,035 |
| 57. | Lomita | 1.88% | 0.74%(+1.15)#1,263 | 1.10%(+0.784)#14,036 |
| 58. | Hardwick | 1.87% | 0.74%(+1.14)#1,264 | 1.10%(+0.777)#14,037 |
| 59. | Heber | 1.86% | 0.74%(+1.12)#1,265 | 1.10%(+0.760)#14,038 |
| 60. | West Covina | 1.86% | 0.74%(+1.12)#1,266 | 1.10%(+0.758)#14,039 |
| 61. | Loma Linda | 1.83% | 0.74%(+1.09)#1,267 | 1.10%(+0.730)#14,040 |
| 62. | Avila Beach | 1.81% | 0.74%(+1.08)#1,268 | 1.10%(+0.715)#14,041 |
| 63. | Castaic | 1.81% | 0.74%(+1.08)#1,269 | 1.10%(+0.715)#14,042 |
| 64. | Gardena | 1.81% | 0.74%(+1.08)#1,270 | 1.10%(+0.714)#14,043 |
| 65. | Culver City | 1.79% | 0.74%(+1.05)#1,271 | 1.10%(+0.691)#14,044 |
| 66. | Rio Vista | 1.79% | 0.74%(+1.05)#1,272 | 1.10%(+0.688)#14,045 |
| 67. | Torrance | 1.78% | 0.74%(+1.05)#1,273 | 1.10%(+0.685)#14,046 |
| 68. | El Sobrante Cdp Contra Costa County | 1.78% | 0.74%(+1.04)#1,274 | 1.10%(+0.683)#14,047 |
| 69. | Sleepy Hollow | 1.73% | 0.74%(+0.991)#1,275 | 1.10%(+0.630)#14,048 |
| 70. | Burlingame | 1.71% | 0.74%(+0.970)#1,276 | 1.10%(+0.608)#14,049 |
| 71. | Sebastopol | 1.69% | 0.74%(+0.956)#1,277 | 1.10%(+0.594)#14,050 |
| 72. | Parkwood | 1.69% | 0.74%(+0.952)#1,278 | 1.10%(+0.590)#14,051 |
| 73. | North Tustin | 1.69% | 0.74%(+0.951)#1,279 | 1.10%(+0.589)#14,052 |
| 74. | Villa Park | 1.69% | 0.74%(+0.949)#1,280 | 1.10%(+0.587)#14,053 |
| 75. | La Selva Beach | 1.68% | 0.74%(+0.945)#1,281 | 1.10%(+0.583)#14,054 |
| 76. | Millbrae | 1.68% | 0.74%(+0.942)#1,282 | 1.10%(+0.580)#14,055 |
| 77. | El Centro Naval Air Facility | 1.67% | 0.74%(+0.933)#1,283 | 1.10%(+0.571)#14,056 |
| 78. | Paradise | 1.64% | 0.74%(+0.903)#1,284 | 1.10%(+0.541)#14,057 |
| 79. | Pacifica | 1.63% | 0.74%(+0.898)#1,285 | 1.10%(+0.536)#14,058 |
| 80. | Mono Vista | 1.63% | 0.74%(+0.893)#1,286 | 1.10%(+0.532)#14,059 |
| 81. | Truckee | 1.63% | 0.74%(+0.890)#1,287 | 1.10%(+0.528)#14,060 |
| 82. | Hidden Valley Lake | 1.62% | 0.74%(+0.887)#1,288 | 1.10%(+0.525)#14,061 |
| 83. | Hacienda Heights | 1.62% | 0.74%(+0.879)#1,289 | 1.10%(+0.517)#14,062 |
| 84. | Santa Venetia | 1.61% | 0.74%(+0.875)#1,290 | 1.10%(+0.513)#14,063 |
| 85. | Redwood City | 1.60% | 0.74%(+0.862)#1,291 | 1.10%(+0.500)#14,064 |
| 86. | Belmont | 1.59% | 0.74%(+0.852)#1,292 | 1.10%(+0.491)#14,065 |
| 87. | Beverly Hills | 1.59% | 0.74%(+0.850)#1,293 | 1.10%(+0.488)#14,066 |
| 88. | Bay Point | 1.57% | 0.74%(+0.829)#1,294 | 1.10%(+0.467)#14,067 |
| 89. | Antioch | 1.52% | 0.74%(+0.784)#1,295 | 1.10%(+0.422)#14,068 |
| 90. | Stanford | 1.52% | 0.74%(+0.782)#1,296 | 1.10%(+0.420)#14,069 |
| 91. | Downey | 1.51% | 0.74%(+0.775)#1,297 | 1.10%(+0.413)#14,070 |
| 92. | Altadena | 1.51% | 0.74%(+0.769)#1,298 | 1.10%(+0.407)#14,071 |
| 93. | West Hollywood | 1.50% | 0.74%(+0.768)#1,299 | 1.10%(+0.406)#14,072 |
| 94. | San Bruno | 1.49% | 0.74%(+0.756)#1,300 | 1.10%(+0.394)#14,073 |
| 95. | Del Rey Oaks | 1.49% | 0.74%(+0.753)#1,301 | 1.10%(+0.391)#14,074 |
| 96. | Redondo Beach | 1.48% | 0.74%(+0.746)#1,302 | 1.10%(+0.384)#14,075 |
| 97. | Benicia | 1.47% | 0.74%(+0.735)#1,303 | 1.10%(+0.374)#14,076 |
| 98. | Kings Beach | 1.47% | 0.74%(+0.731)#1,304 | 1.10%(+0.369)#14,077 |
| 99. | Big River | 1.46% | 0.74%(+0.723)#1,305 | 1.10%(+0.361)#14,078 |
| 100. | Acalanes Ridge | 1.46% | 0.74%(+0.720)#1,306 | 1.10%(+0.359)#14,079 |
Common Questions
What are the Top 10 Cities with the Highest Percentage of Immigrants from South America in California?
Top 10 Cities with the Highest Percentage of Immigrants from South America in California are:
#1
13.79%
#2
8.17%
#3
7.10%
#4
6.22%
#5
5.89%
#6
5.89%
#7
5.15%
#8
4.72%
#9
4.44%
#10
4.05%
What city has the Highest Percentage of Immigrants from South America in California?
Ponderosa has the Highest Percentage of Immigrants from South America in California with 13.79%.
What is the Percentage of Immigrants from South America in the State of California?
Percentage of Immigrants from South America in California is 0.74%.
What is the Percentage of Immigrants from South America in the United States?
Percentage of Immigrants from South America in the United States is 1.10%.