Waukena, CA Map & Demographics
Waukena Map
Waukena Overview
$30,548
PER CAPITA INCOME
$110,714
AVG FAMILY INCOME
$78,750
AVG HOUSEHOLD INCOME
0.17
INEQUALITY / GINI INDEX
63
TOTAL POPULATION
50
MALE POPULATION
13
FEMALE POPULATION
384.62
MALES / 100 FEMALES
26.00
FEMALES / 100 MALES
44.5
MEDIAN AGE
4.5
AVG FAMILY SIZE
3.0
AVG HOUSEHOLD SIZE
36
LABOR FORCE [ PEOPLE ]
64.3%
PERCENT IN LABOR FORCE
25.0%
UNEMPLOYMENT RATE
Waukena Area Codes
Income in Waukena
Income Overview in Waukena
Per Capita Income in Waukena is $30,548, while median incomes of families and households are $110,714 and $78,750 respectively.
| Characteristic | Number | Measure |
| Per Capita Income | 63 | $30,548 |
| Median Family Income | 12 | $110,714 |
| Mean Family Income | 12 | $100,275 |
| Median Household Income | 21 | $78,750 |
| Mean Household Income | 21 | $85,952 |
| Income Deficit | 12 | $0 |
| Wage / Income Gap (%) | 63 | 0.00% |
| Wage / Income Gap ($) | 63 | 100.00¢ per $1 |
| Gini / Inequality Index | 63 | 0.17 |
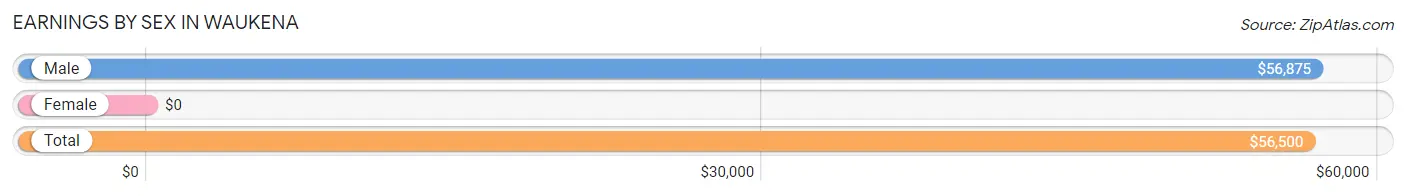
Earnings by Sex in Waukena
| Sex | Number | Average Earnings |
| Male | 22 (73.3%) | $56,875 |
| Female | 8 (26.7%) | $0 |
| Total | 30 (100.0%) | $56,500 |
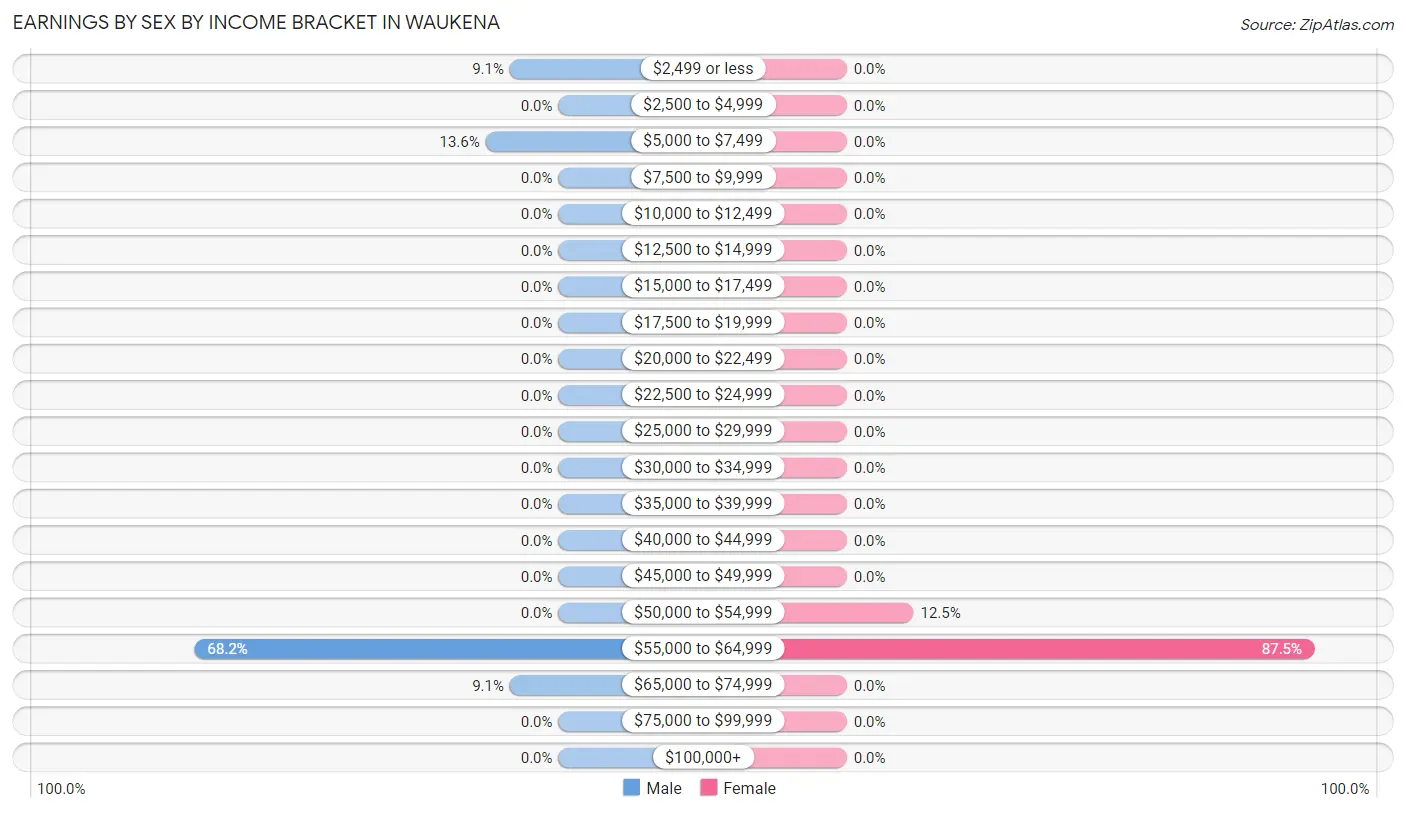
Earnings by Sex by Income Bracket in Waukena
The most common earnings brackets in Waukena are $55,000 to $64,999 for men (15 | 68.2%) and $55,000 to $64,999 for women (7 | 87.5%).
| Income | Male | Female |
| $2,499 or less | 2 (9.1%) | 0 (0.0%) |
| $2,500 to $4,999 | 0 (0.0%) | 0 (0.0%) |
| $5,000 to $7,499 | 3 (13.6%) | 0 (0.0%) |
| $7,500 to $9,999 | 0 (0.0%) | 0 (0.0%) |
| $10,000 to $12,499 | 0 (0.0%) | 0 (0.0%) |
| $12,500 to $14,999 | 0 (0.0%) | 0 (0.0%) |
| $15,000 to $17,499 | 0 (0.0%) | 0 (0.0%) |
| $17,500 to $19,999 | 0 (0.0%) | 0 (0.0%) |
| $20,000 to $22,499 | 0 (0.0%) | 0 (0.0%) |
| $22,500 to $24,999 | 0 (0.0%) | 0 (0.0%) |
| $25,000 to $29,999 | 0 (0.0%) | 0 (0.0%) |
| $30,000 to $34,999 | 0 (0.0%) | 0 (0.0%) |
| $35,000 to $39,999 | 0 (0.0%) | 0 (0.0%) |
| $40,000 to $44,999 | 0 (0.0%) | 0 (0.0%) |
| $45,000 to $49,999 | 0 (0.0%) | 0 (0.0%) |
| $50,000 to $54,999 | 0 (0.0%) | 1 (12.5%) |
| $55,000 to $64,999 | 15 (68.2%) | 7 (87.5%) |
| $65,000 to $74,999 | 2 (9.1%) | 0 (0.0%) |
| $75,000 to $99,999 | 0 (0.0%) | 0 (0.0%) |
| $100,000+ | 0 (0.0%) | 0 (0.0%) |
| Total | 22 (100.0%) | 8 (100.0%) |
Earnings by Sex by Educational Attainment in Waukena
| Educational Attainment | Male Income | Female Income |
| Less than High School | - | - |
| High School Diploma | - | - |
| College or Associate's Degree | - | - |
| Bachelor's Degree | - | - |
| Graduate Degree | - | - |
| Total | $57,188 | $0 |
Family Income in Waukena
Family Income Brackets in Waukena
According to the Waukena family income data, there are 8 families falling into the $100,000 to $149,999 income range, which is the most common income bracket and makes up 66.7% of all families.
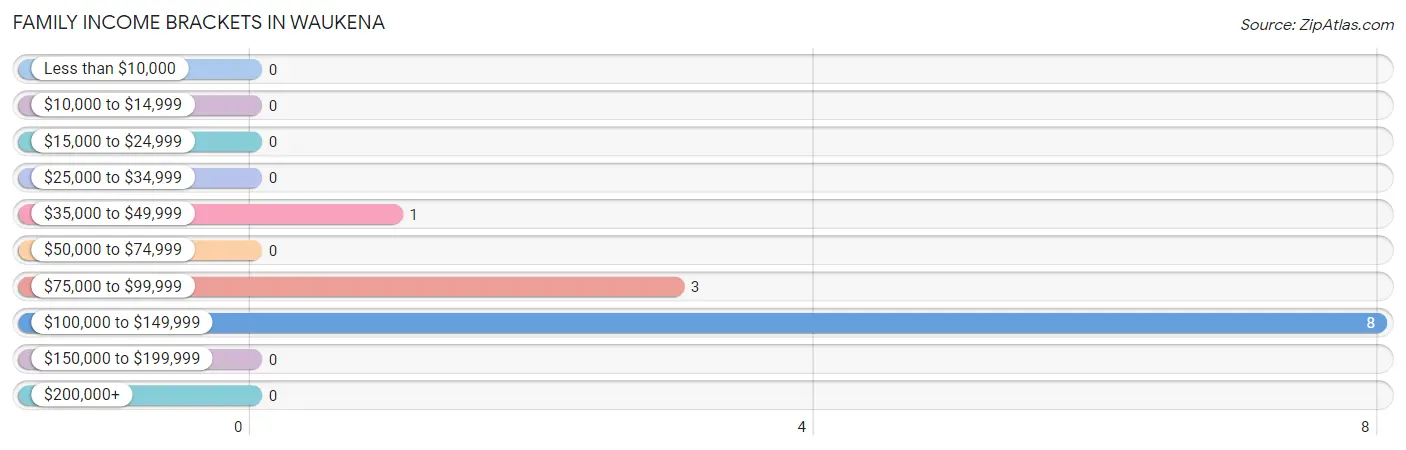
| Income Bracket | # Families | % Families |
| Less than $10,000 | 0 | 0.0% |
| $10,000 to $14,999 | 0 | 0.0% |
| $15,000 to $24,999 | 0 | 0.0% |
| $25,000 to $34,999 | 0 | 0.0% |
| $35,000 to $49,999 | 1 | 8.3% |
| $50,000 to $74,999 | 0 | 0.0% |
| $75,000 to $99,999 | 3 | 25.0% |
| $100,000 to $149,999 | 8 | 66.7% |
| $150,000 to $199,999 | 0 | 0.0% |
| $200,000+ | 0 | 0.0% |
Family Income by Famaliy Size in Waukena
2-person families (4 | 33.3%) account for the highest median family income in Waukena with $81,250 per family, while 2-person families (4 | 33.3%) have the highest median income of $40,625 per family member.
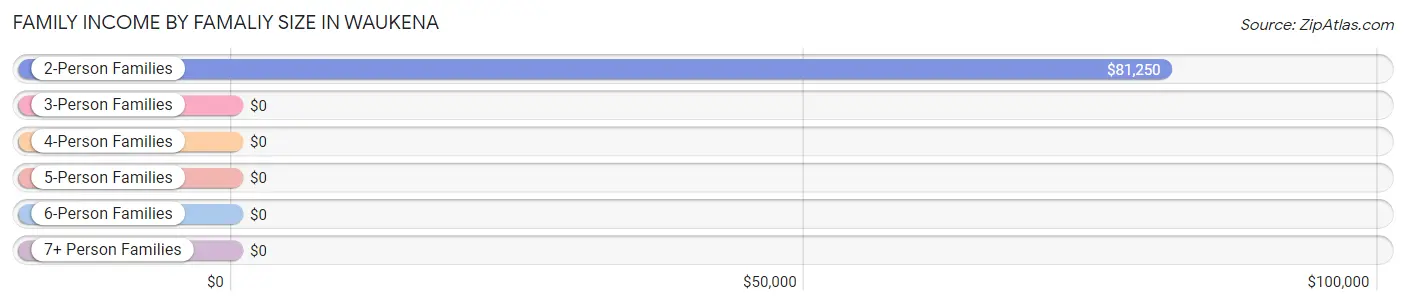
| Income Bracket | # Families | Median Income |
| 2-Person Families | 4 (33.3%) | $81,250 |
| 3-Person Families | 1 (8.3%) | $0 |
| 4-Person Families | 0 (0.0%) | $0 |
| 5-Person Families | 7 (58.3%) | $0 |
| 6-Person Families | 0 (0.0%) | $0 |
| 7+ Person Families | 0 (0.0%) | $0 |
| Total | 12 (100.0%) | $110,714 |
Family Income by Number of Earners in Waukena
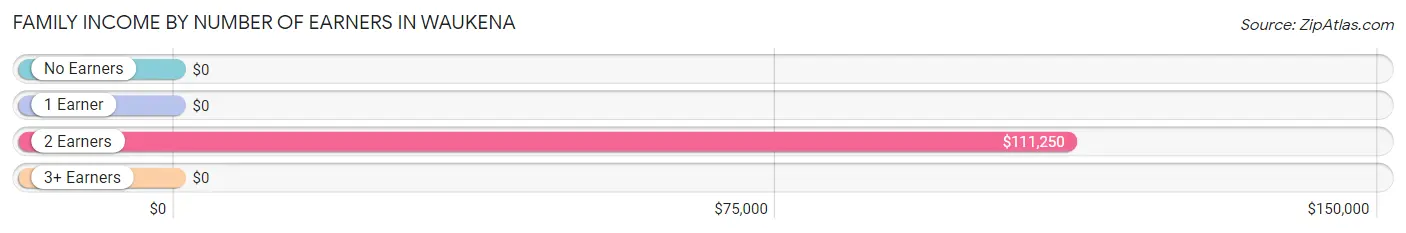
| Number of Earners | # Families | Median Income |
| No Earners | 1 (8.3%) | $0 |
| 1 Earner | 2 (16.7%) | $0 |
| 2 Earners | 9 (75.0%) | $111,250 |
| 3+ Earners | 0 (0.0%) | $0 |
| Total | 12 (100.0%) | $110,714 |
Household Income in Waukena
Household Income Brackets in Waukena
With 10 households falling in the category, the $75,000 to $99,999 income range is the most frequent in Waukena, accounting for 47.6% of all households.
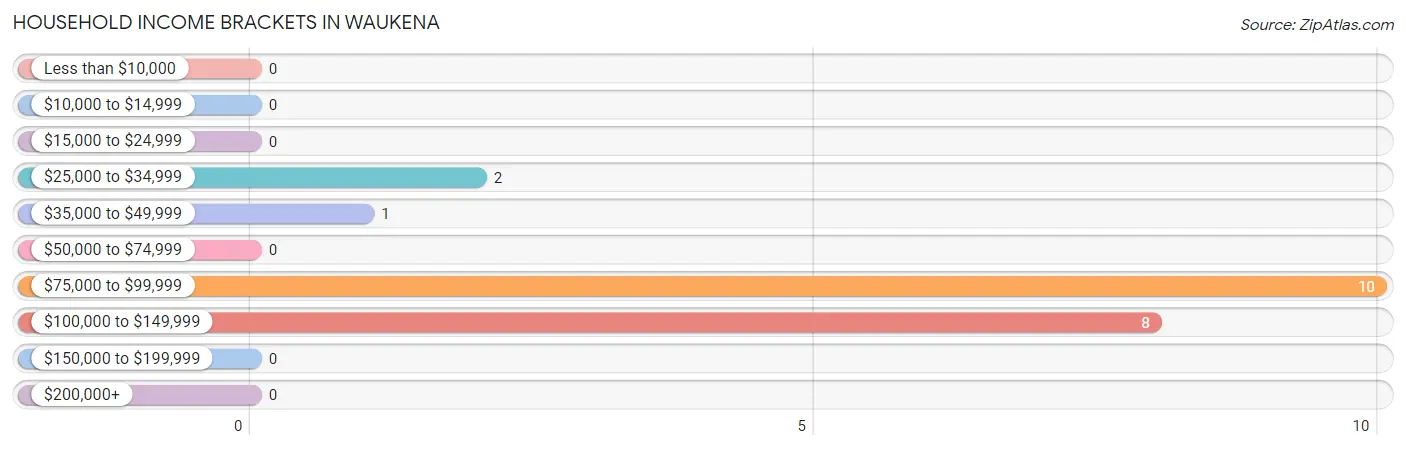
| Income Bracket | # Households | % Households |
| Less than $10,000 | 0 | 0.0% |
| $10,000 to $14,999 | 0 | 0.0% |
| $15,000 to $24,999 | 0 | 0.0% |
| $25,000 to $34,999 | 2 | 9.5% |
| $35,000 to $49,999 | 1 | 4.8% |
| $50,000 to $74,999 | 0 | 0.0% |
| $75,000 to $99,999 | 10 | 47.6% |
| $100,000 to $149,999 | 8 | 38.1% |
| $150,000 to $199,999 | 0 | 0.0% |
| $200,000+ | 0 | 0.0% |
Household Income by Householder Age in Waukena
| Income Bracket | # Households | Median Income |
| 15 to 24 Years | 0 (0.0%) | $0 |
| 25 to 44 Years | 7 (33.3%) | $0 |
| 45 to 64 Years | 8 (38.1%) | $0 |
| 65+ Years | 6 (28.6%) | $0 |
| Total | 21 (100.0%) | $78,750 |
Poverty in Waukena
Income Below Poverty by Sex and Age in Waukena
| Age Bracket | Male | Female |
| Under 5 Years | 0 (0.0%) | 0 (0.0%) |
| 5 Years | 0 (0.0%) | 0 (0.0%) |
| 6 to 11 Years | 0 (0.0%) | 0 (0.0%) |
| 12 to 14 Years | 0 (0.0%) | 0 (0.0%) |
| 15 Years | 0 (0.0%) | 0 (0.0%) |
| 16 and 17 Years | 0 (0.0%) | 0 (0.0%) |
| 18 to 24 Years | 0 (0.0%) | 0 (0.0%) |
| 25 to 34 Years | 0 (0.0%) | 0 (0.0%) |
| 35 to 44 Years | 0 (0.0%) | 0 (0.0%) |
| 45 to 54 Years | 0 (0.0%) | 0 (0.0%) |
| 55 to 64 Years | 0 (0.0%) | 0 (0.0%) |
| 65 to 74 Years | 0 (0.0%) | 0 (0.0%) |
| 75 Years and over | 0 (0.0%) | 0 (0.0%) |
| Total | 0 (0.0%) | 0 (0.0%) |
Income Above Poverty by Sex and Age in Waukena
According to the poverty statistics in Waukena, males aged 12 to 14 years and females aged 45 to 54 years are the age groups that are most secure financially, with 100.0% of males and 100.0% of females in these age groups living above the poverty line.
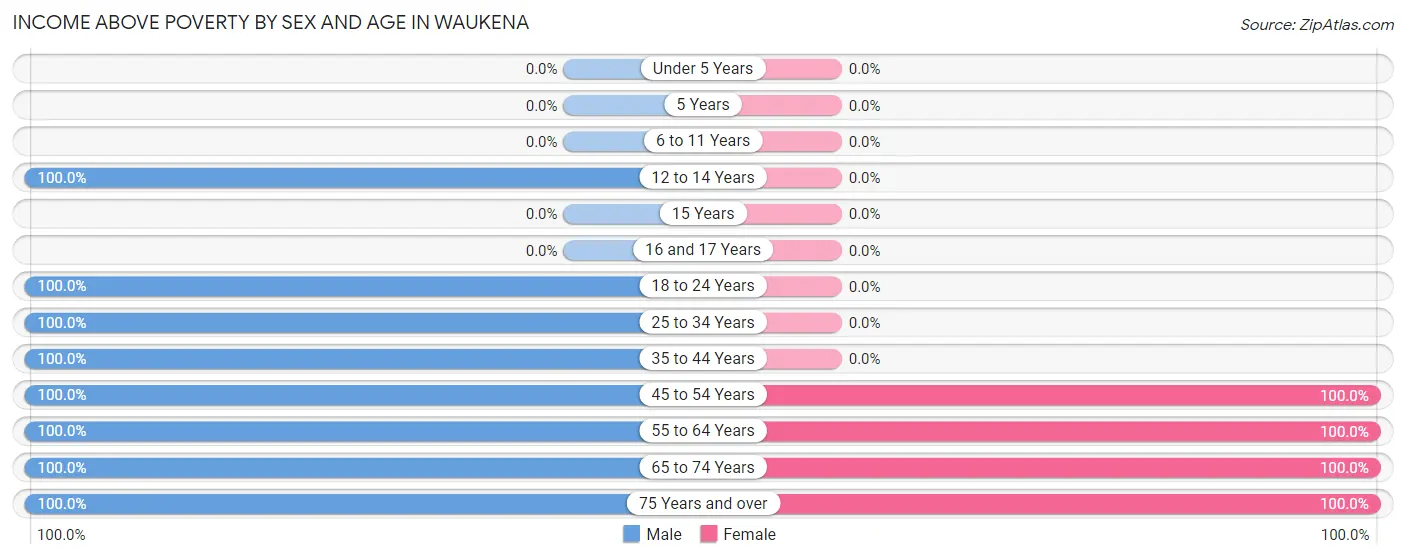
| Age Bracket | Male | Female |
| Under 5 Years | 0 (0.0%) | 0 (0.0%) |
| 5 Years | 0 (0.0%) | 0 (0.0%) |
| 6 to 11 Years | 0 (0.0%) | 0 (0.0%) |
| 12 to 14 Years | 7 (100.0%) | 0 (0.0%) |
| 15 Years | 0 (0.0%) | 0 (0.0%) |
| 16 and 17 Years | 0 (0.0%) | 0 (0.0%) |
| 18 to 24 Years | 12 (100.0%) | 0 (0.0%) |
| 25 to 34 Years | 9 (100.0%) | 0 (0.0%) |
| 35 to 44 Years | 7 (100.0%) | 0 (0.0%) |
| 45 to 54 Years | 2 (100.0%) | 7 (100.0%) |
| 55 to 64 Years | 8 (100.0%) | 1 (100.0%) |
| 65 to 74 Years | 3 (100.0%) | 1 (100.0%) |
| 75 Years and over | 2 (100.0%) | 4 (100.0%) |
| Total | 50 (100.0%) | 13 (100.0%) |
Income Below Poverty Among Married-Couple Families in Waukena
| Children | Above Poverty | Below Poverty |
| No Children | 4 (100.0%) | 0 (0.0%) |
| 1 or 2 Children | 7 (100.0%) | 0 (0.0%) |
| 3 or 4 Children | 0 (0.0%) | 0 (0.0%) |
| 5 or more Children | 0 (0.0%) | 0 (0.0%) |
| Total | 11 (100.0%) | 0 (0.0%) |
Income Below Poverty Among Single-Parent Households in Waukena
| Children | Single Father | Single Mother |
| No Children | 0 (0.0%) | 0 (0.0%) |
| 1 or 2 Children | 0 (0.0%) | 0 (0.0%) |
| 3 or 4 Children | 0 (0.0%) | 0 (0.0%) |
| 5 or more Children | 0 (0.0%) | 0 (0.0%) |
| Total | 0 (0.0%) | 0 (0.0%) |
Income Below Poverty Among Married-Couple vs Single-Parent Households in Waukena
| Children | Married-Couple Families | Single-Parent Households |
| No Children | 0 (0.0%) | 0 (0.0%) |
| 1 or 2 Children | 0 (0.0%) | 0 (0.0%) |
| 3 or 4 Children | 0 (0.0%) | 0 (0.0%) |
| 5 or more Children | 0 (0.0%) | 0 (0.0%) |
| Total | 0 (0.0%) | 0 (0.0%) |
Race in Waukena
The most populous races in Waukena are Hispanic or Latino (53 | 84.1%), Two or more Races (45 | 71.4%), and White / Caucasian (17 | 27.0%).
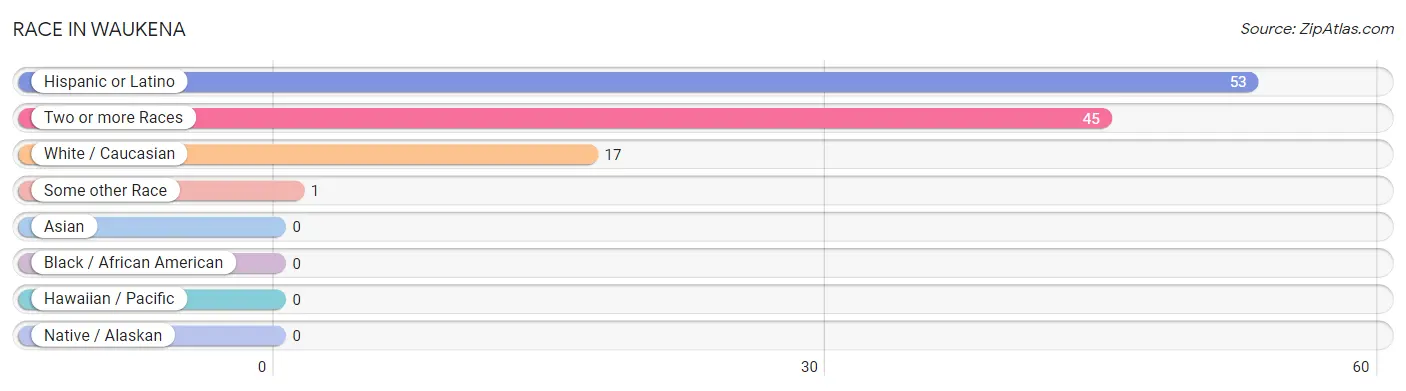
| Race | # Population | % Population |
| Asian | 0 | 0.0% |
| Black / African American | 0 | 0.0% |
| Hawaiian / Pacific | 0 | 0.0% |
| Hispanic or Latino | 53 | 84.1% |
| Native / Alaskan | 0 | 0.0% |
| White / Caucasian | 17 | 27.0% |
| Two or more Races | 45 | 71.4% |
| Some other Race | 1 | 1.6% |
| Total | 63 | 100.0% |
Ancestry in Waukena
The most populous ancestries reported in Waukena are Mexican (50 | 79.4%), Irish (33 | 52.4%), Portuguese (8 | 12.7%), German (7 | 11.1%), and Italian (3 | 4.8%), together accounting for 160.3% of all Waukena residents.
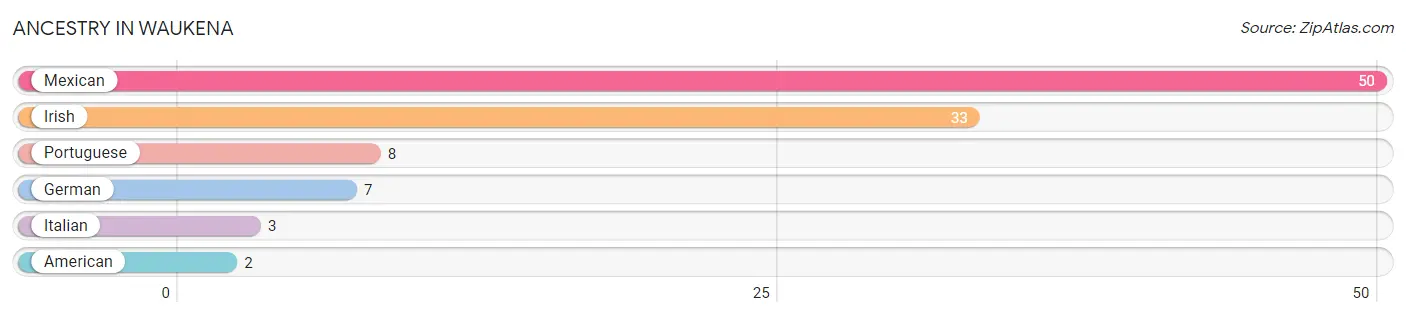
| Ancestry | # Population | % Population |
| American | 2 | 3.2% |
| German | 7 | 11.1% |
| Irish | 33 | 52.4% |
| Italian | 3 | 4.8% |
| Mexican | 50 | 79.4% |
| Portuguese | 8 | 12.7% | View All 6 Rows |
Immigrants in Waukena

| Immigration Origin | # Population | % Population | View All 0 Rows |
Sex and Age in Waukena
Sex and Age in Waukena
The most populous age groups in Waukena are 15 to 19 Years (10 | 20.0%) for men and 50 to 54 Years (7 | 53.8%) for women.
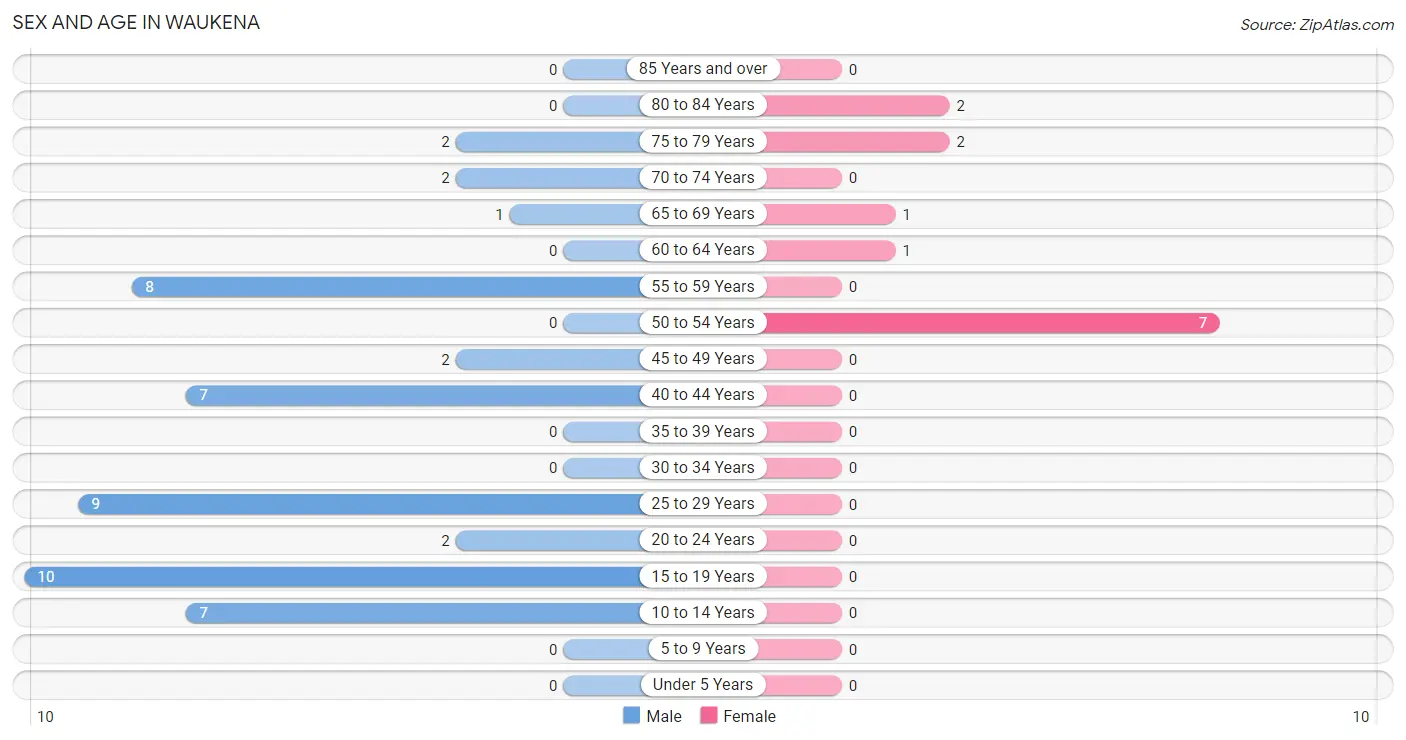
| Age Bracket | Male | Female |
| Under 5 Years | 0 (0.0%) | 0 (0.0%) |
| 5 to 9 Years | 0 (0.0%) | 0 (0.0%) |
| 10 to 14 Years | 7 (14.0%) | 0 (0.0%) |
| 15 to 19 Years | 10 (20.0%) | 0 (0.0%) |
| 20 to 24 Years | 2 (4.0%) | 0 (0.0%) |
| 25 to 29 Years | 9 (18.0%) | 0 (0.0%) |
| 30 to 34 Years | 0 (0.0%) | 0 (0.0%) |
| 35 to 39 Years | 0 (0.0%) | 0 (0.0%) |
| 40 to 44 Years | 7 (14.0%) | 0 (0.0%) |
| 45 to 49 Years | 2 (4.0%) | 0 (0.0%) |
| 50 to 54 Years | 0 (0.0%) | 7 (53.8%) |
| 55 to 59 Years | 8 (16.0%) | 0 (0.0%) |
| 60 to 64 Years | 0 (0.0%) | 1 (7.7%) |
| 65 to 69 Years | 1 (2.0%) | 1 (7.7%) |
| 70 to 74 Years | 2 (4.0%) | 0 (0.0%) |
| 75 to 79 Years | 2 (4.0%) | 2 (15.4%) |
| 80 to 84 Years | 0 (0.0%) | 2 (15.4%) |
| 85 Years and over | 0 (0.0%) | 0 (0.0%) |
| Total | 50 (100.0%) | 13 (100.0%) |
Families and Households in Waukena
Median Family Size in Waukena
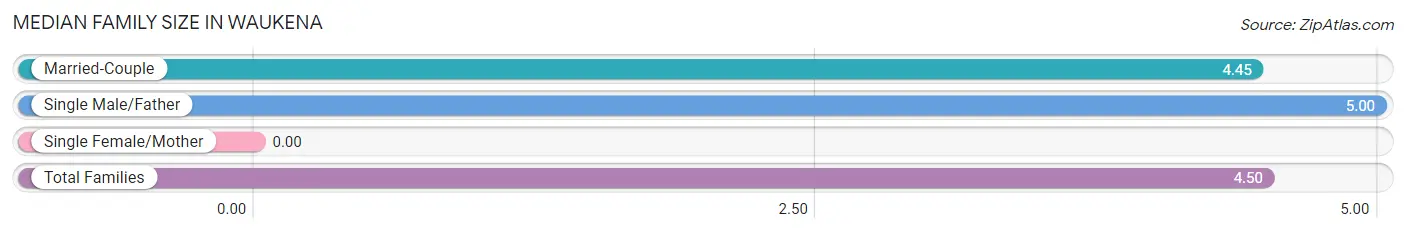
| Family Type | # Families | Family Size |
| Married-Couple | 11 (91.7%) | 4.45 |
| Single Male/Father | 1 (8.3%) | 5.00 |
| Single Female/Mother | 0 (0.0%) | - |
| Total Families | 12 (100.0%) | 4.50 |
Median Household Size in Waukena
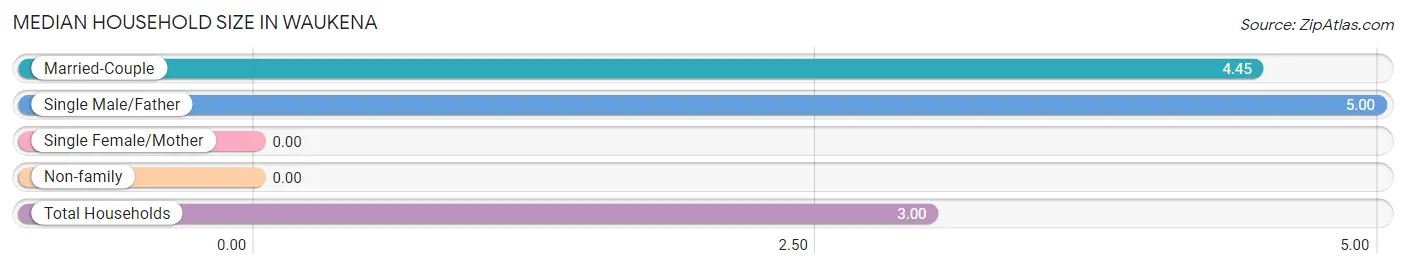
| Household Type | # Households | Household Size |
| Married-Couple | 11 (52.4%) | 4.45 |
| Single Male/Father | 1 (4.8%) | 5.00 |
| Single Female/Mother | 0 (0.0%) | - |
| Non-family | 9 (42.9%) | - |
| Total Households | 21 (100.0%) | 3.00 |
Household Size by Marriage Status in Waukena
Out of a total of 21 households in Waukena, 12 (57.1%) are family households, while 9 (42.9%) are nonfamily households. The most numerous type of family households are 5-person households, comprising 7, and the most common type of nonfamily households are 1-person households, comprising 9.
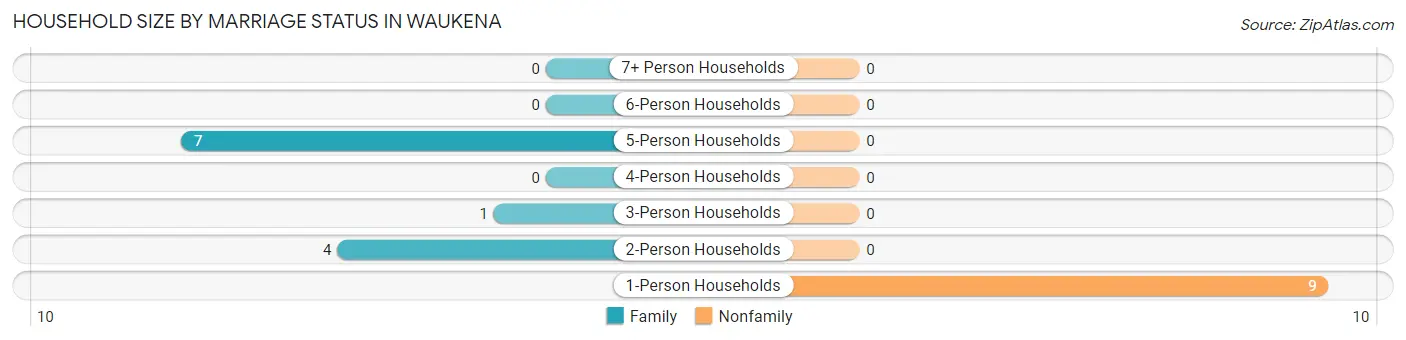
| Household Size | Family Households | Nonfamily Households |
| 1-Person Households | - | 9 (42.9%) |
| 2-Person Households | 4 (19.1%) | 0 (0.0%) |
| 3-Person Households | 1 (4.8%) | 0 (0.0%) |
| 4-Person Households | 0 (0.0%) | 0 (0.0%) |
| 5-Person Households | 7 (33.3%) | 0 (0.0%) |
| 6-Person Households | 0 (0.0%) | 0 (0.0%) |
| 7+ Person Households | 0 (0.0%) | 0 (0.0%) |
| Total | 12 (57.1%) | 9 (42.9%) |
Female Fertility in Waukena
Fertility by Age in Waukena
| Age Bracket | Women with Births | Births / 1,000 Women |
| 15 to 19 years | 0 (0.0%) | 0.0 |
| 20 to 34 years | 0 (0.0%) | 0.0 |
| 35 to 50 years | 0 (0.0%) | 0.0 |
| Total | 0 (0.0%) | 0.0 |
Fertility by Age by Marriage Status in Waukena
| Age Bracket | Married | Unmarried |
| 15 to 19 years | 0 (0.0%) | 0 (0.0%) |
| 20 to 34 years | 0 (0.0%) | 0 (0.0%) |
| 35 to 50 years | 0 (0.0%) | 0 (0.0%) |
| Total | 0 (0.0%) | 0 (0.0%) |
Fertility by Education in Waukena
| Educational Attainment | Women with Births | Births / 1,000 Women |
| Less than High School | 0 (0.0%) | 0.0 |
| High School Diploma | 0 (0.0%) | 0.0 |
| College or Associate's Degree | 0 (0.0%) | 0.0 |
| Bachelor's Degree | 0 (0.0%) | 0.0 |
| Graduate Degree | 0 (0.0%) | 0.0 |
| Total | 0 (0.0%) | 0.0 |
Fertility by Education by Marriage Status in Waukena
| Educational Attainment | Married | Unmarried |
| Less than High School | 0 (0.0%) | 0 (0.0%) |
| High School Diploma | 0 (0.0%) | 0 (0.0%) |
| College or Associate's Degree | 0 (0.0%) | 0 (0.0%) |
| Bachelor's Degree | 0 (0.0%) | 0 (0.0%) |
| Graduate Degree | 0 (0.0%) | 0 (0.0%) |
| Total | 0 (0.0%) | 0 (0.0%) |
Employment Characteristics in Waukena
Employment by Class of Employer in Waukena
Among the 27 employed individuals in Waukena, private company employees (19 | 70.4%), self-employed (not incorporated) (7 | 25.9%), and local government employees (1 | 3.7%) make up the most common classes of employment.
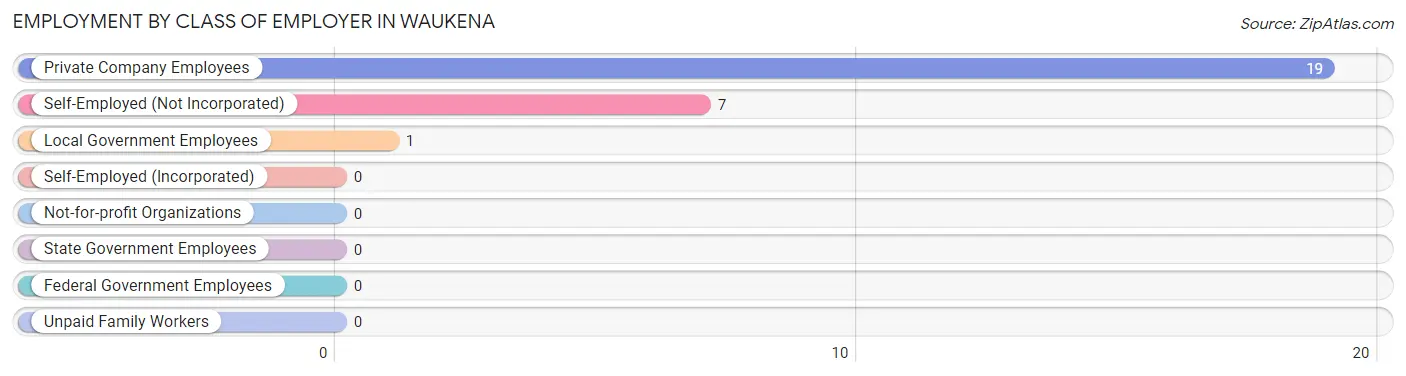
| Employer Class | # Employees | % Employees |
| Private Company Employees | 19 | 70.4% |
| Self-Employed (Incorporated) | 0 | 0.0% |
| Self-Employed (Not Incorporated) | 7 | 25.9% |
| Not-for-profit Organizations | 0 | 0.0% |
| Local Government Employees | 1 | 3.7% |
| State Government Employees | 0 | 0.0% |
| Federal Government Employees | 0 | 0.0% |
| Unpaid Family Workers | 0 | 0.0% |
| Total | 27 | 100.0% |
Employment Status by Age in Waukena
According to the labor force statistics for Waukena, out of the total population over 16 years of age (56), 64.3% or 36 individuals are in the labor force, with 25.0% or 9 of them unemployed. The age group with the highest labor force participation rate is 20 to 24 years, with 100.0% or 2 individuals in the labor force. Within the labor force, the 25 to 29 years age range has the highest percentage of unemployed individuals, with 100.0% or 9 of them being unemployed.
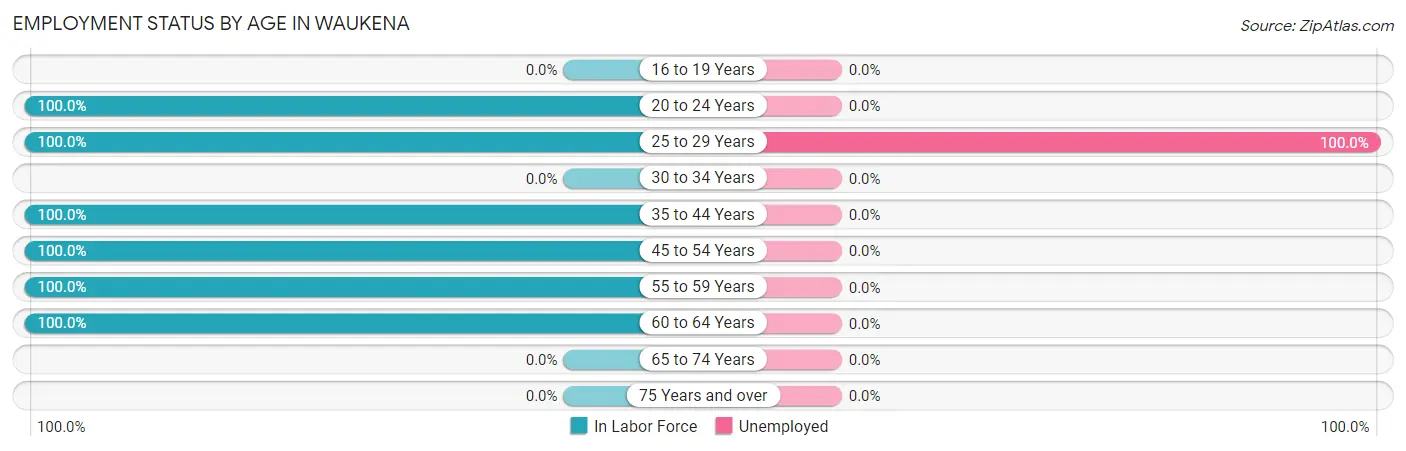
| Age Bracket | In Labor Force | Unemployed |
| 16 to 19 Years | 0 (0.0%) | 0 (0.0%) |
| 20 to 24 Years | 2 (100.0%) | 0 (0.0%) |
| 25 to 29 Years | 9 (100.0%) | 9 (100.0%) |
| 30 to 34 Years | 0 (0.0%) | 0 (0.0%) |
| 35 to 44 Years | 7 (100.0%) | 0 (0.0%) |
| 45 to 54 Years | 9 (100.0%) | 0 (0.0%) |
| 55 to 59 Years | 8 (100.0%) | 0 (0.0%) |
| 60 to 64 Years | 1 (100.0%) | 0 (0.0%) |
| 65 to 74 Years | 0 (0.0%) | 0 (0.0%) |
| 75 Years and over | 0 (0.0%) | 0 (0.0%) |
| Total | 36 (64.3%) | 9 (25.0%) |
Employment Status by Educational Attainment in Waukena
According to labor force statistics for Waukena, 100.0% of individuals (34) out of the total population between 25 and 64 years of age (34) are in the labor force, with 26.5% or 9 of them being unemployed. The group with the highest labor force participation rate are those with the educational attainment of high school diploma, with 100.0% or 2 individuals in the labor force. Within the labor force, individuals with college / associate degree education have the highest percentage of unemployment, with 37.5% or 9 of them being unemployed.
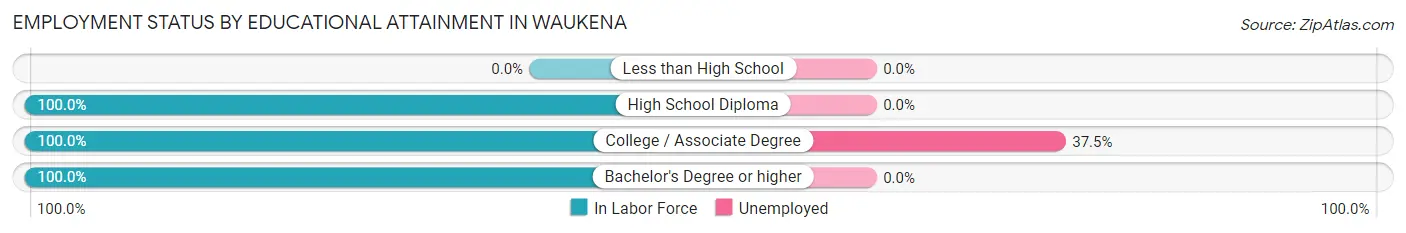
| Educational Attainment | In Labor Force | Unemployed |
| Less than High School | 0 (0.0%) | 0 (0.0%) |
| High School Diploma | 2 (100.0%) | 0 (0.0%) |
| College / Associate Degree | 24 (100.0%) | 9 (37.5%) |
| Bachelor's Degree or higher | 8 (100.0%) | 0 (0.0%) |
| Total | 34 (100.0%) | 9 (26.5%) |
Employment Occupations by Sex in Waukena
Management, Business, Science and Arts Occupations
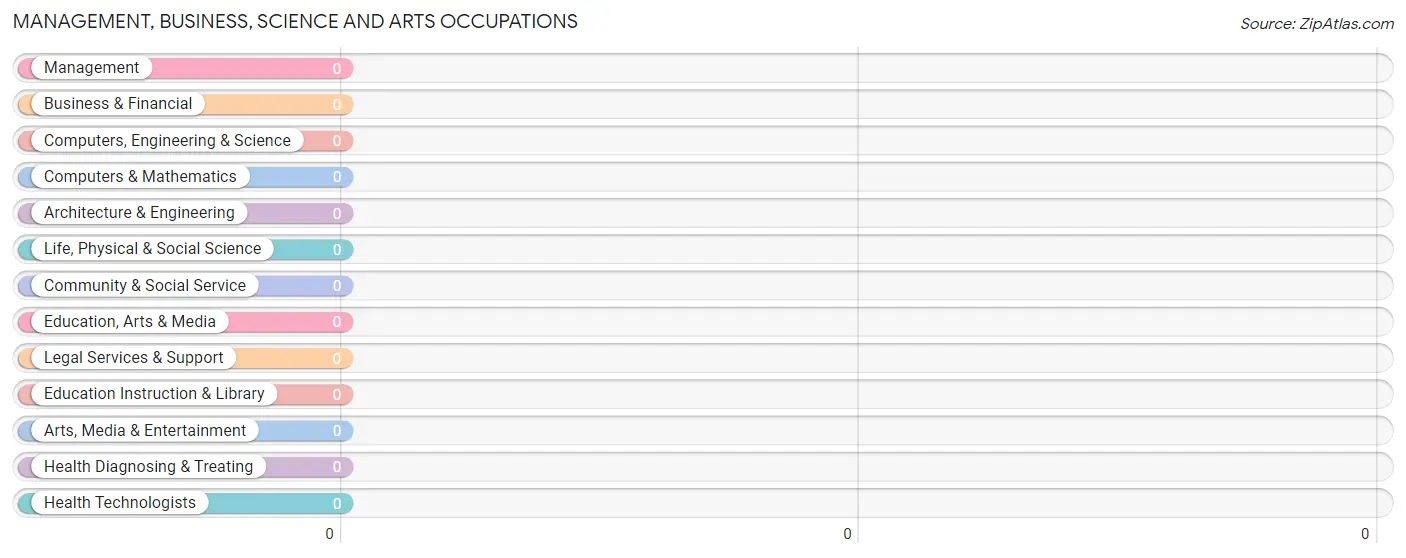
Management, Business, Science and Arts Occupations by Sex
| Occupation | Male | Female |
| Management | 0 (0.0%) | 0 (0.0%) |
| Business & Financial | 0 (0.0%) | 0 (0.0%) |
| Computers, Engineering & Science | 0 (0.0%) | 0 (0.0%) |
| Computers & Mathematics | 0 (0.0%) | 0 (0.0%) |
| Architecture & Engineering | 0 (0.0%) | 0 (0.0%) |
| Life, Physical & Social Science | 0 (0.0%) | 0 (0.0%) |
| Community & Social Service | 0 (0.0%) | 0 (0.0%) |
| Education, Arts & Media | 0 (0.0%) | 0 (0.0%) |
| Legal Services & Support | 0 (0.0%) | 0 (0.0%) |
| Education Instruction & Library | 0 (0.0%) | 0 (0.0%) |
| Arts, Media & Entertainment | 0 (0.0%) | 0 (0.0%) |
| Health Diagnosing & Treating | 0 (0.0%) | 0 (0.0%) |
| Health Technologists | 0 (0.0%) | 0 (0.0%) |
| Total (Category) | 0 (0.0%) | 0 (0.0%) |
| Total (Overall) | 19 (70.4%) | 8 (29.6%) |
Services Occupations
Services Occupations by Sex
| Occupation | Male | Female |
| Healthcare Support | 0 (0.0%) | 0 (0.0%) |
| Security & Protection | 0 (0.0%) | 0 (0.0%) |
| Firefighting & Prevention | 0 (0.0%) | 0 (0.0%) |
| Law Enforcement | 0 (0.0%) | 0 (0.0%) |
| Food Preparation & Serving | 0 (0.0%) | 0 (0.0%) |
| Cleaning & Maintenance | 0 (0.0%) | 0 (0.0%) |
| Personal Care & Service | 0 (0.0%) | 0 (0.0%) |
| Total (Category) | 0 (0.0%) | 0 (0.0%) |
| Total (Overall) | 19 (70.4%) | 8 (29.6%) |
Sales and Office Occupations
The most common Sales and Office occupations in Waukena are , and Office & Administration (7 | 25.9%).
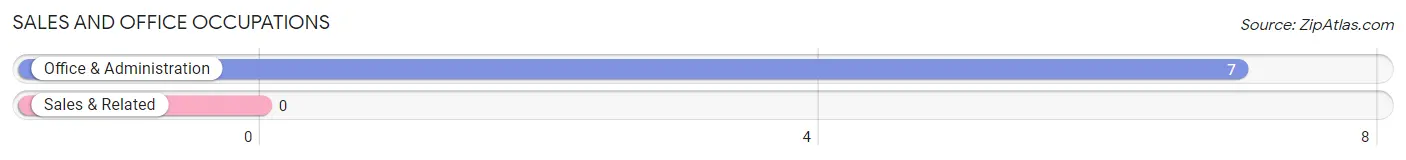
Sales and Office Occupations by Sex
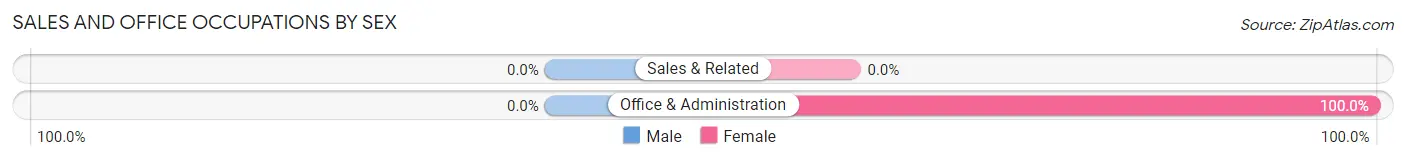
| Occupation | Male | Female |
| Sales & Related | 0 (0.0%) | 0 (0.0%) |
| Office & Administration | 0 (0.0%) | 7 (100.0%) |
| Total (Category) | 0 (0.0%) | 7 (100.0%) |
| Total (Overall) | 19 (70.4%) | 8 (29.6%) |
Natural Resources, Construction and Maintenance Occupations
The most common Natural Resources, Construction and Maintenance occupations in Waukena are Installation, Maintenance & Repair (9 | 33.3%), and Construction & Extraction (2 | 7.4%).
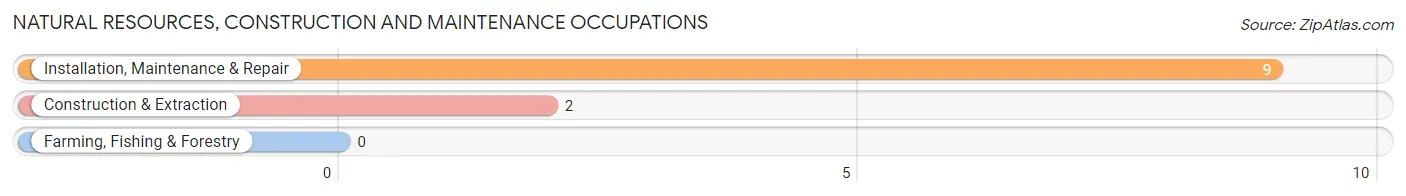
Natural Resources, Construction and Maintenance Occupations by Sex
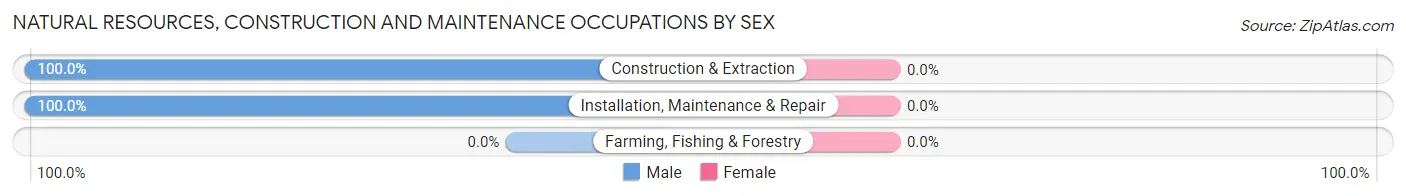
| Occupation | Male | Female |
| Farming, Fishing & Forestry | 0 (0.0%) | 0 (0.0%) |
| Construction & Extraction | 2 (100.0%) | 0 (0.0%) |
| Installation, Maintenance & Repair | 9 (100.0%) | 0 (0.0%) |
| Total (Category) | 11 (100.0%) | 0 (0.0%) |
| Total (Overall) | 19 (70.4%) | 8 (29.6%) |
Production, Transportation and Moving Occupations
The most common Production, Transportation and Moving occupations in Waukena are Production (8 | 29.6%), and Transportation (1 | 3.7%).
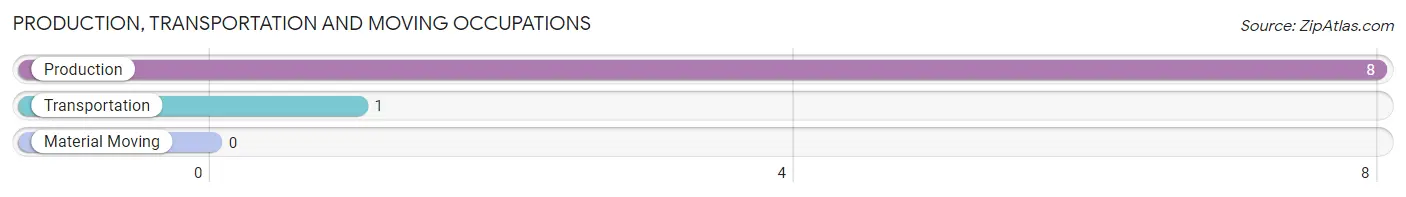
Production, Transportation and Moving Occupations by Sex
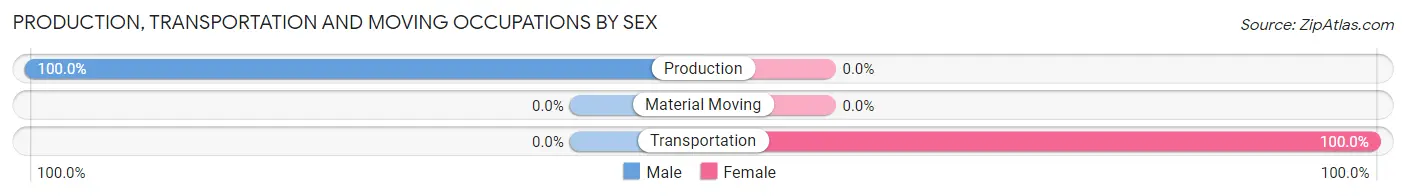
| Occupation | Male | Female |
| Production | 8 (100.0%) | 0 (0.0%) |
| Transportation | 0 (0.0%) | 1 (100.0%) |
| Material Moving | 0 (0.0%) | 0 (0.0%) |
| Total (Category) | 8 (88.9%) | 1 (11.1%) |
| Total (Overall) | 19 (70.4%) | 8 (29.6%) |
Employment Industries by Sex in Waukena
Employment Industries in Waukena
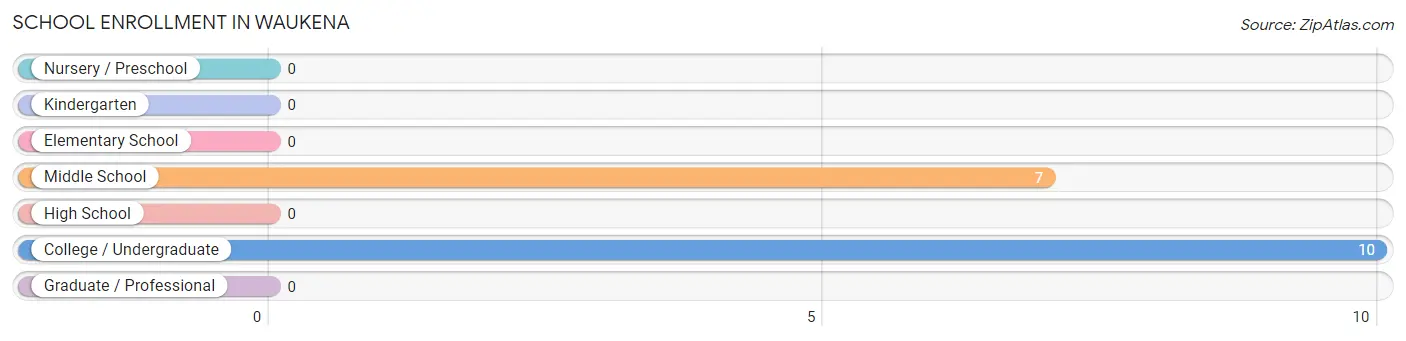
The major employment industries in Waukena include Construction (9 | 33.3%), Manufacturing (8 | 29.6%), and Educational Services (8 | 29.6%).
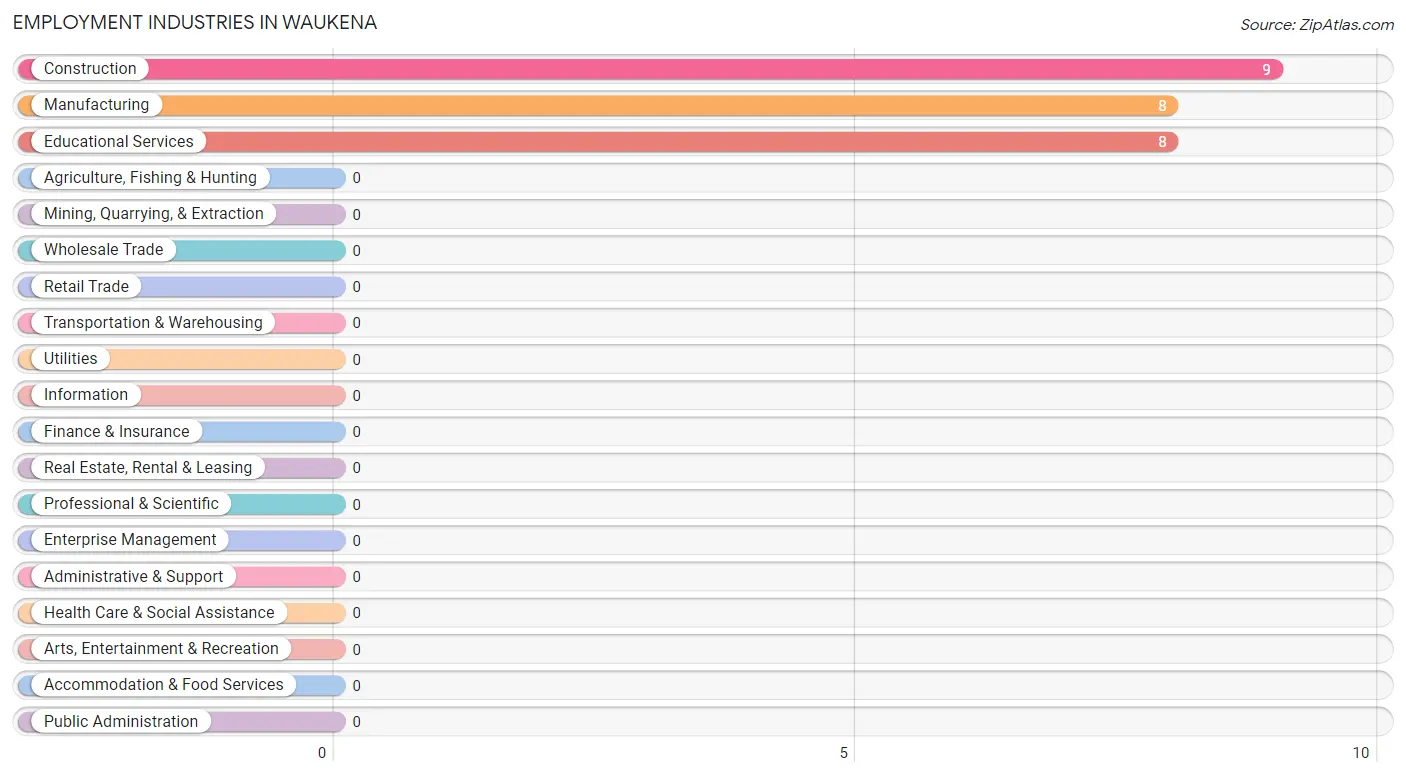
Employment Industries by Sex in Waukena
| Industry | Male | Female |
| Agriculture, Fishing & Hunting | 0 (0.0%) | 0 (0.0%) |
| Mining, Quarrying, & Extraction | 0 (0.0%) | 0 (0.0%) |
| Construction | 9 (100.0%) | 0 (0.0%) |
| Manufacturing | 8 (100.0%) | 0 (0.0%) |
| Wholesale Trade | 0 (0.0%) | 0 (0.0%) |
| Retail Trade | 0 (0.0%) | 0 (0.0%) |
| Transportation & Warehousing | 0 (0.0%) | 0 (0.0%) |
| Utilities | 0 (0.0%) | 0 (0.0%) |
| Information | 0 (0.0%) | 0 (0.0%) |
| Finance & Insurance | 0 (0.0%) | 0 (0.0%) |
| Real Estate, Rental & Leasing | 0 (0.0%) | 0 (0.0%) |
| Professional & Scientific | 0 (0.0%) | 0 (0.0%) |
| Enterprise Management | 0 (0.0%) | 0 (0.0%) |
| Administrative & Support | 0 (0.0%) | 0 (0.0%) |
| Educational Services | 0 (0.0%) | 8 (100.0%) |
| Health Care & Social Assistance | 0 (0.0%) | 0 (0.0%) |
| Arts, Entertainment & Recreation | 0 (0.0%) | 0 (0.0%) |
| Accommodation & Food Services | 0 (0.0%) | 0 (0.0%) |
| Public Administration | 0 (0.0%) | 0 (0.0%) |
| Total | 19 (70.4%) | 8 (29.6%) |
Education in Waukena
School Enrollment in Waukena
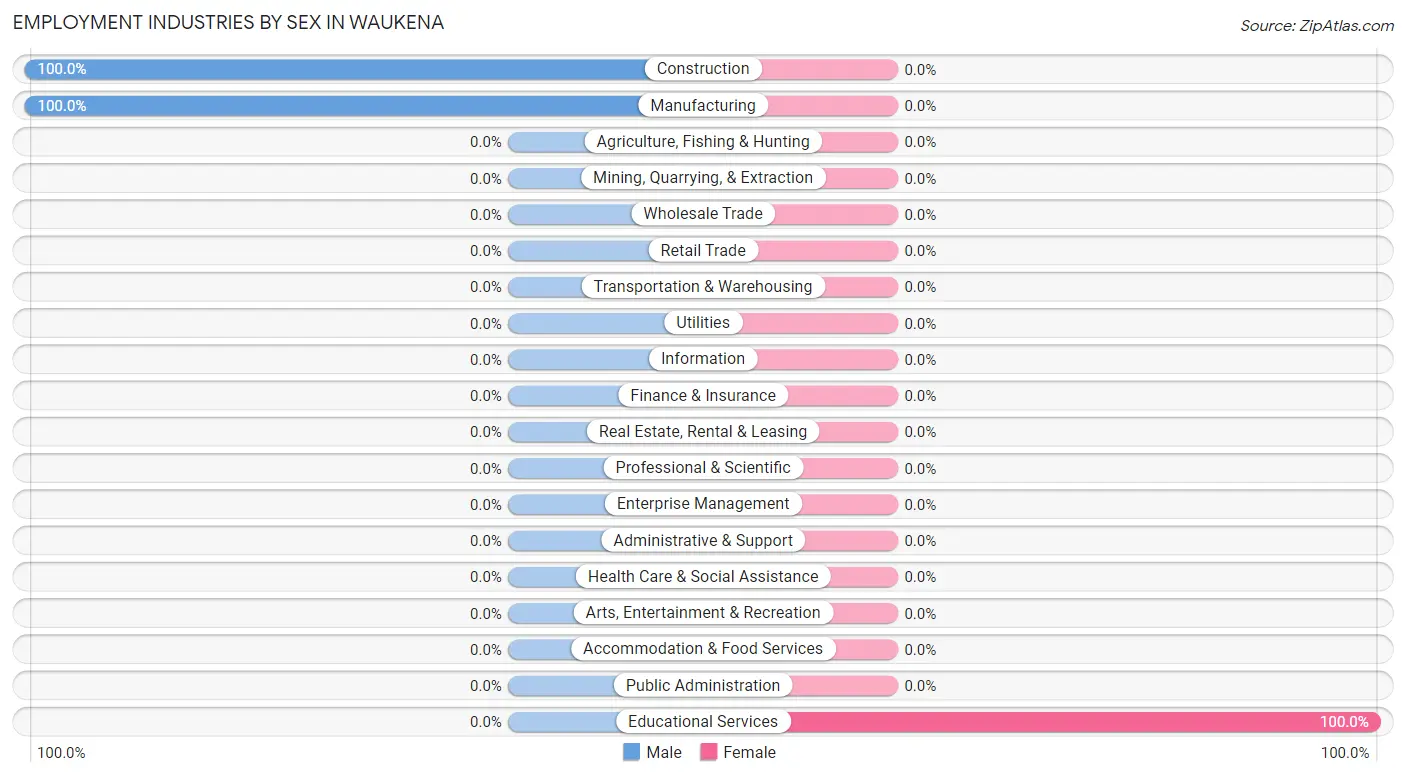
The most common levels of schooling among the 17 students in Waukena are college / undergraduate (10 | 58.8%), and middle school (7 | 41.2%).
| School Level | # Students | % Students |
| Nursery / Preschool | 0 | 0.0% |
| Kindergarten | 0 | 0.0% |
| Elementary School | 0 | 0.0% |
| Middle School | 7 | 41.2% |
| High School | 0 | 0.0% |
| College / Undergraduate | 10 | 58.8% |
| Graduate / Professional | 0 | 0.0% |
| Total | 17 | 100.0% |
School Enrollment by Age by Funding Source in Waukena
Out of a total of 17 students who are enrolled in schools in Waukena, 10 (58.8%) attend a private institution, while the remaining 7 (41.2%) are enrolled in public schools. The age group of 18 to 19 year olds has the highest likelihood of being enrolled in private schools, with 10 (100.0% in the age bracket) enrolled. Conversely, the age group of 10 to 14 year olds has the lowest likelihood of being enrolled in a private school, with 7 (100.0% in the age bracket) attending a public institution.
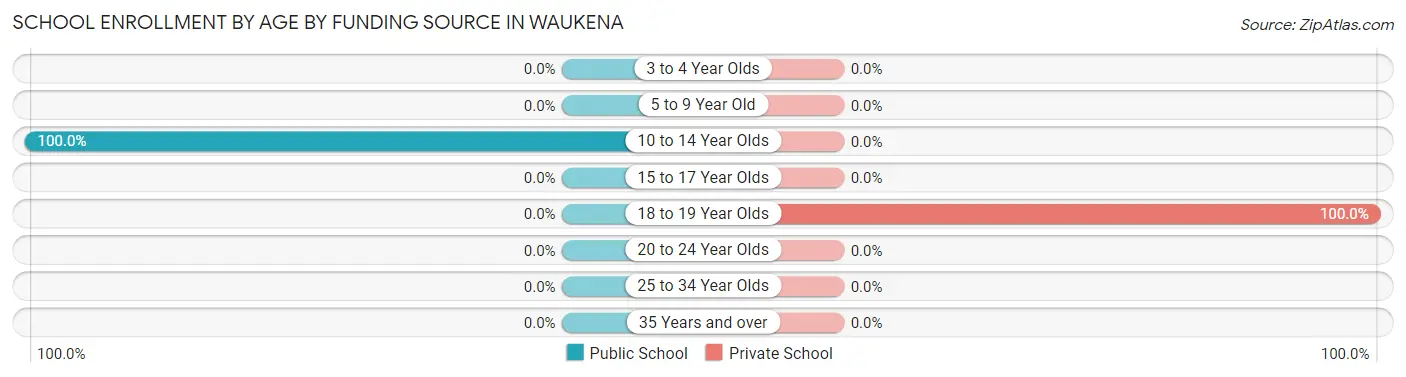
| Age Bracket | Public School | Private School |
| 3 to 4 Year Olds | 0 (0.0%) | 0 (0.0%) |
| 5 to 9 Year Old | 0 (0.0%) | 0 (0.0%) |
| 10 to 14 Year Olds | 7 (100.0%) | 0 (0.0%) |
| 15 to 17 Year Olds | 0 (0.0%) | 0 (0.0%) |
| 18 to 19 Year Olds | 0 (0.0%) | 10 (100.0%) |
| 20 to 24 Year Olds | 0 (0.0%) | 0 (0.0%) |
| 25 to 34 Year Olds | 0 (0.0%) | 0 (0.0%) |
| 35 Years and over | 0 (0.0%) | 0 (0.0%) |
| Total | 7 (41.2%) | 10 (58.8%) |
Educational Attainment by Field of Study in Waukena
Bio, nature & agricultural (10 | 90.9%), and education (1 | 9.1%) are the most common fields of study among 11 individuals in Waukena who have obtained a bachelor's degree or higher.
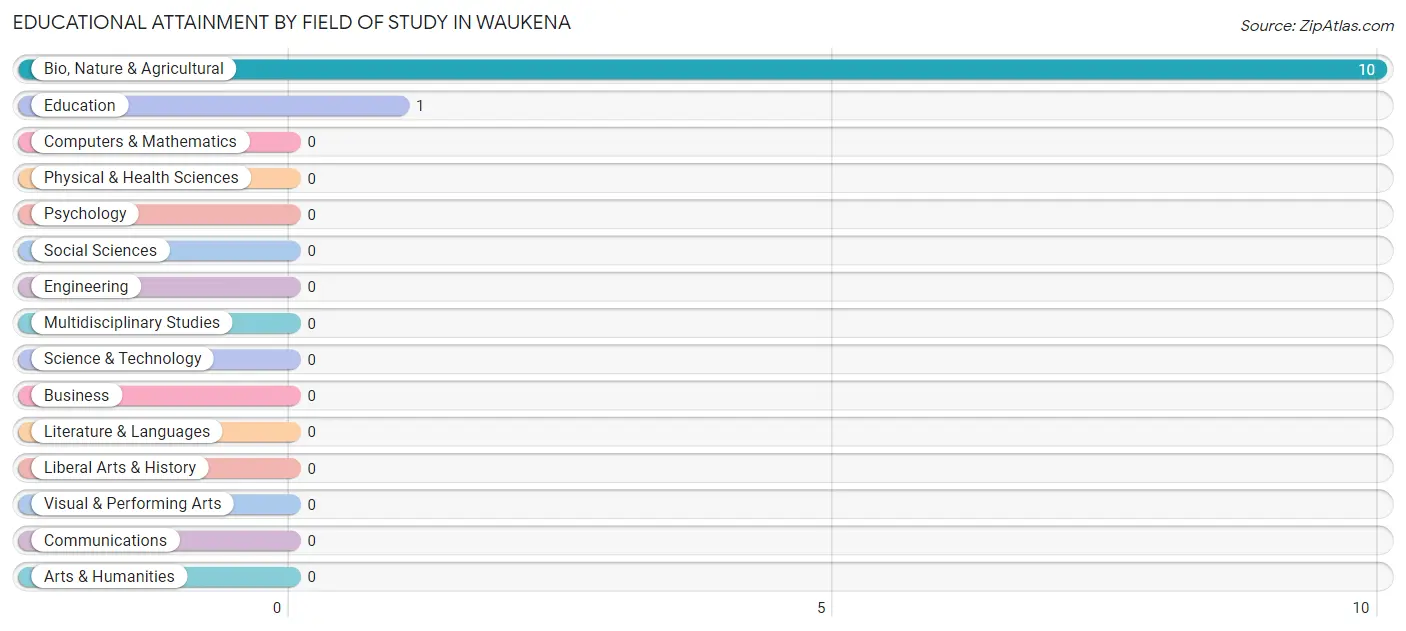
| Field of Study | # Graduates | % Graduates |
| Computers & Mathematics | 0 | 0.0% |
| Bio, Nature & Agricultural | 10 | 90.9% |
| Physical & Health Sciences | 0 | 0.0% |
| Psychology | 0 | 0.0% |
| Social Sciences | 0 | 0.0% |
| Engineering | 0 | 0.0% |
| Multidisciplinary Studies | 0 | 0.0% |
| Science & Technology | 0 | 0.0% |
| Business | 0 | 0.0% |
| Education | 1 | 9.1% |
| Literature & Languages | 0 | 0.0% |
| Liberal Arts & History | 0 | 0.0% |
| Visual & Performing Arts | 0 | 0.0% |
| Communications | 0 | 0.0% |
| Arts & Humanities | 0 | 0.0% |
| Total | 11 | 100.0% |
Transportation & Commute in Waukena
Vehicle Availability by Sex in Waukena
The most prevalent vehicle ownership categories in Waukena are males with 5 or more vehicles (8, accounting for 42.1%) and females with 5 or more vehicles (7, making up 100.0%).
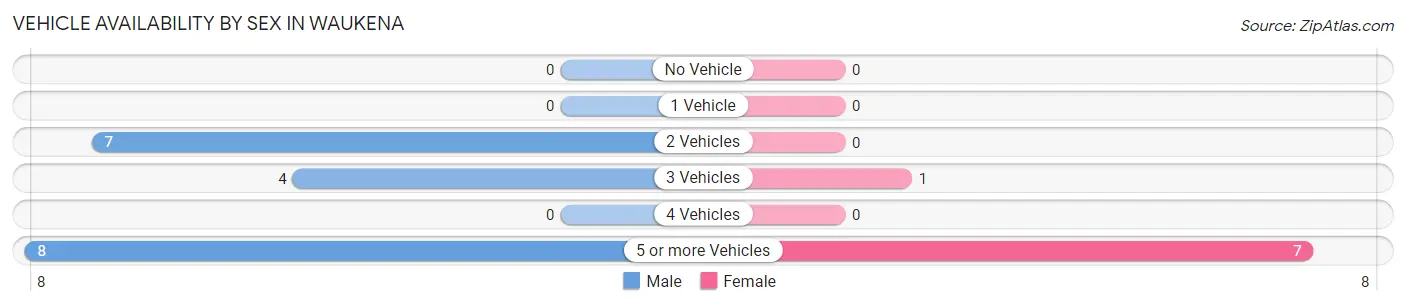
| Vehicles Available | Male | Female |
| No Vehicle | 0 (0.0%) | 0 (0.0%) |
| 1 Vehicle | 0 (0.0%) | 0 (0.0%) |
| 2 Vehicles | 7 (36.8%) | 0 (0.0%) |
| 3 Vehicles | 4 (21.0%) | 1 (12.5%) |
| 4 Vehicles | 0 (0.0%) | 0 (0.0%) |
| 5 or more Vehicles | 8 (42.1%) | 7 (87.5%) |
| Total | 19 (100.0%) | 8 (100.0%) |
Commute Time in Waukena
The most frequently occuring commute durations in Waukena are 10 to 14 minutes (8 commuters, 40.0%), 30 to 34 minutes (7 commuters, 35.0%), and 5 to 9 minutes (2 commuters, 10.0%).
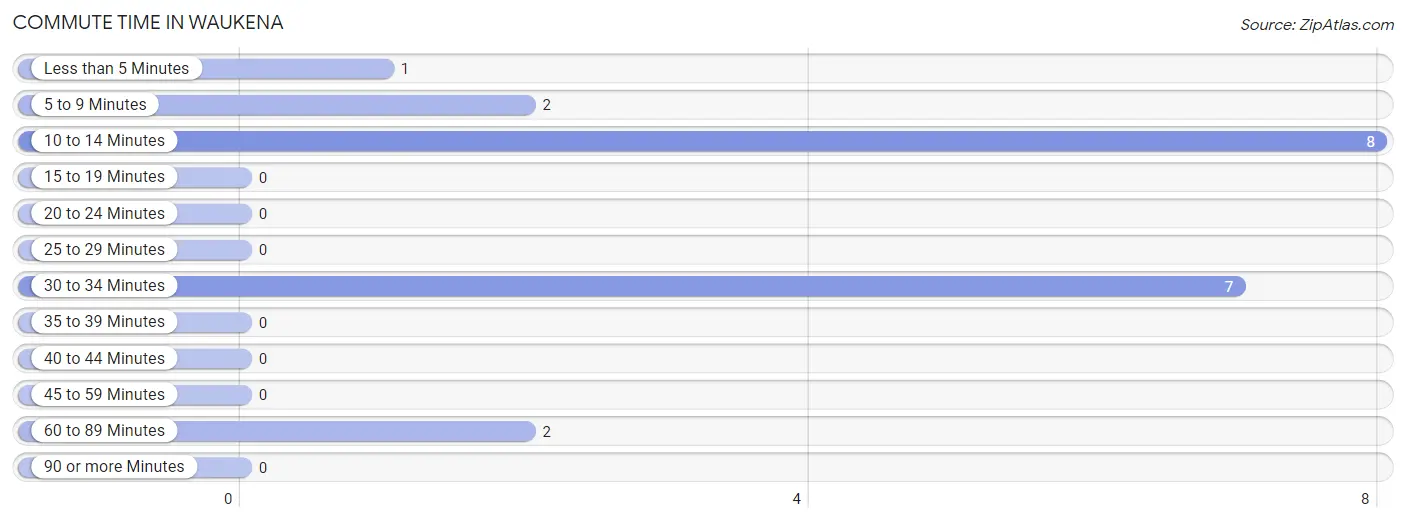
| Commute Time | # Commuters | % Commuters |
| Less than 5 Minutes | 1 | 5.0% |
| 5 to 9 Minutes | 2 | 10.0% |
| 10 to 14 Minutes | 8 | 40.0% |
| 15 to 19 Minutes | 0 | 0.0% |
| 20 to 24 Minutes | 0 | 0.0% |
| 25 to 29 Minutes | 0 | 0.0% |
| 30 to 34 Minutes | 7 | 35.0% |
| 35 to 39 Minutes | 0 | 0.0% |
| 40 to 44 Minutes | 0 | 0.0% |
| 45 to 59 Minutes | 0 | 0.0% |
| 60 to 89 Minutes | 2 | 10.0% |
| 90 or more Minutes | 0 | 0.0% |
Commute Time by Sex in Waukena
The most common commute times in Waukena are 10 to 14 minutes (8 commuters, 66.7%) for males and 30 to 34 minutes (7 commuters, 87.5%) for females.
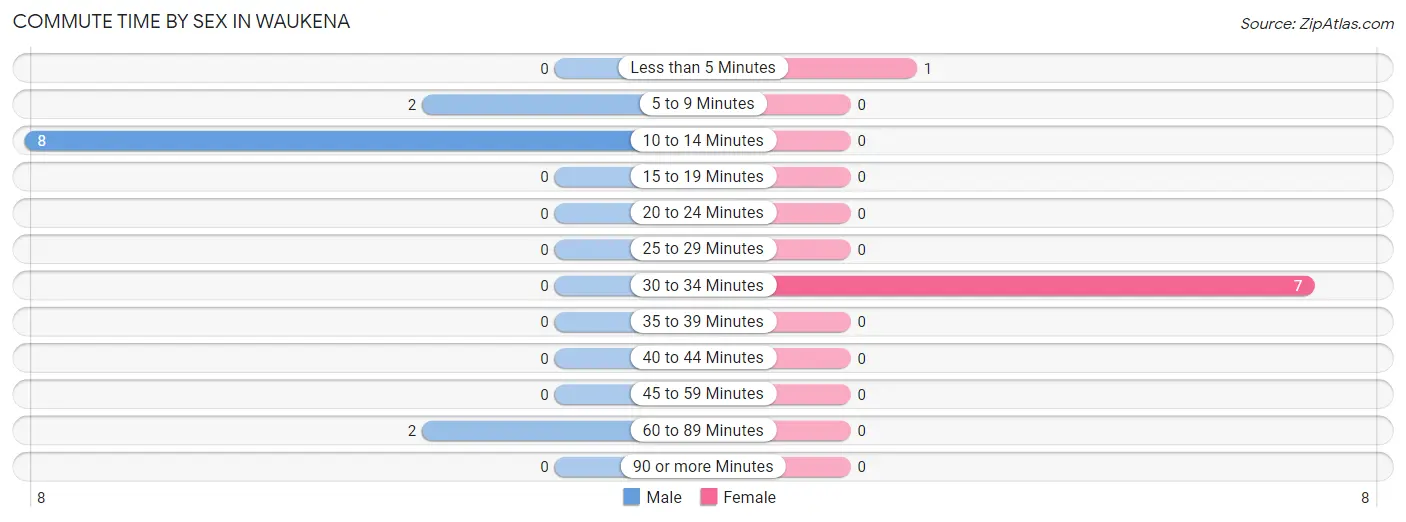
| Commute Time | Male | Female |
| Less than 5 Minutes | 0 (0.0%) | 1 (12.5%) |
| 5 to 9 Minutes | 2 (16.7%) | 0 (0.0%) |
| 10 to 14 Minutes | 8 (66.7%) | 0 (0.0%) |
| 15 to 19 Minutes | 0 (0.0%) | 0 (0.0%) |
| 20 to 24 Minutes | 0 (0.0%) | 0 (0.0%) |
| 25 to 29 Minutes | 0 (0.0%) | 0 (0.0%) |
| 30 to 34 Minutes | 0 (0.0%) | 7 (87.5%) |
| 35 to 39 Minutes | 0 (0.0%) | 0 (0.0%) |
| 40 to 44 Minutes | 0 (0.0%) | 0 (0.0%) |
| 45 to 59 Minutes | 0 (0.0%) | 0 (0.0%) |
| 60 to 89 Minutes | 2 (16.7%) | 0 (0.0%) |
| 90 or more Minutes | 0 (0.0%) | 0 (0.0%) |
Time of Departure to Work by Sex in Waukena
The most frequent times of departure to work in Waukena are 7:00 AM to 7:29 AM (8, 66.7%) for males and 7:00 AM to 7:29 AM (7, 87.5%) for females.
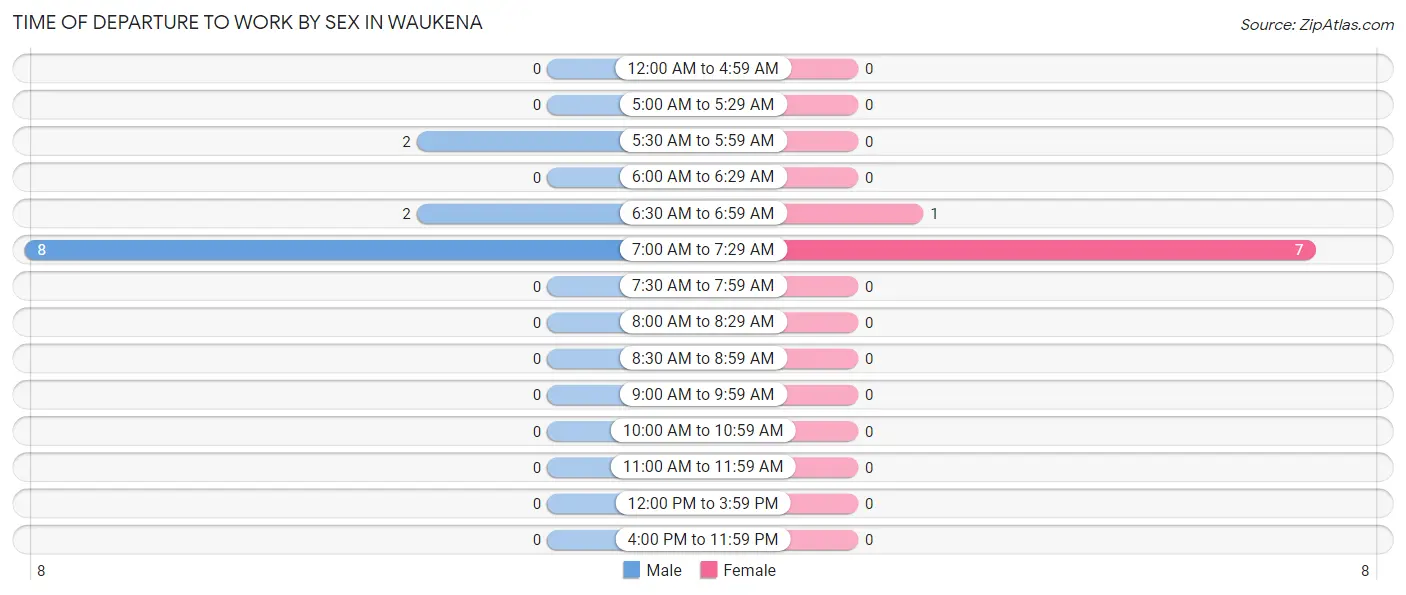
| Time of Departure | Male | Female |
| 12:00 AM to 4:59 AM | 0 (0.0%) | 0 (0.0%) |
| 5:00 AM to 5:29 AM | 0 (0.0%) | 0 (0.0%) |
| 5:30 AM to 5:59 AM | 2 (16.7%) | 0 (0.0%) |
| 6:00 AM to 6:29 AM | 0 (0.0%) | 0 (0.0%) |
| 6:30 AM to 6:59 AM | 2 (16.7%) | 1 (12.5%) |
| 7:00 AM to 7:29 AM | 8 (66.7%) | 7 (87.5%) |
| 7:30 AM to 7:59 AM | 0 (0.0%) | 0 (0.0%) |
| 8:00 AM to 8:29 AM | 0 (0.0%) | 0 (0.0%) |
| 8:30 AM to 8:59 AM | 0 (0.0%) | 0 (0.0%) |
| 9:00 AM to 9:59 AM | 0 (0.0%) | 0 (0.0%) |
| 10:00 AM to 10:59 AM | 0 (0.0%) | 0 (0.0%) |
| 11:00 AM to 11:59 AM | 0 (0.0%) | 0 (0.0%) |
| 12:00 PM to 3:59 PM | 0 (0.0%) | 0 (0.0%) |
| 4:00 PM to 11:59 PM | 0 (0.0%) | 0 (0.0%) |
| Total | 12 (100.0%) | 8 (100.0%) |
Housing Occupancy in Waukena
Occupancy by Ownership in Waukena
Of the total 21 dwellings in Waukena, owner-occupied units account for 13 (61.9%), while renter-occupied units make up 8 (38.1%).
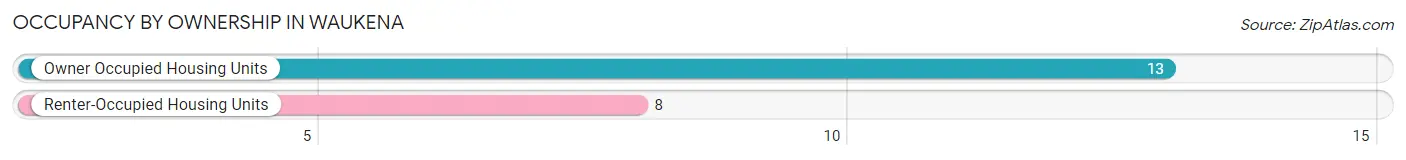
| Occupancy | # Housing Units | % Housing Units |
| Owner Occupied Housing Units | 13 | 61.9% |
| Renter-Occupied Housing Units | 8 | 38.1% |
| Total Occupied Housing Units | 21 | 100.0% |
Occupancy by Household Size in Waukena
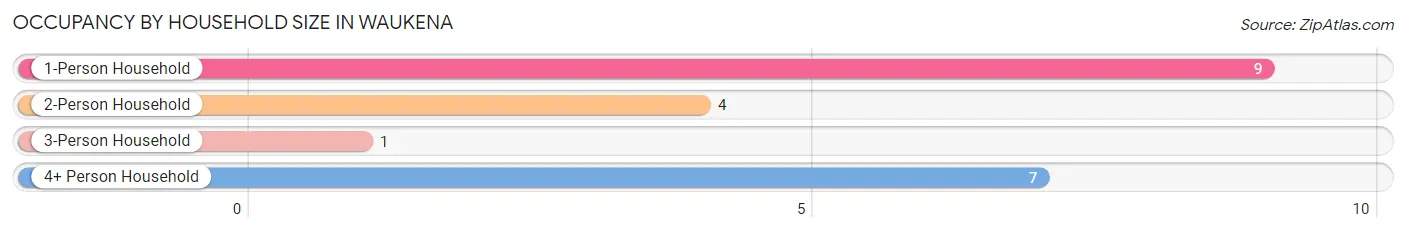
| Household Size | # Housing Units | % Housing Units |
| 1-Person Household | 9 | 42.9% |
| 2-Person Household | 4 | 19.1% |
| 3-Person Household | 1 | 4.8% |
| 4+ Person Household | 7 | 33.3% |
| Total Housing Units | 21 | 100.0% |
Occupancy by Ownership by Household Size in Waukena
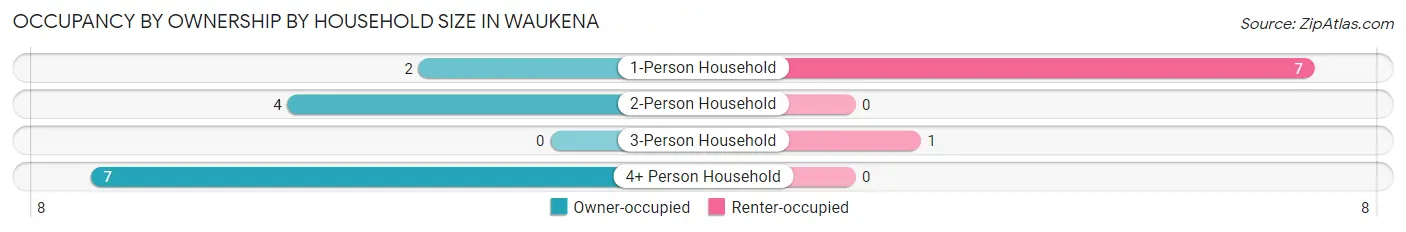
| Household Size | Owner-occupied | Renter-occupied |
| 1-Person Household | 2 (22.2%) | 7 (77.8%) |
| 2-Person Household | 4 (100.0%) | 0 (0.0%) |
| 3-Person Household | 0 (0.0%) | 1 (100.0%) |
| 4+ Person Household | 7 (100.0%) | 0 (0.0%) |
| Total Housing Units | 13 (61.9%) | 8 (38.1%) |
Occupancy by Educational Attainment in Waukena
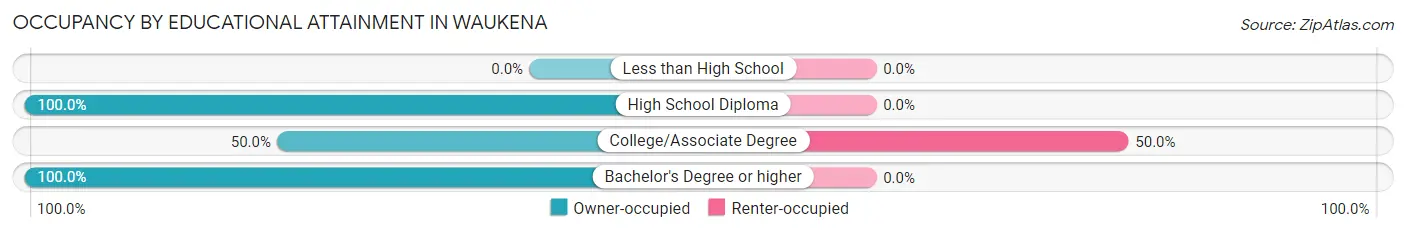
| Household Size | Owner-occupied | Renter-occupied |
| Less than High School | 0 (0.0%) | 0 (0.0%) |
| High School Diploma | 3 (100.0%) | 0 (0.0%) |
| College/Associate Degree | 8 (50.0%) | 8 (50.0%) |
| Bachelor's Degree or higher | 2 (100.0%) | 0 (0.0%) |
Occupancy by Age of Householder in Waukena
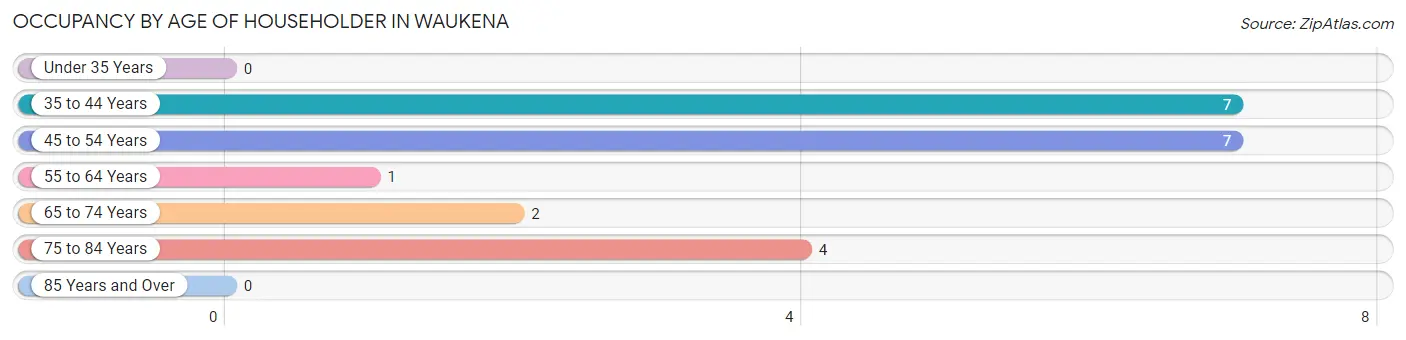
| Age Bracket | # Households | % Households |
| Under 35 Years | 0 | 0.0% |
| 35 to 44 Years | 7 | 33.3% |
| 45 to 54 Years | 7 | 33.3% |
| 55 to 64 Years | 1 | 4.8% |
| 65 to 74 Years | 2 | 9.5% |
| 75 to 84 Years | 4 | 19.1% |
| 85 Years and Over | 0 | 0.0% |
| Total | 21 | 100.0% |
Housing Finances in Waukena
Median Income by Occupancy in Waukena
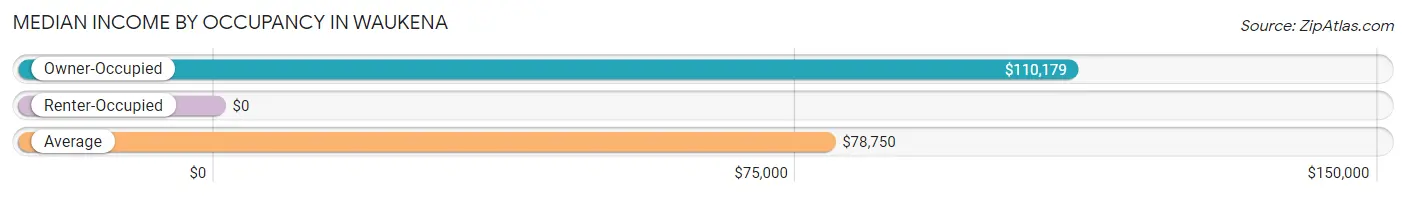
| Occupancy Type | # Households | Median Income |
| Owner-Occupied | 13 (61.9%) | $110,179 |
| Renter-Occupied | 8 (38.1%) | $0 |
| Average | 21 (100.0%) | $78,750 |
Occupancy by Householder Income Bracket in Waukena
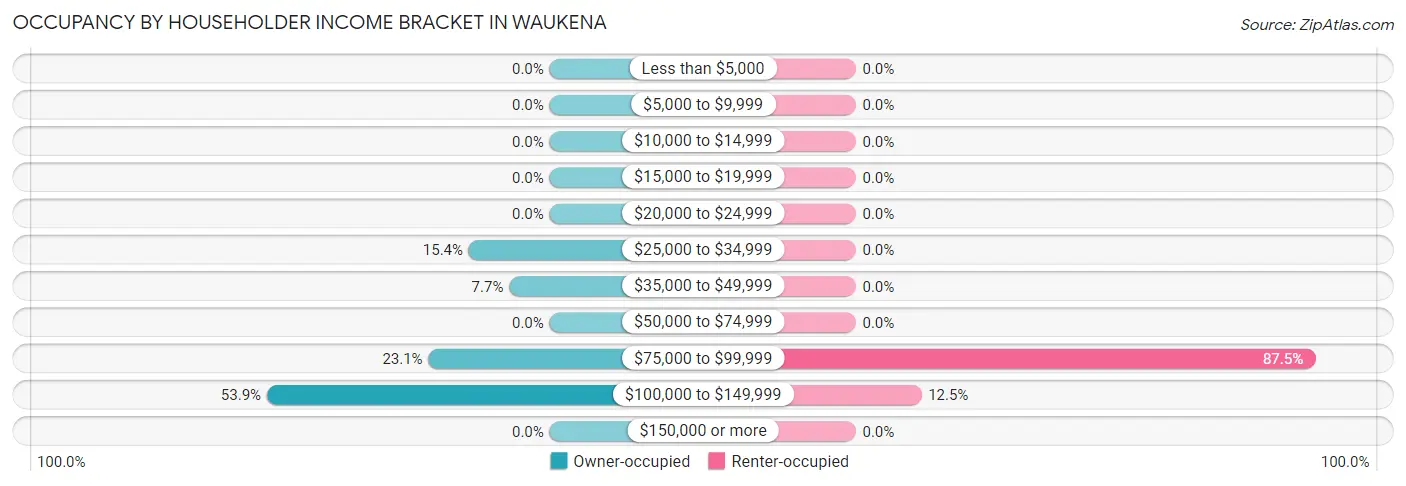
| Income Bracket | Owner-occupied | Renter-occupied |
| Less than $5,000 | 0 (0.0%) | 0 (0.0%) |
| $5,000 to $9,999 | 0 (0.0%) | 0 (0.0%) |
| $10,000 to $14,999 | 0 (0.0%) | 0 (0.0%) |
| $15,000 to $19,999 | 0 (0.0%) | 0 (0.0%) |
| $20,000 to $24,999 | 0 (0.0%) | 0 (0.0%) |
| $25,000 to $34,999 | 2 (15.4%) | 0 (0.0%) |
| $35,000 to $49,999 | 1 (7.7%) | 0 (0.0%) |
| $50,000 to $74,999 | 0 (0.0%) | 0 (0.0%) |
| $75,000 to $99,999 | 3 (23.1%) | 7 (87.5%) |
| $100,000 to $149,999 | 7 (53.8%) | 1 (12.5%) |
| $150,000 or more | 0 (0.0%) | 0 (0.0%) |
| Total | 13 (100.0%) | 8 (100.0%) |
Monthly Housing Cost Tiers in Waukena
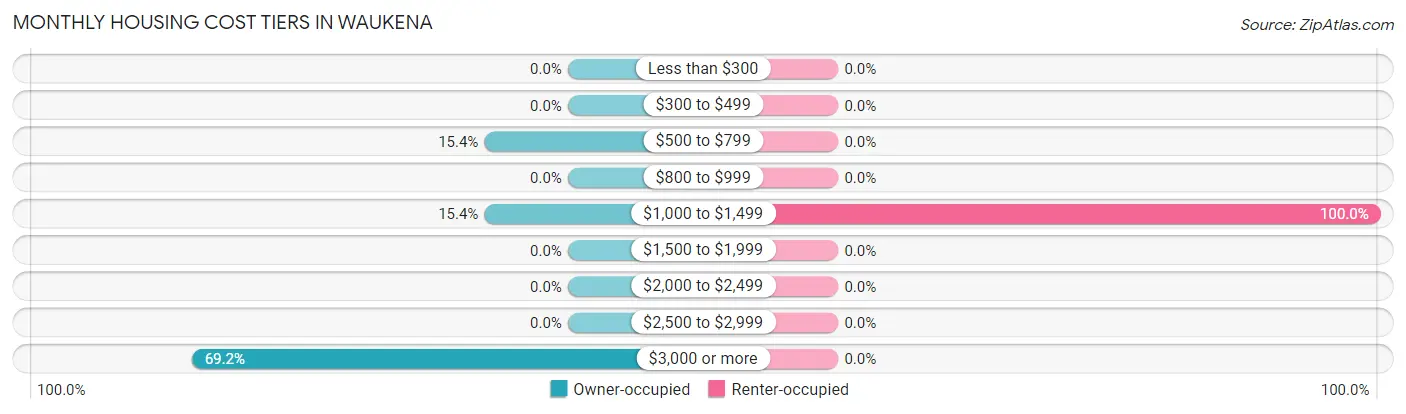
| Monthly Cost | Owner-occupied | Renter-occupied |
| Less than $300 | 0 (0.0%) | 0 (0.0%) |
| $300 to $499 | 0 (0.0%) | 0 (0.0%) |
| $500 to $799 | 2 (15.4%) | 0 (0.0%) |
| $800 to $999 | 0 (0.0%) | 0 (0.0%) |
| $1,000 to $1,499 | 2 (15.4%) | 8 (100.0%) |
| $1,500 to $1,999 | 0 (0.0%) | 0 (0.0%) |
| $2,000 to $2,499 | 0 (0.0%) | 0 (0.0%) |
| $2,500 to $2,999 | 0 (0.0%) | 0 (0.0%) |
| $3,000 or more | 9 (69.2%) | 0 (0.0%) |
| Total | 13 (100.0%) | 8 (100.0%) |
Physical Housing Characteristics in Waukena
Housing Structures in Waukena
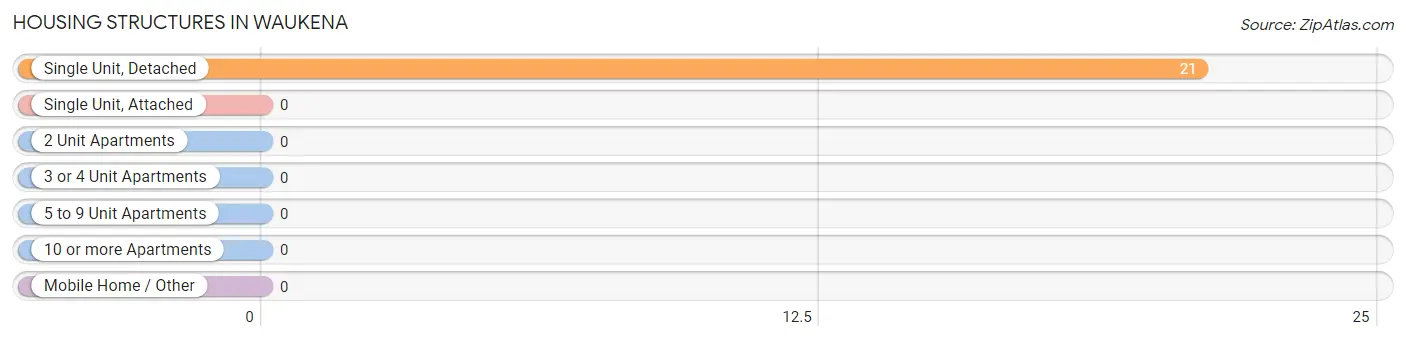
| Structure Type | # Housing Units | % Housing Units |
| Single Unit, Detached | 21 | 100.0% |
| Single Unit, Attached | 0 | 0.0% |
| 2 Unit Apartments | 0 | 0.0% |
| 3 or 4 Unit Apartments | 0 | 0.0% |
| 5 to 9 Unit Apartments | 0 | 0.0% |
| 10 or more Apartments | 0 | 0.0% |
| Mobile Home / Other | 0 | 0.0% |
| Total | 21 | 100.0% |
Housing Structures by Occupancy in Waukena
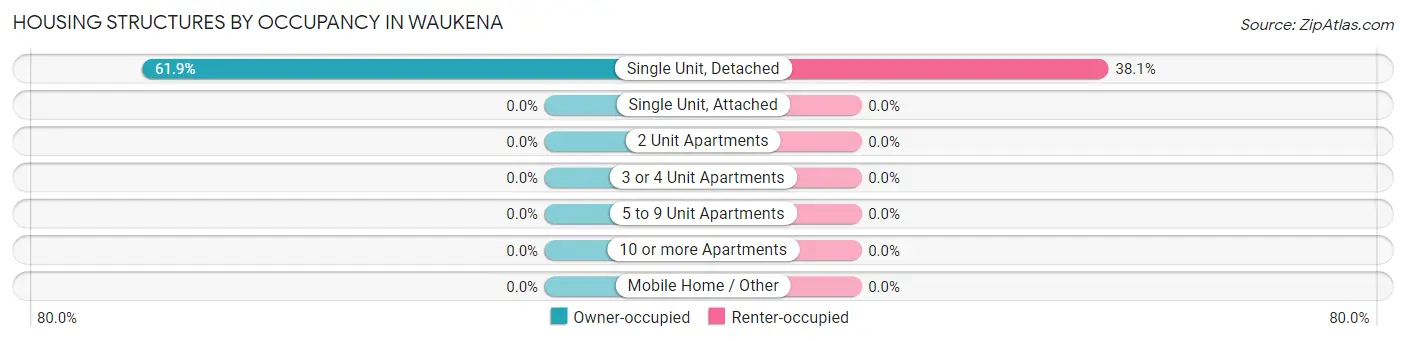
| Structure Type | Owner-occupied | Renter-occupied |
| Single Unit, Detached | 13 (61.9%) | 8 (38.1%) |
| Single Unit, Attached | 0 (0.0%) | 0 (0.0%) |
| 2 Unit Apartments | 0 (0.0%) | 0 (0.0%) |
| 3 or 4 Unit Apartments | 0 (0.0%) | 0 (0.0%) |
| 5 to 9 Unit Apartments | 0 (0.0%) | 0 (0.0%) |
| 10 or more Apartments | 0 (0.0%) | 0 (0.0%) |
| Mobile Home / Other | 0 (0.0%) | 0 (0.0%) |
| Total | 13 (61.9%) | 8 (38.1%) |
Housing Structures by Number of Rooms in Waukena
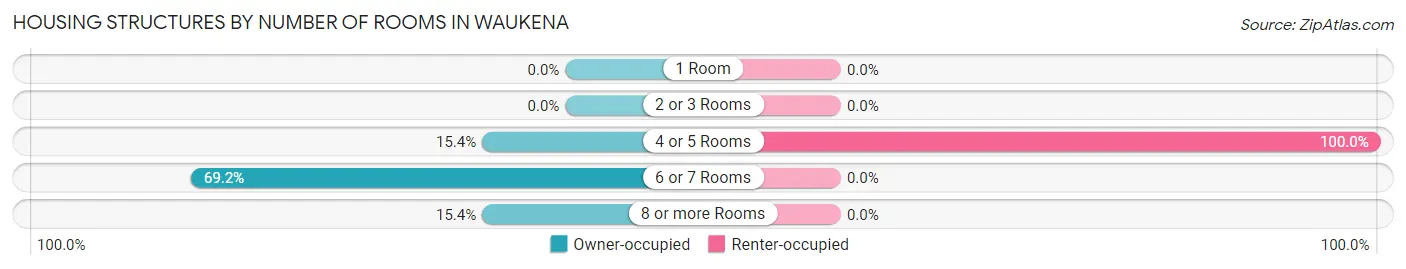
| Number of Rooms | Owner-occupied | Renter-occupied |
| 1 Room | 0 (0.0%) | 0 (0.0%) |
| 2 or 3 Rooms | 0 (0.0%) | 0 (0.0%) |
| 4 or 5 Rooms | 2 (15.4%) | 8 (100.0%) |
| 6 or 7 Rooms | 9 (69.2%) | 0 (0.0%) |
| 8 or more Rooms | 2 (15.4%) | 0 (0.0%) |
| Total | 13 (100.0%) | 8 (100.0%) |
Housing Structure by Heating Type in Waukena
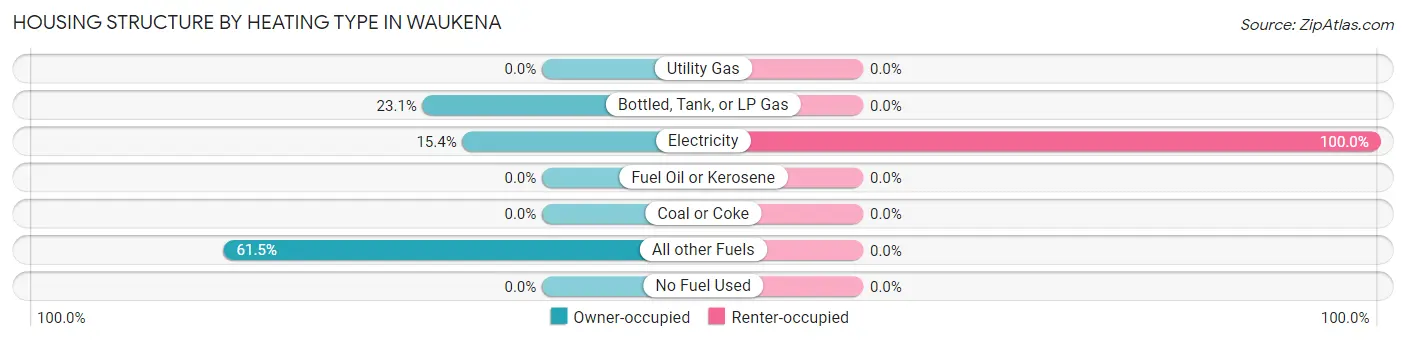
| Heating Type | Owner-occupied | Renter-occupied |
| Utility Gas | 0 (0.0%) | 0 (0.0%) |
| Bottled, Tank, or LP Gas | 3 (23.1%) | 0 (0.0%) |
| Electricity | 2 (15.4%) | 8 (100.0%) |
| Fuel Oil or Kerosene | 0 (0.0%) | 0 (0.0%) |
| Coal or Coke | 0 (0.0%) | 0 (0.0%) |
| All other Fuels | 8 (61.5%) | 0 (0.0%) |
| No Fuel Used | 0 (0.0%) | 0 (0.0%) |
| Total | 13 (100.0%) | 8 (100.0%) |
Household Vehicle Usage in Waukena
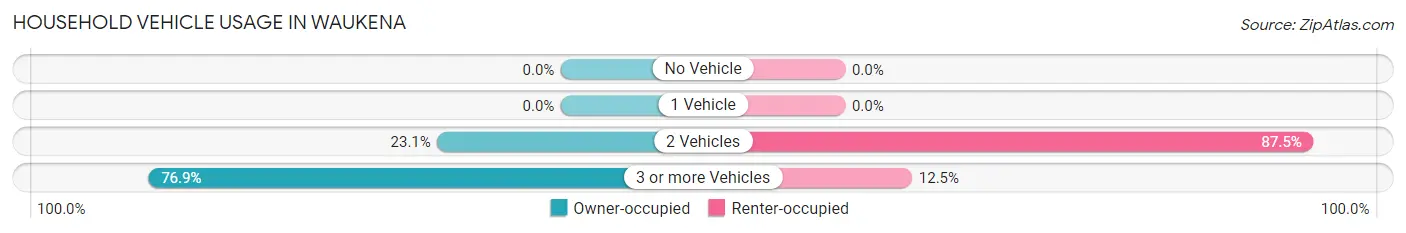
| Vehicles per Household | Owner-occupied | Renter-occupied |
| No Vehicle | 0 (0.0%) | 0 (0.0%) |
| 1 Vehicle | 0 (0.0%) | 0 (0.0%) |
| 2 Vehicles | 3 (23.1%) | 7 (87.5%) |
| 3 or more Vehicles | 10 (76.9%) | 1 (12.5%) |
| Total | 13 (100.0%) | 8 (100.0%) |
Real Estate & Mortgages in Waukena
Real Estate and Mortgage Overview in Waukena
| Characteristic | Without Mortgage | With Mortgage |
| Housing Units | 2 | 11 |
| Median Property Value | - | - |
| Median Household Income | - | - |
| Monthly Housing Costs | - | - |
| Real Estate Taxes | - | - |
Property Value by Mortgage Status in Waukena
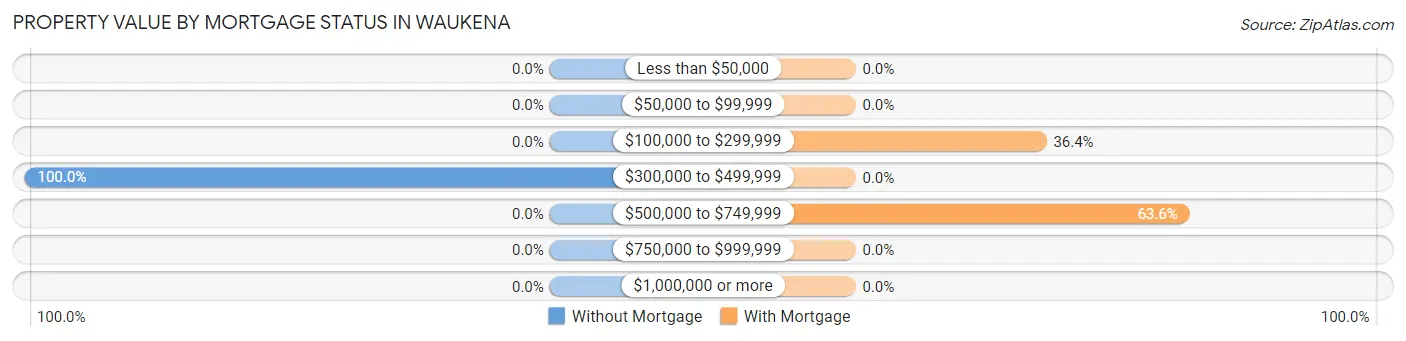
| Property Value | Without Mortgage | With Mortgage |
| Less than $50,000 | 0 (0.0%) | 0 (0.0%) |
| $50,000 to $99,999 | 0 (0.0%) | 0 (0.0%) |
| $100,000 to $299,999 | 0 (0.0%) | 4 (36.4%) |
| $300,000 to $499,999 | 2 (100.0%) | 0 (0.0%) |
| $500,000 to $749,999 | 0 (0.0%) | 7 (63.6%) |
| $750,000 to $999,999 | 0 (0.0%) | 0 (0.0%) |
| $1,000,000 or more | 0 (0.0%) | 0 (0.0%) |
| Total | 2 (100.0%) | 11 (100.0%) |
Household Income by Mortgage Status in Waukena
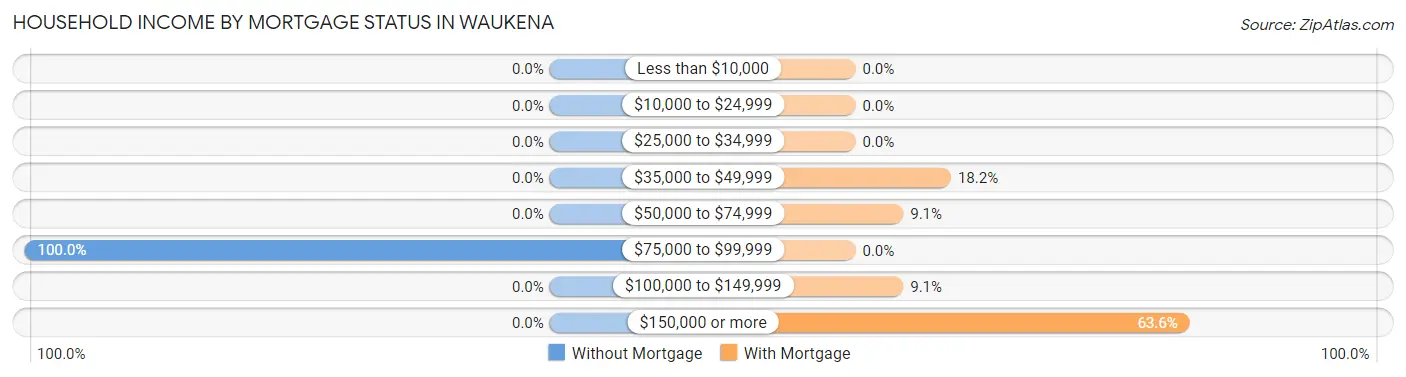
| Household Income | Without Mortgage | With Mortgage |
| Less than $10,000 | 0 (0.0%) | 0 (0.0%) |
| $10,000 to $24,999 | 0 (0.0%) | 0 (0.0%) |
| $25,000 to $34,999 | 0 (0.0%) | 0 (0.0%) |
| $35,000 to $49,999 | 0 (0.0%) | 2 (18.2%) |
| $50,000 to $74,999 | 0 (0.0%) | 1 (9.1%) |
| $75,000 to $99,999 | 2 (100.0%) | 0 (0.0%) |
| $100,000 to $149,999 | 0 (0.0%) | 1 (9.1%) |
| $150,000 or more | 0 (0.0%) | 7 (63.6%) |
| Total | 2 (100.0%) | 11 (100.0%) |
Property Value to Household Income Ratio in Waukena
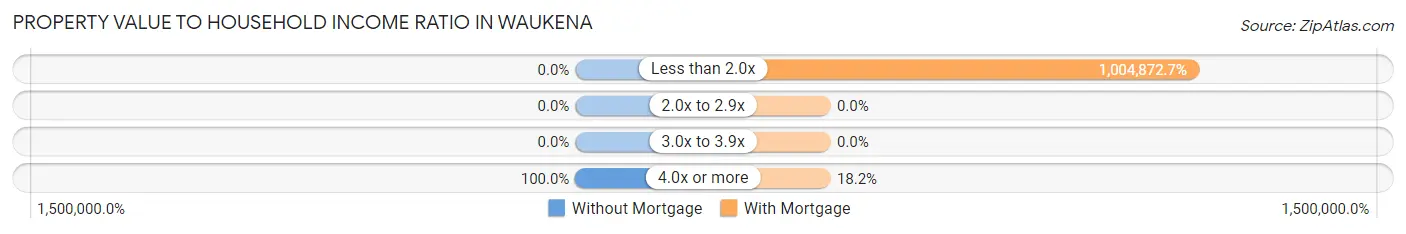
| Value-to-Income Ratio | Without Mortgage | With Mortgage |
| Less than 2.0x | 0 (0.0%) | 110,536 (1,004,872.7%) |
| 2.0x to 2.9x | 0 (0.0%) | 0 (0.0%) |
| 3.0x to 3.9x | 0 (0.0%) | 0 (0.0%) |
| 4.0x or more | 2 (100.0%) | 2 (18.2%) |
| Total | 2 (100.0%) | 11 (100.0%) |
Real Estate Taxes by Mortgage Status in Waukena
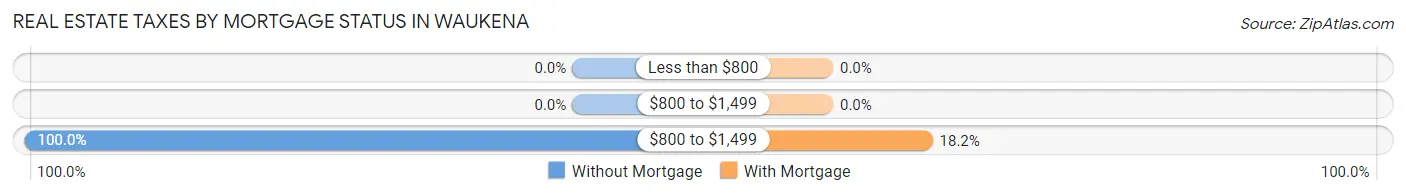
| Property Taxes | Without Mortgage | With Mortgage |
| Less than $800 | 0 (0.0%) | 0 (0.0%) |
| $800 to $1,499 | 0 (0.0%) | 0 (0.0%) |
| $800 to $1,499 | 2 (100.0%) | 2 (18.2%) |
| Total | 2 (100.0%) | 11 (100.0%) |
Health & Disability in Waukena
Health Insurance Coverage by Age in Waukena
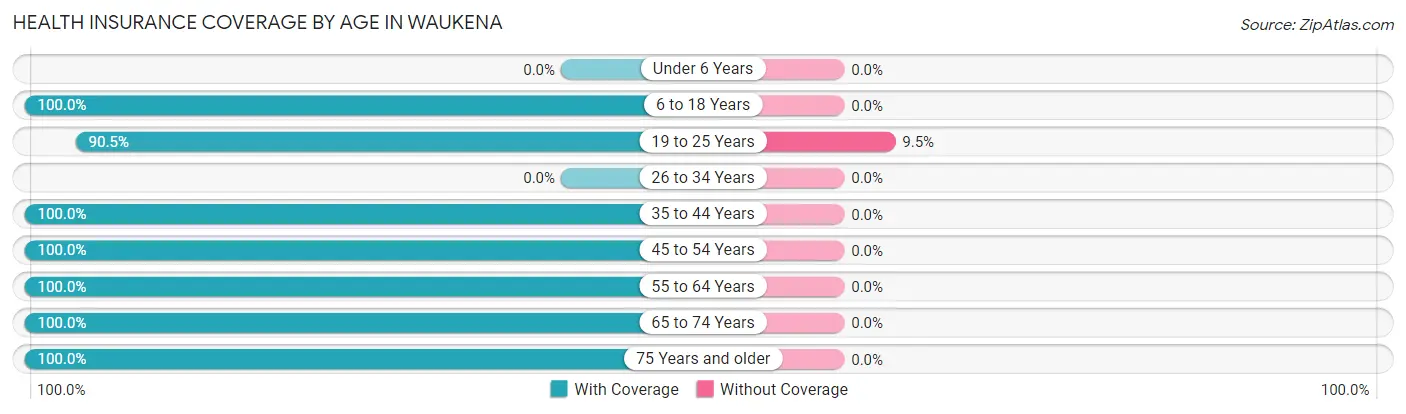
| Age Bracket | With Coverage | Without Coverage |
| Under 6 Years | 0 (0.0%) | 0 (0.0%) |
| 6 to 18 Years | 7 (100.0%) | 0 (0.0%) |
| 19 to 25 Years | 19 (90.5%) | 2 (9.5%) |
| 26 to 34 Years | 0 (0.0%) | 0 (0.0%) |
| 35 to 44 Years | 7 (100.0%) | 0 (0.0%) |
| 45 to 54 Years | 9 (100.0%) | 0 (0.0%) |
| 55 to 64 Years | 9 (100.0%) | 0 (0.0%) |
| 65 to 74 Years | 4 (100.0%) | 0 (0.0%) |
| 75 Years and older | 6 (100.0%) | 0 (0.0%) |
| Total | 61 (96.8%) | 2 (3.2%) |
Health Insurance Coverage by Citizenship Status in Waukena
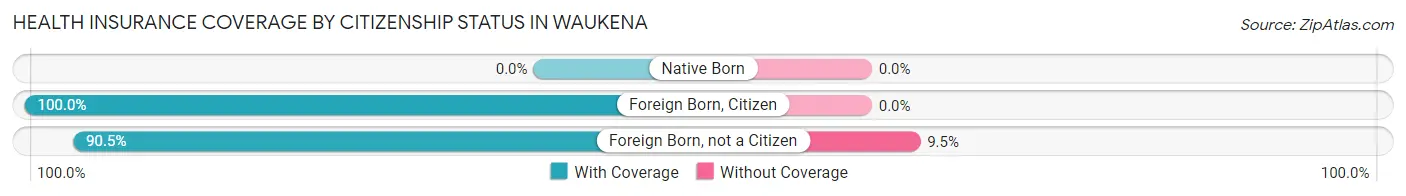
| Citizenship Status | With Coverage | Without Coverage |
| Native Born | 0 (0.0%) | 0 (0.0%) |
| Foreign Born, Citizen | 7 (100.0%) | 0 (0.0%) |
| Foreign Born, not a Citizen | 19 (90.5%) | 2 (9.5%) |
Health Insurance Coverage by Household Income in Waukena
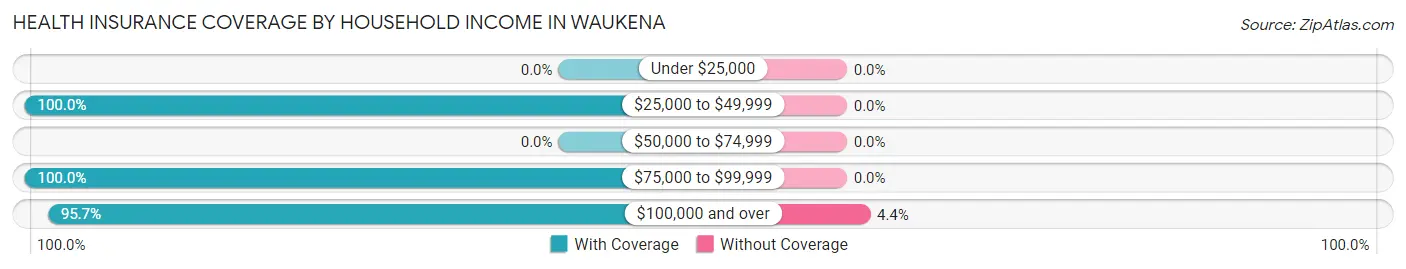
| Household Income | With Coverage | Without Coverage |
| Under $25,000 | 0 (0.0%) | 0 (0.0%) |
| $25,000 to $49,999 | 5 (100.0%) | 0 (0.0%) |
| $50,000 to $74,999 | 0 (0.0%) | 0 (0.0%) |
| $75,000 to $99,999 | 12 (100.0%) | 0 (0.0%) |
| $100,000 and over | 44 (95.7%) | 2 (4.3%) |
Public vs Private Health Insurance Coverage by Age in Waukena
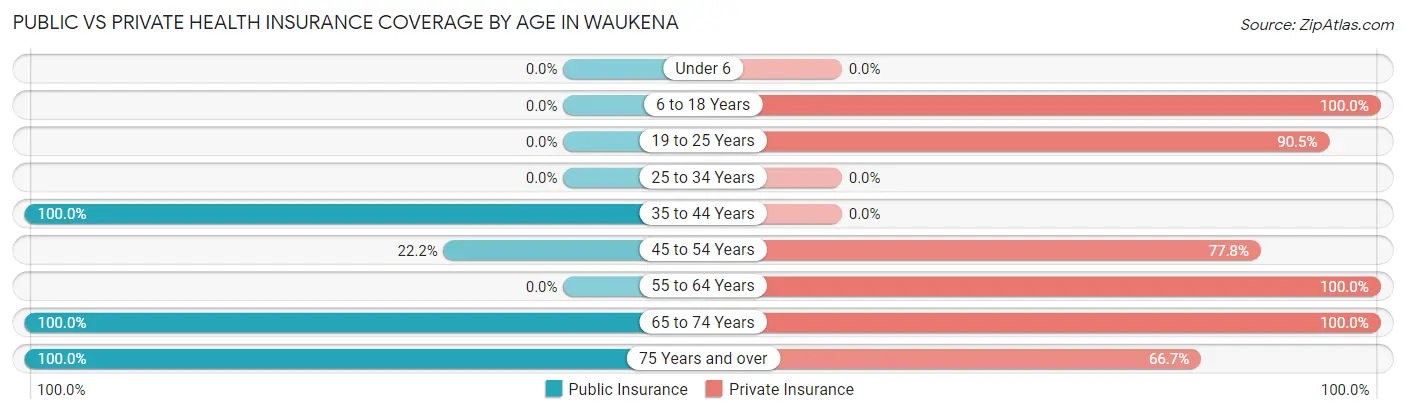
| Age Bracket | Public Insurance | Private Insurance |
| Under 6 | 0 (0.0%) | 0 (0.0%) |
| 6 to 18 Years | 0 (0.0%) | 7 (100.0%) |
| 19 to 25 Years | 0 (0.0%) | 19 (90.5%) |
| 25 to 34 Years | 0 (0.0%) | 0 (0.0%) |
| 35 to 44 Years | 7 (100.0%) | 0 (0.0%) |
| 45 to 54 Years | 2 (22.2%) | 7 (77.8%) |
| 55 to 64 Years | 0 (0.0%) | 9 (100.0%) |
| 65 to 74 Years | 4 (100.0%) | 4 (100.0%) |
| 75 Years and over | 6 (100.0%) | 4 (66.7%) |
| Total | 19 (30.2%) | 50 (79.4%) |
Disability Status by Sex by Age in Waukena
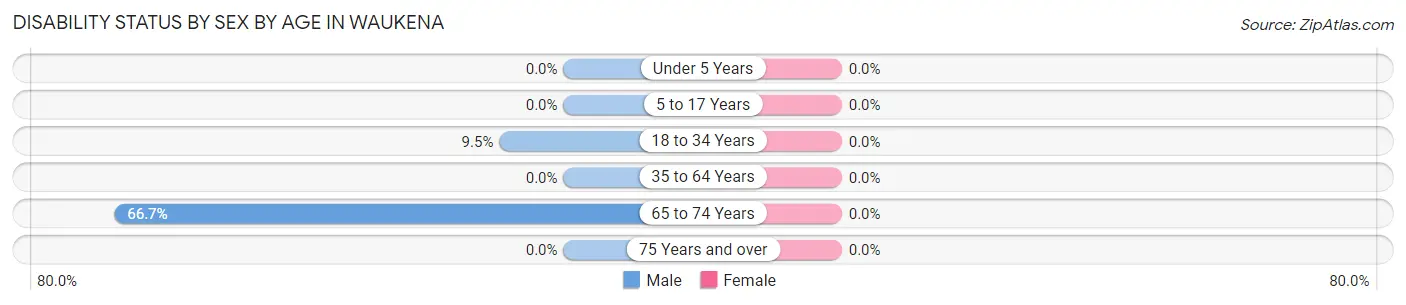
| Age Bracket | Male | Female |
| Under 5 Years | 0 (0.0%) | 0 (0.0%) |
| 5 to 17 Years | 0 (0.0%) | 0 (0.0%) |
| 18 to 34 Years | 2 (9.5%) | 0 (0.0%) |
| 35 to 64 Years | 0 (0.0%) | 0 (0.0%) |
| 65 to 74 Years | 2 (66.7%) | 0 (0.0%) |
| 75 Years and over | 0 (0.0%) | 0 (0.0%) |
Disability Class by Sex by Age in Waukena
Disability Class: Hearing Difficulty
| Age Bracket | Male | Female |
| Under 5 Years | 0 (0.0%) | 0 (0.0%) |
| 5 to 17 Years | 0 (0.0%) | 0 (0.0%) |
| 18 to 34 Years | 0 (0.0%) | 0 (0.0%) |
| 35 to 64 Years | 0 (0.0%) | 0 (0.0%) |
| 65 to 74 Years | 0 (0.0%) | 0 (0.0%) |
| 75 Years and over | 0 (0.0%) | 0 (0.0%) |
Disability Class: Vision Difficulty
| Age Bracket | Male | Female |
| Under 5 Years | 0 (0.0%) | 0 (0.0%) |
| 5 to 17 Years | 0 (0.0%) | 0 (0.0%) |
| 18 to 34 Years | 2 (9.5%) | 0 (0.0%) |
| 35 to 64 Years | 0 (0.0%) | 0 (0.0%) |
| 65 to 74 Years | 0 (0.0%) | 0 (0.0%) |
| 75 Years and over | 0 (0.0%) | 0 (0.0%) |
Disability Class: Cognitive Difficulty
| Age Bracket | Male | Female |
| 5 to 17 Years | 0 (0.0%) | 0 (0.0%) |
| 18 to 34 Years | 2 (9.5%) | 0 (0.0%) |
| 35 to 64 Years | 0 (0.0%) | 0 (0.0%) |
| 65 to 74 Years | 0 (0.0%) | 0 (0.0%) |
| 75 Years and over | 0 (0.0%) | 0 (0.0%) |
Disability Class: Ambulatory Difficulty
| Age Bracket | Male | Female |
| 5 to 17 Years | 0 (0.0%) | 0 (0.0%) |
| 18 to 34 Years | 0 (0.0%) | 0 (0.0%) |
| 35 to 64 Years | 0 (0.0%) | 0 (0.0%) |
| 65 to 74 Years | 2 (66.7%) | 0 (0.0%) |
| 75 Years and over | 0 (0.0%) | 0 (0.0%) |
Disability Class: Self-Care Difficulty
| Age Bracket | Male | Female |
| 5 to 17 Years | 0 (0.0%) | 0 (0.0%) |
| 18 to 34 Years | 0 (0.0%) | 0 (0.0%) |
| 35 to 64 Years | 0 (0.0%) | 0 (0.0%) |
| 65 to 74 Years | 0 (0.0%) | 0 (0.0%) |
| 75 Years and over | 0 (0.0%) | 0 (0.0%) |
Technology Access in Waukena
Computing Device Access in Waukena
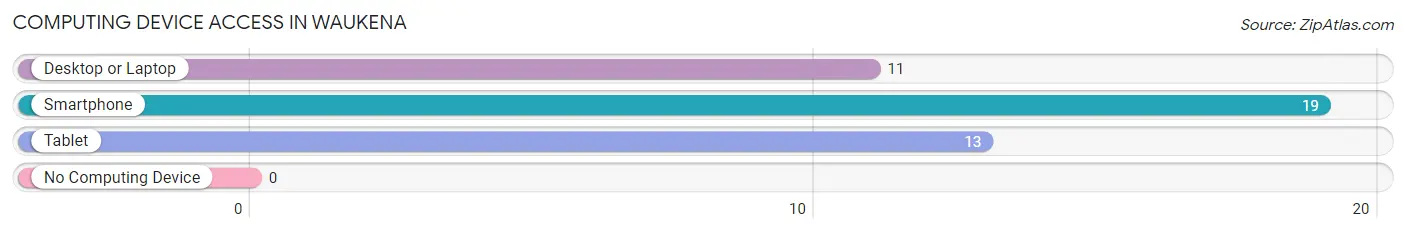
| Device Type | # Households | % Households |
| Desktop or Laptop | 11 | 52.4% |
| Smartphone | 19 | 90.5% |
| Tablet | 13 | 61.9% |
| No Computing Device | 0 | 0.0% |
| Total | 21 | 100.0% |
Internet Access in Waukena
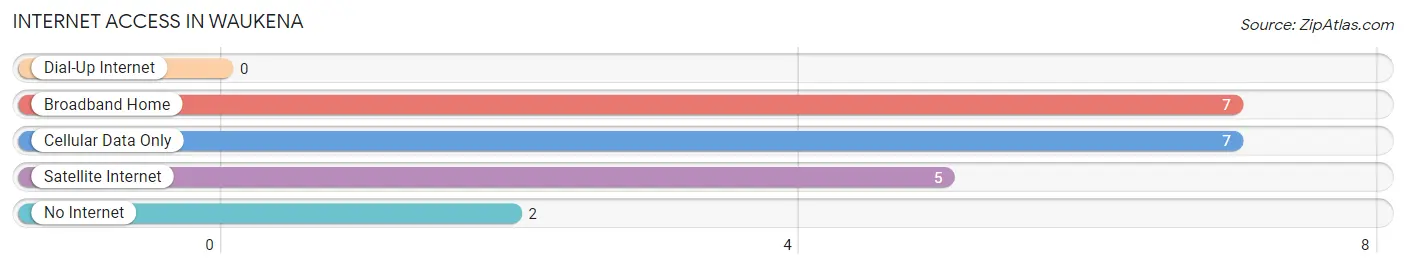
| Internet Type | # Households | % Households |
| Dial-Up Internet | 0 | 0.0% |
| Broadband Home | 7 | 33.3% |
| Cellular Data Only | 7 | 33.3% |
| Satellite Internet | 5 | 23.8% |
| No Internet | 2 | 9.5% |
| Total | 21 | 100.0% |
Waukena Summary
Waukena is a small unincorporated community located in Tulare County, California. It is situated in the San Joaquin Valley, approximately 8 miles south of Visalia and 8 miles north of Hanford. The population of Waukena was estimated to be around 1,000 in 2020.
History
Waukena was founded in 1891 by the Southern Pacific Railroad. The town was named after the Waukena Indians, a Native American tribe that lived in the area. The town was originally a stop on the railroad line, but it soon became a thriving agricultural community. The town was home to a variety of businesses, including a hotel, a general store, a blacksmith shop, and a post office.
In the early 1900s, Waukena was a popular destination for tourists. The town was known for its hot springs, which were believed to have healing properties. The hot springs were also used to power a nearby flour mill.
In the 1920s, Waukena was home to a large Japanese-American population. The town was home to a Japanese-American school, a Buddhist temple, and a Japanese-American newspaper.
Geography
Waukena is located in the San Joaquin Valley, approximately 8 miles south of Visalia and 8 miles north of Hanford. The town is situated at an elevation of approximately 200 feet above sea level. The climate in Waukena is hot and dry, with temperatures ranging from the mid-90s in the summer to the mid-50s in the winter.
The town is surrounded by agricultural land, including vineyards, orchards, and fields of cotton, alfalfa, and other crops. The nearby Tule River provides irrigation for the surrounding farms.
Economy
The economy of Waukena is largely based on agriculture. The town is home to a variety of farms, including vineyards, orchards, and fields of cotton, alfalfa, and other crops. The nearby Tule River provides irrigation for the surrounding farms.
In addition to agriculture, Waukena is home to a variety of small businesses, including a gas station, a grocery store, and a hardware store. The town is also home to a number of restaurants, including Mexican, Chinese, and American cuisine.
Demographics
The population of Waukena was estimated to be around 1,000 in 2020. The town is predominantly Hispanic, with a large percentage of the population being of Mexican descent. The town is also home to a small Japanese-American population.
The median household income in Waukena is approximately $45,000, and the median home value is approximately $200,000. The town has a poverty rate of approximately 20%, which is higher than the national average.
Conclusion
Waukena is a small unincorporated community located in Tulare County, California. It is situated in the San Joaquin Valley, approximately 8 miles south of Visalia and 8 miles north of Hanford. The population of Waukena was estimated to be around 1,000 in 2020. The town is predominantly Hispanic, with a large percentage of the population being of Mexican descent. The economy of Waukena is largely based on agriculture, with a variety of small businesses also located in the town. The median household income in Waukena is approximately $45,000, and the median home value is approximately $200,000.
Common Questions
What is Per Capita Income in Waukena?
Per Capita income in Waukena is $30,548.
What is the Median Family Income in Waukena?
Median Family Income in Waukena is $110,714.
What is the Median Household income in Waukena?
Median Household Income in Waukena is $78,750.
What is Inequality or Gini Index in Waukena?
Inequality or Gini Index in Waukena is 0.17.
What is the Total Population of Waukena?
Total Population of Waukena is 63.
What is the Total Male Population of Waukena?
Total Male Population of Waukena is 50.
What is the Total Female Population of Waukena?
Total Female Population of Waukena is 13.
What is the Ratio of Males per 100 Females in Waukena?
There are 384.62 Males per 100 Females in Waukena.
What is the Ratio of Females per 100 Males in Waukena?
There are 26.00 Females per 100 Males in Waukena.
What is the Median Population Age in Waukena?
Median Population Age in Waukena is 44.5 Years.
What is the Average Family Size in Waukena
Average Family Size in Waukena is 4.5 People.
What is the Average Household Size in Waukena
Average Household Size in Waukena is 3.0 People.
How Large is the Labor Force in Waukena?
There are 36 People in the Labor Forcein in Waukena.
What is the Percentage of People in the Labor Force in Waukena?
64.3% of People are in the Labor Force in Waukena.
What is the Unemployment Rate in Waukena?
Unemployment Rate in Waukena is 25.0%.