Cities with the Most Immigrants from Fiji in California
RELATED REPORTS & OPTIONS
Fiji
California
Compare Cities
Map of Cities with the Most Immigrants from Fiji in California
0
8,000
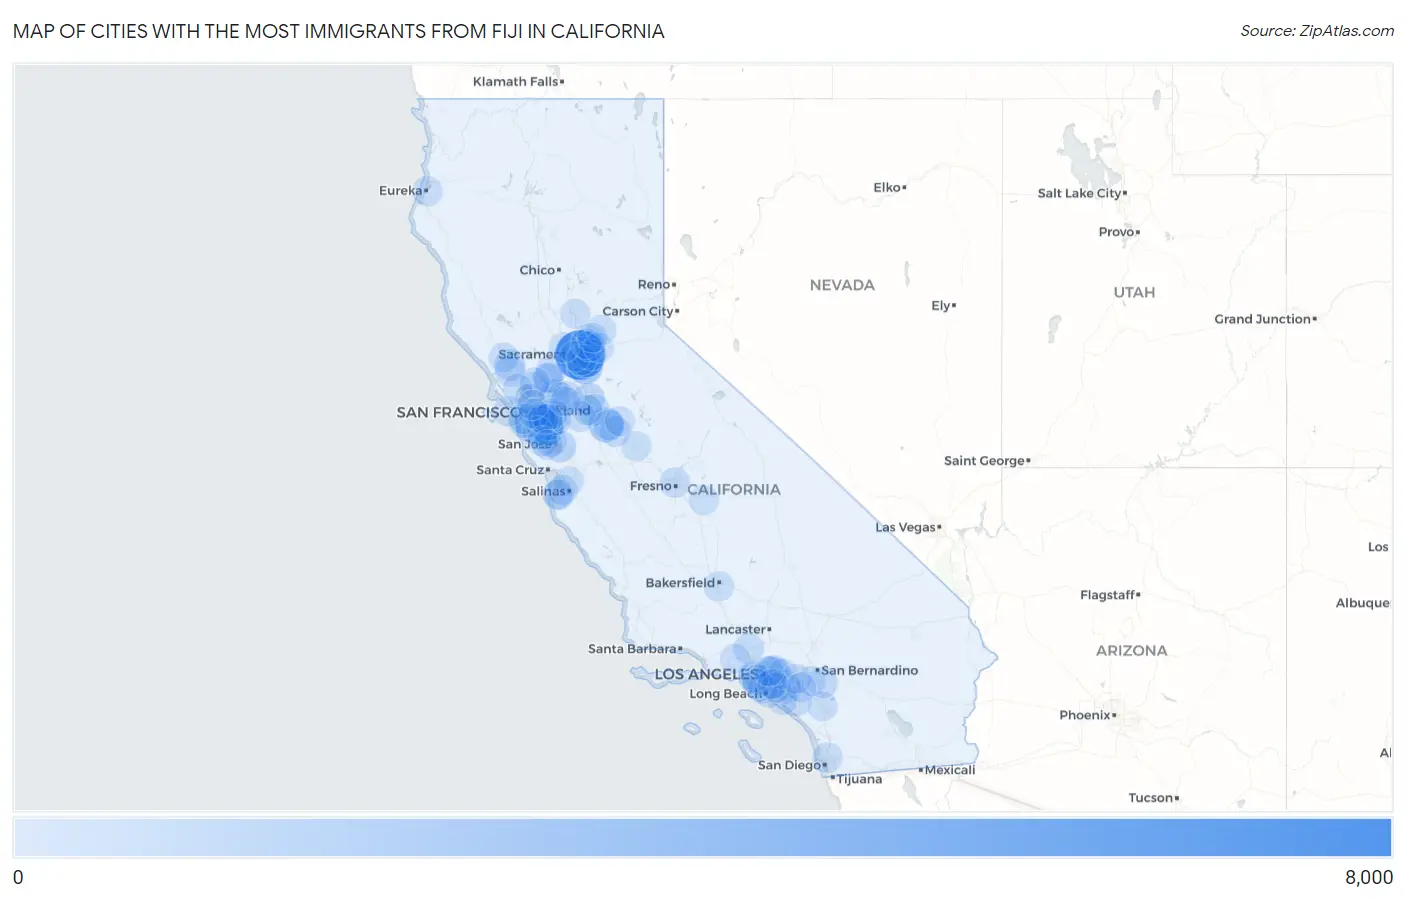
Cities with the Most Immigrants from Fiji in California
| City | Fiji | vs State | vs National | |
| 1. | Sacramento | 6,115 | 33,937(18.02%)#1 | 43,247(14.14%)#1 |
| 2. | Hayward | 2,049 | 33,937(6.04%)#2 | 43,247(4.74%)#2 |
| 3. | Elk Grove | 1,799 | 33,937(5.30%)#3 | 43,247(4.16%)#3 |
| 4. | Modesto | 1,498 | 33,937(4.41%)#4 | 43,247(3.46%)#4 |
| 5. | Florin | 777 | 33,937(2.29%)#5 | 43,247(1.80%)#6 |
| 6. | San Jose | 740 | 33,937(2.18%)#6 | 43,247(1.71%)#7 |
| 7. | Stockton | 619 | 33,937(1.82%)#7 | 43,247(1.43%)#8 |
| 8. | Vineyard | 596 | 33,937(1.76%)#8 | 43,247(1.38%)#9 |
| 9. | Arden Arcade | 592 | 33,937(1.74%)#9 | 43,247(1.37%)#10 |
| 10. | Manteca | 560 | 33,937(1.65%)#10 | 43,247(1.29%)#11 |
| 11. | Pittsburg | 557 | 33,937(1.64%)#11 | 43,247(1.29%)#12 |
| 12. | South San Francisco | 488 | 33,937(1.44%)#12 | 43,247(1.13%)#13 |
| 13. | Santa Rosa | 484 | 33,937(1.43%)#13 | 43,247(1.12%)#14 |
| 14. | San Mateo | 445 | 33,937(1.31%)#14 | 43,247(1.03%)#15 |
| 15. | Santa Clara | 392 | 33,937(1.16%)#15 | 43,247(0.91%)#16 |
| 16. | Los Angeles | 366 | 33,937(1.08%)#16 | 43,247(0.85%)#17 |
| 17. | Oakland | 360 | 33,937(1.06%)#17 | 43,247(0.83%)#18 |
| 18. | San Bruno | 360 | 33,937(1.06%)#18 | 43,247(0.83%)#19 |
| 19. | Newark | 359 | 33,937(1.06%)#19 | 43,247(0.83%)#20 |
| 20. | Roseville | 336 | 33,937(0.99%)#20 | 43,247(0.78%)#21 |
| 21. | Fremont | 330 | 33,937(0.97%)#21 | 43,247(0.76%)#22 |
| 22. | East Palo Alto | 303 | 33,937(0.89%)#22 | 43,247(0.70%)#23 |
| 23. | Santa Clarita | 299 | 33,937(0.88%)#23 | 43,247(0.69%)#24 |
| 24. | Turlock | 291 | 33,937(0.86%)#24 | 43,247(0.67%)#25 |
| 25. | Tracy | 285 | 33,937(0.84%)#25 | 43,247(0.66%)#26 |
| 26. | Daly City | 266 | 33,937(0.78%)#26 | 43,247(0.62%)#27 |
| 27. | San Francisco | 264 | 33,937(0.78%)#27 | 43,247(0.61%)#29 |
| 28. | Moreno Valley | 259 | 33,937(0.76%)#28 | 43,247(0.60%)#30 |
| 29. | Rancho Cordova | 246 | 33,937(0.72%)#29 | 43,247(0.57%)#31 |
| 30. | El Monte | 238 | 33,937(0.70%)#30 | 43,247(0.55%)#33 |
| 31. | Castro Valley | 238 | 33,937(0.70%)#31 | 43,247(0.55%)#34 |
| 32. | West Sacramento | 225 | 33,937(0.66%)#32 | 43,247(0.52%)#35 |
| 33. | Fresno | 211 | 33,937(0.62%)#33 | 43,247(0.49%)#37 |
| 34. | Ceres | 195 | 33,937(0.57%)#34 | 43,247(0.45%)#40 |
| 35. | Rohnert Park | 194 | 33,937(0.57%)#35 | 43,247(0.45%)#41 |
| 36. | Inglewood | 188 | 33,937(0.55%)#36 | 43,247(0.43%)#43 |
| 37. | Vallejo | 179 | 33,937(0.53%)#37 | 43,247(0.41%)#44 |
| 38. | Lake Forest | 176 | 33,937(0.52%)#38 | 43,247(0.41%)#45 |
| 39. | Seaside | 176 | 33,937(0.52%)#39 | 43,247(0.41%)#46 |
| 40. | Parkway | 175 | 33,937(0.52%)#40 | 43,247(0.40%)#47 |
| 41. | Fairfield | 172 | 33,937(0.51%)#41 | 43,247(0.40%)#49 |
| 42. | Richmond | 168 | 33,937(0.50%)#42 | 43,247(0.39%)#50 |
| 43. | Placentia | 166 | 33,937(0.49%)#43 | 43,247(0.38%)#53 |
| 44. | Ashland | 166 | 33,937(0.49%)#44 | 43,247(0.38%)#54 |
| 45. | Union City | 158 | 33,937(0.47%)#45 | 43,247(0.37%)#55 |
| 46. | San Diego | 148 | 33,937(0.44%)#46 | 43,247(0.34%)#57 |
| 47. | San Gabriel | 138 | 33,937(0.41%)#47 | 43,247(0.32%)#59 |
| 48. | Eureka | 137 | 33,937(0.40%)#48 | 43,247(0.32%)#60 |
| 49. | Vacaville | 136 | 33,937(0.40%)#49 | 43,247(0.31%)#61 |
| 50. | Dublin | 135 | 33,937(0.40%)#50 | 43,247(0.31%)#63 |
| 51. | Bakersfield | 134 | 33,937(0.39%)#51 | 43,247(0.31%)#64 |
| 52. | Oakley | 134 | 33,937(0.39%)#52 | 43,247(0.31%)#65 |
| 53. | Anaheim | 131 | 33,937(0.39%)#53 | 43,247(0.30%)#67 |
| 54. | Suisun City | 127 | 33,937(0.37%)#54 | 43,247(0.29%)#68 |
| 55. | Bellflower | 124 | 33,937(0.37%)#55 | 43,247(0.29%)#69 |
| 56. | San Lorenzo | 124 | 33,937(0.37%)#56 | 43,247(0.29%)#70 |
| 57. | San Leandro | 123 | 33,937(0.36%)#57 | 43,247(0.28%)#71 |
| 58. | Pleasanton | 123 | 33,937(0.36%)#58 | 43,247(0.28%)#72 |
| 59. | Long Beach | 116 | 33,937(0.34%)#59 | 43,247(0.27%)#73 |
| 60. | San Ramon | 114 | 33,937(0.34%)#60 | 43,247(0.26%)#75 |
| 61. | Lathrop | 112 | 33,937(0.33%)#61 | 43,247(0.26%)#78 |
| 62. | Temple City | 109 | 33,937(0.32%)#62 | 43,247(0.25%)#79 |
| 63. | Costa Mesa | 108 | 33,937(0.32%)#63 | 43,247(0.25%)#80 |
| 64. | Carson | 107 | 33,937(0.32%)#64 | 43,247(0.25%)#81 |
| 65. | West Covina | 105 | 33,937(0.31%)#65 | 43,247(0.24%)#82 |
| 66. | Cherryland | 100 | 33,937(0.29%)#66 | 43,247(0.23%)#88 |
| 67. | Antelope | 98 | 33,937(0.29%)#67 | 43,247(0.23%)#89 |
| 68. | Waterford | 98 | 33,937(0.29%)#68 | 43,247(0.23%)#90 |
| 69. | Citrus Heights | 97 | 33,937(0.29%)#69 | 43,247(0.22%)#91 |
| 70. | American Canyon | 96 | 33,937(0.28%)#70 | 43,247(0.22%)#92 |
| 71. | Culver City | 94 | 33,937(0.28%)#71 | 43,247(0.22%)#94 |
| 72. | Riverside | 85 | 33,937(0.25%)#72 | 43,247(0.20%)#97 |
| 73. | Redwood City | 85 | 33,937(0.25%)#73 | 43,247(0.20%)#98 |
| 74. | Antioch | 83 | 33,937(0.24%)#74 | 43,247(0.19%)#99 |
| 75. | Chino | 78 | 33,937(0.23%)#75 | 43,247(0.18%)#102 |
| 76. | Alameda | 78 | 33,937(0.23%)#76 | 43,247(0.18%)#103 |
| 77. | Orosi | 78 | 33,937(0.23%)#77 | 43,247(0.18%)#104 |
| 78. | Simi Valley | 77 | 33,937(0.23%)#78 | 43,247(0.18%)#105 |
| 79. | Hawthorne | 77 | 33,937(0.23%)#79 | 43,247(0.18%)#106 |
| 80. | Marina | 77 | 33,937(0.23%)#80 | 43,247(0.18%)#107 |
| 81. | Auburn | 76 | 33,937(0.22%)#81 | 43,247(0.18%)#109 |
| 82. | Prunedale | 73 | 33,937(0.22%)#82 | 43,247(0.17%)#111 |
| 83. | Woodland | 72 | 33,937(0.21%)#83 | 43,247(0.17%)#114 |
| 84. | Folsom | 70 | 33,937(0.21%)#84 | 43,247(0.16%)#116 |
| 85. | Fairview | 69 | 33,937(0.20%)#85 | 43,247(0.16%)#118 |
| 86. | Murrieta | 66 | 33,937(0.19%)#86 | 43,247(0.15%)#120 |
| 87. | Windsor | 66 | 33,937(0.19%)#87 | 43,247(0.15%)#122 |
| 88. | Merced | 63 | 33,937(0.19%)#88 | 43,247(0.15%)#127 |
| 89. | Monterey | 63 | 33,937(0.19%)#89 | 43,247(0.15%)#129 |
| 90. | Los Altos Hills | 63 | 33,937(0.19%)#90 | 43,247(0.15%)#130 |
| 91. | Buena Park | 61 | 33,937(0.18%)#91 | 43,247(0.14%)#132 |
| 92. | Corona | 59 | 33,937(0.17%)#92 | 43,247(0.14%)#134 |
| 93. | Rocklin | 59 | 33,937(0.17%)#93 | 43,247(0.14%)#135 |
| 94. | Novato | 59 | 33,937(0.17%)#94 | 43,247(0.14%)#136 |
| 95. | Norwalk | 58 | 33,937(0.17%)#95 | 43,247(0.13%)#138 |
| 96. | Berkeley | 57 | 33,937(0.17%)#96 | 43,247(0.13%)#139 |
| 97. | Cupertino | 57 | 33,937(0.17%)#97 | 43,247(0.13%)#140 |
| 98. | Linda | 57 | 33,937(0.17%)#98 | 43,247(0.13%)#141 |
| 99. | Alhambra | 56 | 33,937(0.17%)#99 | 43,247(0.13%)#143 |
| 100. | Brentwood | 55 | 33,937(0.16%)#100 | 43,247(0.13%)#145 |
Common Questions
What are the Top 10 Cities with the Most Immigrants from Fiji in California?
Top 10 Cities with the Most Immigrants from Fiji in California are:
#1
6,115
#2
2,049
#3
1,799
#4
1,498
#5
777
#6
740
#7
619
#8
596
#9
592
#10
560
What city has the Most Immigrants from Fiji in California?
Sacramento has the Most Immigrants from Fiji in California with 6,115.
What is the Total Immigrants from Fiji in the State of California?
Total Immigrants from Fiji in California is 33,937.
What is the Total Immigrants from Fiji in the United States?
Total Immigrants from Fiji in the United States is 43,247.