Cities with the Most Immigrants from South Africa in California
RELATED REPORTS & OPTIONS
South Africa
California
Compare Cities
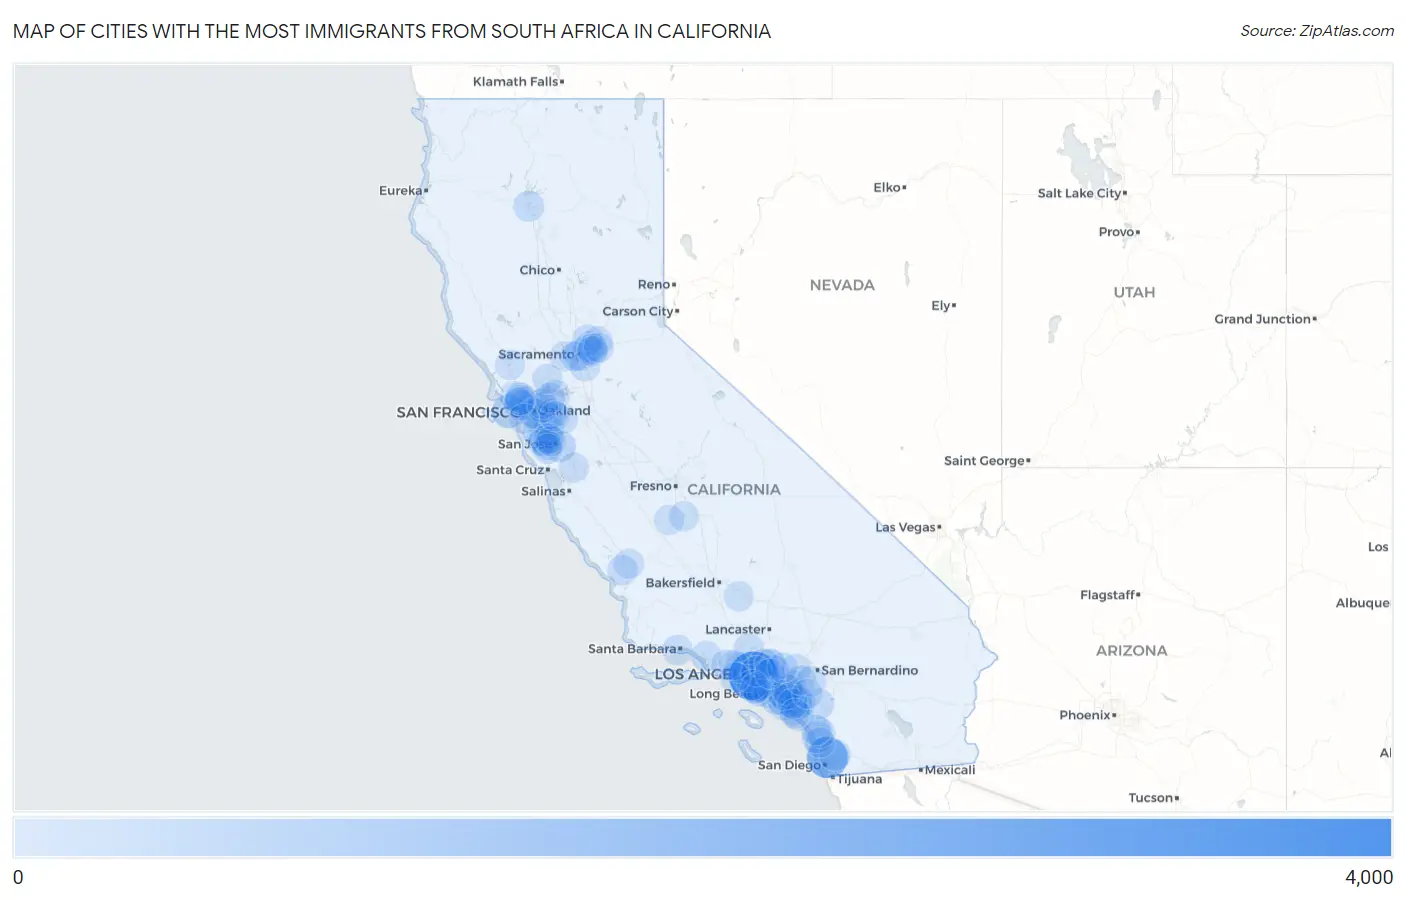
Map of Cities with the Most Immigrants from South Africa in California
0
4,000
Cities with the Most Immigrants from South Africa in California
| City | South Africa | vs State | vs National | |
| 1. | Los Angeles | 3,232 | 20,614(15.68%)#1 | 117,055(2.76%)#2 |
| 2. | San Diego | 1,810 | 20,614(8.78%)#2 | 117,055(1.55%)#3 |
| 3. | Irvine | 784 | 20,614(3.80%)#3 | 117,055(0.67%)#9 |
| 4. | San Francisco | 582 | 20,614(2.82%)#4 | 117,055(0.50%)#12 |
| 5. | San Jose | 309 | 20,614(1.50%)#5 | 117,055(0.26%)#26 |
| 6. | Huntington Beach | 297 | 20,614(1.44%)#6 | 117,055(0.25%)#29 |
| 7. | Mission Viejo | 293 | 20,614(1.42%)#7 | 117,055(0.25%)#31 |
| 8. | Sacramento | 288 | 20,614(1.40%)#8 | 117,055(0.25%)#34 |
| 9. | Santa Monica | 268 | 20,614(1.30%)#9 | 117,055(0.23%)#41 |
| 10. | Carlsbad | 263 | 20,614(1.28%)#10 | 117,055(0.22%)#45 |
| 11. | Berkeley | 238 | 20,614(1.15%)#11 | 117,055(0.20%)#52 |
| 12. | Santee | 237 | 20,614(1.15%)#12 | 117,055(0.20%)#54 |
| 13. | Lake Forest | 229 | 20,614(1.11%)#13 | 117,055(0.20%)#58 |
| 14. | Mountain View | 226 | 20,614(1.10%)#14 | 117,055(0.19%)#59 |
| 15. | Yorba Linda | 204 | 20,614(0.99%)#15 | 117,055(0.17%)#65 |
| 16. | Calabasas | 203 | 20,614(0.98%)#16 | 117,055(0.17%)#66 |
| 17. | Long Beach | 192 | 20,614(0.93%)#17 | 117,055(0.16%)#70 |
| 18. | Redding | 168 | 20,614(0.81%)#18 | 117,055(0.14%)#82 |
| 19. | Palo Alto | 149 | 20,614(0.72%)#19 | 117,055(0.13%)#98 |
| 20. | Laguna Niguel | 149 | 20,614(0.72%)#20 | 117,055(0.13%)#99 |
| 21. | Rancho Santa Margarita | 149 | 20,614(0.72%)#21 | 117,055(0.13%)#100 |
| 22. | Roseville | 144 | 20,614(0.70%)#22 | 117,055(0.12%)#105 |
| 23. | Oakland | 141 | 20,614(0.68%)#23 | 117,055(0.12%)#109 |
| 24. | Vista | 138 | 20,614(0.67%)#24 | 117,055(0.12%)#112 |
| 25. | Wildomar | 136 | 20,614(0.66%)#25 | 117,055(0.12%)#113 |
| 26. | Artesia | 131 | 20,614(0.64%)#26 | 117,055(0.11%)#115 |
| 27. | Pasadena | 129 | 20,614(0.63%)#27 | 117,055(0.11%)#117 |
| 28. | Newport Beach | 125 | 20,614(0.61%)#28 | 117,055(0.11%)#120 |
| 29. | Anaheim | 122 | 20,614(0.59%)#29 | 117,055(0.10%)#126 |
| 30. | Costa Mesa | 122 | 20,614(0.59%)#30 | 117,055(0.10%)#127 |
| 31. | Bakersfield Country Club | 120 | 20,614(0.58%)#31 | 117,055(0.10%)#130 |
| 32. | Tamalpais Homestead Valley | 119 | 20,614(0.58%)#32 | 117,055(0.10%)#133 |
| 33. | Orange | 118 | 20,614(0.57%)#33 | 117,055(0.10%)#134 |
| 34. | Castro Valley | 118 | 20,614(0.57%)#34 | 117,055(0.10%)#135 |
| 35. | Santa Barbara | 117 | 20,614(0.57%)#35 | 117,055(0.10%)#138 |
| 36. | Citrus Heights | 112 | 20,614(0.54%)#36 | 117,055(0.10%)#149 |
| 37. | Tiburon | 106 | 20,614(0.51%)#37 | 117,055(0.09%)#162 |
| 38. | Livermore | 104 | 20,614(0.50%)#38 | 117,055(0.09%)#167 |
| 39. | Pittsburg | 104 | 20,614(0.50%)#39 | 117,055(0.09%)#168 |
| 40. | Altadena | 102 | 20,614(0.49%)#40 | 117,055(0.09%)#175 |
| 41. | Fairfax | 99 | 20,614(0.48%)#41 | 117,055(0.08%)#178 |
| 42. | San Buenaventura Ventura | 98 | 20,614(0.48%)#42 | 117,055(0.08%)#181 |
| 43. | Temple City | 97 | 20,614(0.47%)#43 | 117,055(0.08%)#190 |
| 44. | Thousand Oaks | 96 | 20,614(0.47%)#44 | 117,055(0.08%)#191 |
| 45. | North Tustin | 96 | 20,614(0.47%)#45 | 117,055(0.08%)#193 |
| 46. | Santa Clarita | 93 | 20,614(0.45%)#46 | 117,055(0.08%)#201 |
| 47. | Oceanside | 93 | 20,614(0.45%)#47 | 117,055(0.08%)#202 |
| 48. | Redondo Beach | 93 | 20,614(0.45%)#48 | 117,055(0.08%)#205 |
| 49. | Fremont | 92 | 20,614(0.45%)#49 | 117,055(0.08%)#206 |
| 50. | San Rafael | 91 | 20,614(0.44%)#50 | 117,055(0.08%)#209 |
| 51. | San Ramon | 88 | 20,614(0.43%)#51 | 117,055(0.08%)#220 |
| 52. | Redwood City | 87 | 20,614(0.42%)#52 | 117,055(0.07%)#222 |
| 53. | Lomita | 87 | 20,614(0.42%)#53 | 117,055(0.07%)#223 |
| 54. | Carmichael | 85 | 20,614(0.41%)#54 | 117,055(0.07%)#225 |
| 55. | Los Altos | 83 | 20,614(0.40%)#55 | 117,055(0.07%)#237 |
| 56. | Alameda | 82 | 20,614(0.40%)#56 | 117,055(0.07%)#242 |
| 57. | Templeton | 81 | 20,614(0.39%)#57 | 117,055(0.07%)#253 |
| 58. | Santa Ana | 80 | 20,614(0.39%)#58 | 117,055(0.07%)#254 |
| 59. | Moraga | 79 | 20,614(0.38%)#59 | 117,055(0.07%)#262 |
| 60. | Granite Bay | 77 | 20,614(0.37%)#60 | 117,055(0.07%)#271 |
| 61. | Davis | 76 | 20,614(0.37%)#61 | 117,055(0.06%)#272 |
| 62. | Cupertino | 75 | 20,614(0.36%)#62 | 117,055(0.06%)#278 |
| 63. | Oak Park | 74 | 20,614(0.36%)#63 | 117,055(0.06%)#284 |
| 64. | Encinitas | 73 | 20,614(0.35%)#64 | 117,055(0.06%)#288 |
| 65. | Santa Rosa | 72 | 20,614(0.35%)#65 | 117,055(0.06%)#289 |
| 66. | Torrance | 72 | 20,614(0.35%)#66 | 117,055(0.06%)#290 |
| 67. | Glendale | 71 | 20,614(0.34%)#67 | 117,055(0.06%)#297 |
| 68. | West Hollywood | 70 | 20,614(0.34%)#68 | 117,055(0.06%)#299 |
| 69. | Manhattan Beach | 68 | 20,614(0.33%)#69 | 117,055(0.06%)#306 |
| 70. | Sunnyvale | 67 | 20,614(0.33%)#70 | 117,055(0.06%)#310 |
| 71. | Gilroy | 67 | 20,614(0.33%)#71 | 117,055(0.06%)#314 |
| 72. | Saratoga | 67 | 20,614(0.33%)#72 | 117,055(0.06%)#317 |
| 73. | San Clemente | 66 | 20,614(0.32%)#73 | 117,055(0.06%)#320 |
| 74. | Lafayette | 66 | 20,614(0.32%)#74 | 117,055(0.06%)#324 |
| 75. | Laguna Woods | 64 | 20,614(0.31%)#75 | 117,055(0.05%)#335 |
| 76. | Concord | 63 | 20,614(0.31%)#76 | 117,055(0.05%)#339 |
| 77. | Malibu | 63 | 20,614(0.31%)#77 | 117,055(0.05%)#343 |
| 78. | Elk Grove | 62 | 20,614(0.30%)#78 | 117,055(0.05%)#347 |
| 79. | Riverside | 61 | 20,614(0.30%)#79 | 117,055(0.05%)#361 |
| 80. | Santa Clara | 59 | 20,614(0.29%)#80 | 117,055(0.05%)#371 |
| 81. | Mill Valley | 59 | 20,614(0.29%)#81 | 117,055(0.05%)#374 |
| 82. | Lemoore Station | 59 | 20,614(0.29%)#82 | 117,055(0.05%)#376 |
| 83. | Daly City | 58 | 20,614(0.28%)#83 | 117,055(0.05%)#378 |
| 84. | Upland | 58 | 20,614(0.28%)#84 | 117,055(0.05%)#380 |
| 85. | El Paso De Robles Paso Robles | 58 | 20,614(0.28%)#85 | 117,055(0.05%)#383 |
| 86. | Fairfield | 57 | 20,614(0.28%)#86 | 117,055(0.05%)#388 |
| 87. | Bear Valley Springs | 57 | 20,614(0.28%)#87 | 117,055(0.05%)#394 |
| 88. | Larkspur | 55 | 20,614(0.27%)#88 | 117,055(0.05%)#404 |
| 89. | Dublin | 53 | 20,614(0.26%)#89 | 117,055(0.05%)#415 |
| 90. | Eastvale | 52 | 20,614(0.25%)#90 | 117,055(0.04%)#421 |
| 91. | Monterey Park | 51 | 20,614(0.25%)#91 | 117,055(0.04%)#433 |
| 92. | West Sacramento | 51 | 20,614(0.25%)#92 | 117,055(0.04%)#434 |
| 93. | Fair Oaks | 51 | 20,614(0.25%)#93 | 117,055(0.04%)#436 |
| 94. | Gold River | 49 | 20,614(0.24%)#94 | 117,055(0.04%)#458 |
| 95. | Hanford | 48 | 20,614(0.23%)#95 | 117,055(0.04%)#465 |
| 96. | Rancho Mission Viejo | 48 | 20,614(0.23%)#96 | 117,055(0.04%)#468 |
| 97. | Folsom | 46 | 20,614(0.22%)#97 | 117,055(0.04%)#478 |
| 98. | Azusa | 46 | 20,614(0.22%)#98 | 117,055(0.04%)#481 |
| 99. | Dana Point | 46 | 20,614(0.22%)#99 | 117,055(0.04%)#482 |
| 100. | Temescal Valley | 46 | 20,614(0.22%)#100 | 117,055(0.04%)#484 |
Common Questions
What are the Top 10 Cities with the Most Immigrants from South Africa in California?
Top 10 Cities with the Most Immigrants from South Africa in California are:
#1
3,232
#2
1,810
#3
784
#4
582
#5
309
#6
297
#7
293
#8
288
#9
268
#10
263
What city has the Most Immigrants from South Africa in California?
Los Angeles has the Most Immigrants from South Africa in California with 3,232.
What is the Total Immigrants from South Africa in the State of California?
Total Immigrants from South Africa in California is 20,614.
What is the Total Immigrants from South Africa in the United States?
Total Immigrants from South Africa in the United States is 117,055.