Cities with the Highest Percentage of Population Employed in Installation, Maintenance & Repair in Vermont
RELATED REPORTS & OPTIONS
Installation, Maintenance & Repair
Vermont
Compare Cities
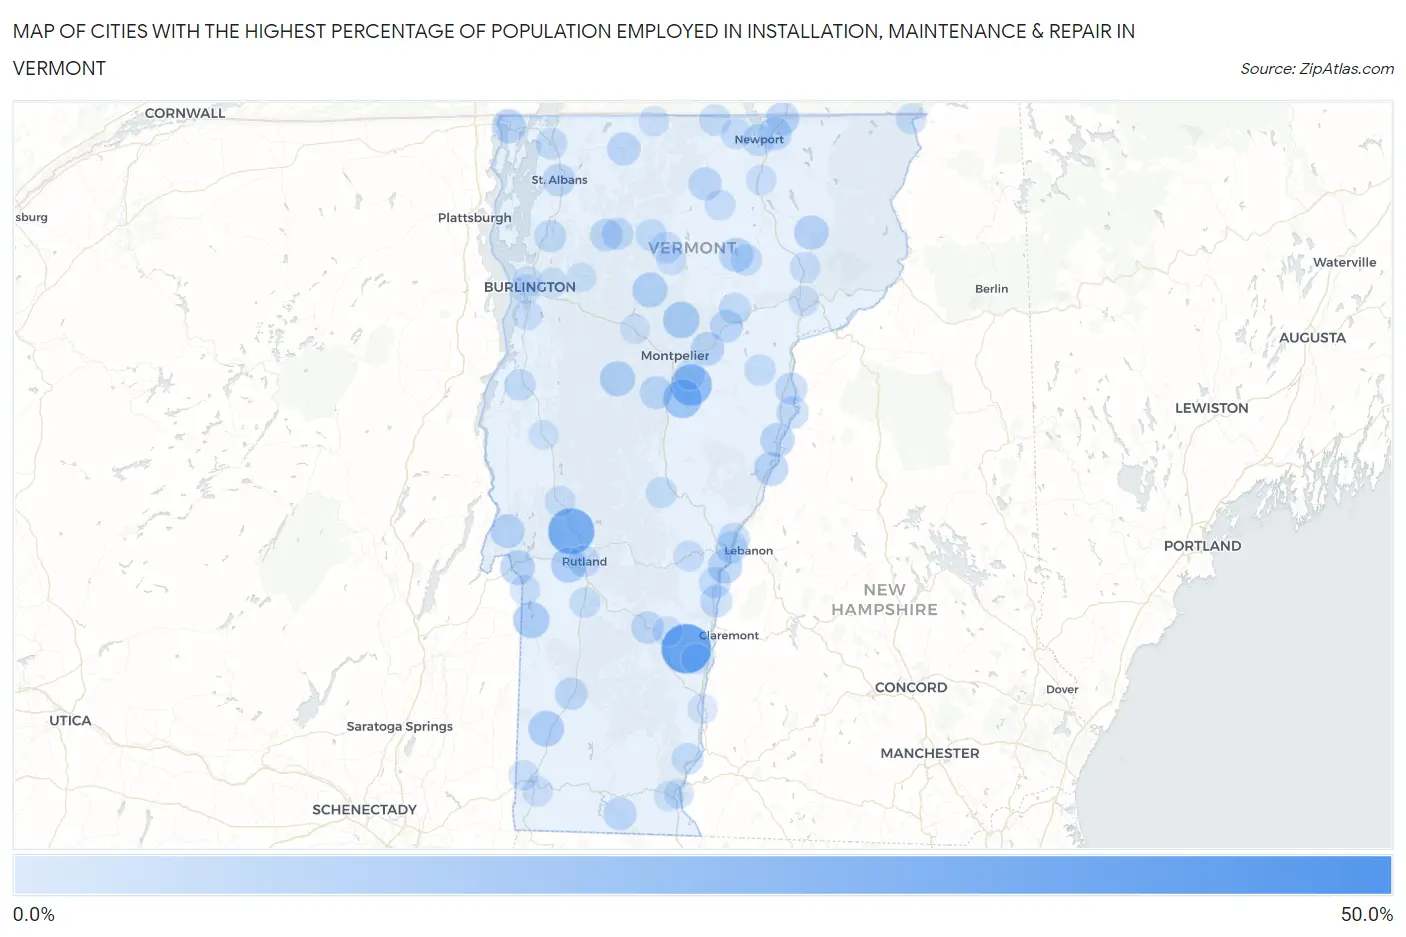
Map of Cities with the Highest Percentage of Population Employed in Installation, Maintenance & Repair in Vermont
0.0%
50.0%
Cities with the Highest Percentage of Population Employed in Installation, Maintenance & Repair in Vermont
| City | % Employed | vs State | vs National | |
| 1. | West Pawlet | 41.6% | 3.2%(+38.4)#1 | 3.1%(+38.5)#132 |
| 2. | East Charlotte | 32.5% | 3.2%(+29.3)#2 | 3.1%(+29.5)#245 |
| 3. | North Springfield | 31.9% | 3.2%(+28.7)#3 | 3.1%(+28.8)#251 |
| 4. | Pittsford | 26.4% | 3.2%(+23.3)#4 | 3.1%(+23.4)#367 |
| 5. | Sutton | 22.6% | 3.2%(+19.4)#5 | 3.1%(+19.5)#519 |
| 6. | North Hyde Park | 20.2% | 3.2%(+17.1)#6 | 3.1%(+17.2)#660 |
| 7. | South Barre | 18.3% | 3.2%(+15.1)#7 | 3.1%(+15.2)#785 |
| 8. | Highgate Center | 16.3% | 3.2%(+13.1)#8 | 3.1%(+13.2)#989 |
| 9. | Williamstown | 14.0% | 3.2%(+10.8)#9 | 3.1%(+10.9)#1,341 |
| 10. | Sheffield | 13.5% | 3.2%(+10.4)#10 | 3.1%(+10.5)#1,429 |
| 11. | Middletown Springs | 13.2% | 3.2%(+9.98)#11 | 3.1%(+10.1)#1,525 |
| 12. | Algiers | 12.1% | 3.2%(+8.88)#12 | 3.1%(+8.99)#1,809 |
| 13. | Worcester | 10.8% | 3.2%(+7.63)#13 | 3.1%(+7.74)#2,217 |
| 14. | Wells | 10.3% | 3.2%(+7.09)#14 | 3.1%(+7.20)#2,436 |
| 15. | Arlington | 9.5% | 3.2%(+6.33)#15 | 3.1%(+6.44)#2,836 |
| 16. | West Rutland | 8.8% | 3.2%(+5.65)#16 | 3.1%(+5.76)#3,235 |
| 17. | Whitingham | 8.7% | 3.2%(+5.52)#17 | 3.1%(+5.63)#3,362 |
| 18. | Lunenburg | 8.7% | 3.2%(+5.48)#18 | 3.1%(+5.59)#3,380 |
| 19. | Waitsfield | 8.6% | 3.2%(+5.44)#19 | 3.1%(+5.55)#3,403 |
| 20. | Stowe | 8.5% | 3.2%(+5.29)#20 | 3.1%(+5.40)#3,531 |
| 21. | Fair Haven | 7.7% | 3.2%(+4.55)#21 | 3.1%(+4.66)#4,162 |
| 22. | South Lincoln | 7.5% | 3.2%(+4.30)#22 | 3.1%(+4.41)#4,462 |
| 23. | West Burke | 7.4% | 3.2%(+4.18)#23 | 3.1%(+4.29)#4,573 |
| 24. | North Hartland | 7.3% | 3.2%(+4.15)#24 | 3.1%(+4.26)#4,606 |
| 25. | Greensboro | 7.1% | 3.2%(+3.97)#25 | 3.1%(+4.08)#4,832 |
| 26. | Bradford | 7.1% | 3.2%(+3.96)#26 | 3.1%(+4.07)#4,848 |
| 27. | Fairlee | 6.9% | 3.2%(+3.72)#27 | 3.1%(+3.83)#5,111 |
| 28. | Alburgh | 6.9% | 3.2%(+3.70)#28 | 3.1%(+3.81)#5,129 |
| 29. | Benson | 6.8% | 3.2%(+3.64)#29 | 3.1%(+3.75)#5,231 |
| 30. | St. George | 6.7% | 3.2%(+3.52)#30 | 3.1%(+3.63)#5,392 |
| 31. | Underhill Flats | 6.5% | 3.2%(+3.27)#31 | 3.1%(+3.38)#5,760 |
| 32. | Plainfield | 6.3% | 3.2%(+3.17)#32 | 3.1%(+3.28)#5,899 |
| 33. | Stamford | 5.9% | 3.2%(+2.75)#33 | 3.1%(+2.86)#6,560 |
| 34. | Derby Line | 5.8% | 3.2%(+2.66)#34 | 3.1%(+2.77)#6,739 |
| 35. | Derby Center | 5.7% | 3.2%(+2.54)#35 | 3.1%(+2.65)#6,957 |
| 36. | Enosburg Falls | 5.7% | 3.2%(+2.51)#36 | 3.1%(+2.62)#7,023 |
| 37. | Northfield | 5.6% | 3.2%(+2.46)#37 | 3.1%(+2.57)#7,129 |
| 38. | Jacksonville | 5.4% | 3.2%(+2.20)#38 | 3.1%(+2.31)#7,651 |
| 39. | Lowell | 5.4% | 3.2%(+2.20)#39 | 3.1%(+2.31)#7,653 |
| 40. | New Haven | 5.3% | 3.2%(+2.17)#40 | 3.1%(+2.28)#7,721 |
| 41. | Killington | 5.3% | 3.2%(+2.15)#41 | 3.1%(+2.26)#7,752 |
| 42. | Marshfield | 4.9% | 3.2%(+1.69)#42 | 3.1%(+1.80)#8,796 |
| 43. | Hartford | 4.9% | 3.2%(+1.67)#43 | 3.1%(+1.78)#8,831 |
| 44. | Ludlow | 4.7% | 3.2%(+1.52)#44 | 3.1%(+1.63)#9,197 |
| 45. | St Albans | 4.5% | 3.2%(+1.32)#45 | 3.1%(+1.43)#9,752 |
| 46. | Cambridge | 4.4% | 3.2%(+1.27)#46 | 3.1%(+1.38)#9,906 |
| 47. | Manchester Center | 4.4% | 3.2%(+1.25)#47 | 3.1%(+1.36)#9,937 |
| 48. | Newbury | 4.3% | 3.2%(+1.15)#48 | 3.1%(+1.26)#10,239 |
| 49. | Wells River | 4.2% | 3.2%(+1.06)#49 | 3.1%(+1.17)#10,486 |
| 50. | Milton | 4.2% | 3.2%(+0.982)#50 | 3.1%(+1.09)#10,712 |
| 51. | Newport | 4.1% | 3.2%(+0.896)#51 | 3.1%(+1.01)#10,974 |
| 52. | Jeffersonville | 4.0% | 3.2%(+0.776)#52 | 3.1%(+0.886)#11,318 |
| 53. | Windsor | 3.9% | 3.2%(+0.718)#53 | 3.1%(+0.829)#11,512 |
| 54. | White River Junction | 3.9% | 3.2%(+0.688)#54 | 3.1%(+0.798)#11,619 |
| 55. | Cabot | 3.7% | 3.2%(+0.492)#55 | 3.1%(+0.602)#12,303 |
| 56. | East Dorset | 3.6% | 3.2%(+0.372)#56 | 3.1%(+0.483)#12,697 |
| 57. | Rutland | 3.4% | 3.2%(+0.271)#57 | 3.1%(+0.381)#13,024 |
| 58. | Wilder | 3.4% | 3.2%(+0.258)#58 | 3.1%(+0.369)#13,094 |
| 59. | Swanton | 3.4% | 3.2%(+0.257)#59 | 3.1%(+0.368)#13,096 |
| 60. | Hartland | 3.4% | 3.2%(+0.231)#60 | 3.1%(+0.342)#13,188 |
| 61. | South Hero | 3.3% | 3.2%(+0.119)#61 | 3.1%(+0.229)#13,627 |
| 62. | Hyde Park | 3.3% | 3.2%(+0.109)#62 | 3.1%(+0.219)#13,660 |
| 63. | Vergennes | 3.3% | 3.2%(+0.086)#63 | 3.1%(+0.196)#13,740 |
| 64. | Putney | 3.1% | 3.2%(-0.028)#64 | 3.1%(+0.082)#14,172 |
| 65. | Danby | 3.0% | 3.2%(-0.148)#65 | 3.1%(-0.037)#14,624 |
| 66. | North Troy | 3.0% | 3.2%(-0.193)#66 | 3.1%(-0.083)#14,787 |
| 67. | Johnson | 3.0% | 3.2%(-0.195)#67 | 3.1%(-0.085)#14,812 |
| 68. | Pownal Center | 2.9% | 3.2%(-0.256)#68 | 3.1%(-0.146)#15,059 |
| 69. | Greensboro Bend | 2.9% | 3.2%(-0.300)#69 | 3.1%(-0.190)#15,218 |
| 70. | Groton | 2.8% | 3.2%(-0.389)#70 | 3.1%(-0.279)#15,569 |
| 71. | Bethel | 2.8% | 3.2%(-0.423)#71 | 3.1%(-0.313)#15,702 |
| 72. | Huntington | 2.4% | 3.2%(-0.739)#72 | 3.1%(-0.629)#17,023 |
| 73. | Lyndonville | 2.3% | 3.2%(-0.888)#73 | 3.1%(-0.778)#17,674 |
| 74. | Newport Center | 2.2% | 3.2%(-1.00)#74 | 3.1%(-0.894)#18,115 |
| 75. | Canaan | 2.1% | 3.2%(-1.09)#75 | 3.1%(-0.984)#18,461 |
| 76. | Wallingford | 2.1% | 3.2%(-1.10)#76 | 3.1%(-0.990)#18,489 |
| 77. | Albany | 2.0% | 3.2%(-1.14)#77 | 3.1%(-1.03)#18,635 |
| 78. | Brandon | 2.0% | 3.2%(-1.14)#78 | 3.1%(-1.03)#18,671 |
| 79. | Woodstock | 2.0% | 3.2%(-1.19)#79 | 3.1%(-1.08)#18,832 |
| 80. | Springfield | 1.5% | 3.2%(-1.64)#80 | 3.1%(-1.53)#20,501 |
| 81. | Orleans | 1.5% | 3.2%(-1.71)#81 | 3.1%(-1.60)#20,751 |
| 82. | Bennington | 1.4% | 3.2%(-1.78)#82 | 3.1%(-1.67)#20,996 |
| 83. | Proctor | 1.4% | 3.2%(-1.80)#83 | 3.1%(-1.69)#21,084 |
| 84. | Barre | 1.3% | 3.2%(-1.84)#84 | 3.1%(-1.73)#21,220 |
| 85. | St Johnsbury | 1.2% | 3.2%(-1.99)#85 | 3.1%(-1.88)#21,662 |
| 86. | Richford | 1.2% | 3.2%(-2.01)#86 | 3.1%(-1.90)#21,747 |
| 87. | Burlington | 1.1% | 3.2%(-2.03)#87 | 3.1%(-1.92)#21,805 |
| 88. | Poultney | 1.1% | 3.2%(-2.10)#88 | 3.1%(-1.99)#22,029 |
| 89. | Morrisville | 1.1% | 3.2%(-2.11)#89 | 3.1%(-2.00)#22,056 |
| 90. | North Bennington | 1.0% | 3.2%(-2.15)#90 | 3.1%(-2.04)#22,149 |
| 91. | Shelburne | 1.0% | 3.2%(-2.15)#91 | 3.1%(-2.04)#22,155 |
| 92. | Cavendish | 1.0% | 3.2%(-2.17)#92 | 3.1%(-2.06)#22,210 |
| 93. | South Burlington | 0.93% | 3.2%(-2.24)#93 | 3.1%(-2.13)#22,421 |
| 94. | Essex Junction | 0.92% | 3.2%(-2.26)#94 | 3.1%(-2.15)#22,472 |
| 95. | Bellows Falls | 0.87% | 3.2%(-2.31)#95 | 3.1%(-2.20)#22,600 |
| 96. | Waterbury | 0.81% | 3.2%(-2.36)#96 | 3.1%(-2.25)#22,791 |
| 97. | West Brattleboro | 0.76% | 3.2%(-2.42)#97 | 3.1%(-2.31)#22,926 |
| 98. | Middlebury | 0.75% | 3.2%(-2.43)#98 | 3.1%(-2.32)#22,955 |
| 99. | Jericho | 0.74% | 3.2%(-2.44)#99 | 3.1%(-2.33)#22,973 |
| 100. | Brattleboro | 0.68% | 3.2%(-2.49)#100 | 3.1%(-2.38)#23,112 |
1
2Common Questions
What are the Top 10 Cities with the Highest Percentage of Population Employed in Installation, Maintenance & Repair in Vermont?
Top 10 Cities with the Highest Percentage of Population Employed in Installation, Maintenance & Repair in Vermont are:
#1
31.9%
#2
26.4%
#3
18.3%
#4
14.0%
#5
10.8%
#6
10.3%
#7
9.5%
#8
8.8%
#9
8.6%
#10
8.5%
What city has the Highest Percentage of Population Employed in Installation, Maintenance & Repair in Vermont?
North Springfield has the Highest Percentage of Population Employed in Installation, Maintenance & Repair in Vermont with 31.9%.
What is the Percentage of Population Employed in Installation, Maintenance & Repair in the State of Vermont?
Percentage of Population Employed in Installation, Maintenance & Repair in Vermont is 3.2%.
What is the Percentage of Population Employed in Installation, Maintenance & Repair in the United States?
Percentage of Population Employed in Installation, Maintenance & Repair in the United States is 3.1%.