Cities with the Highest Poverty Level in California
RELATED REPORTS & OPTIONS
Highest Poverty
California
Compare Cities
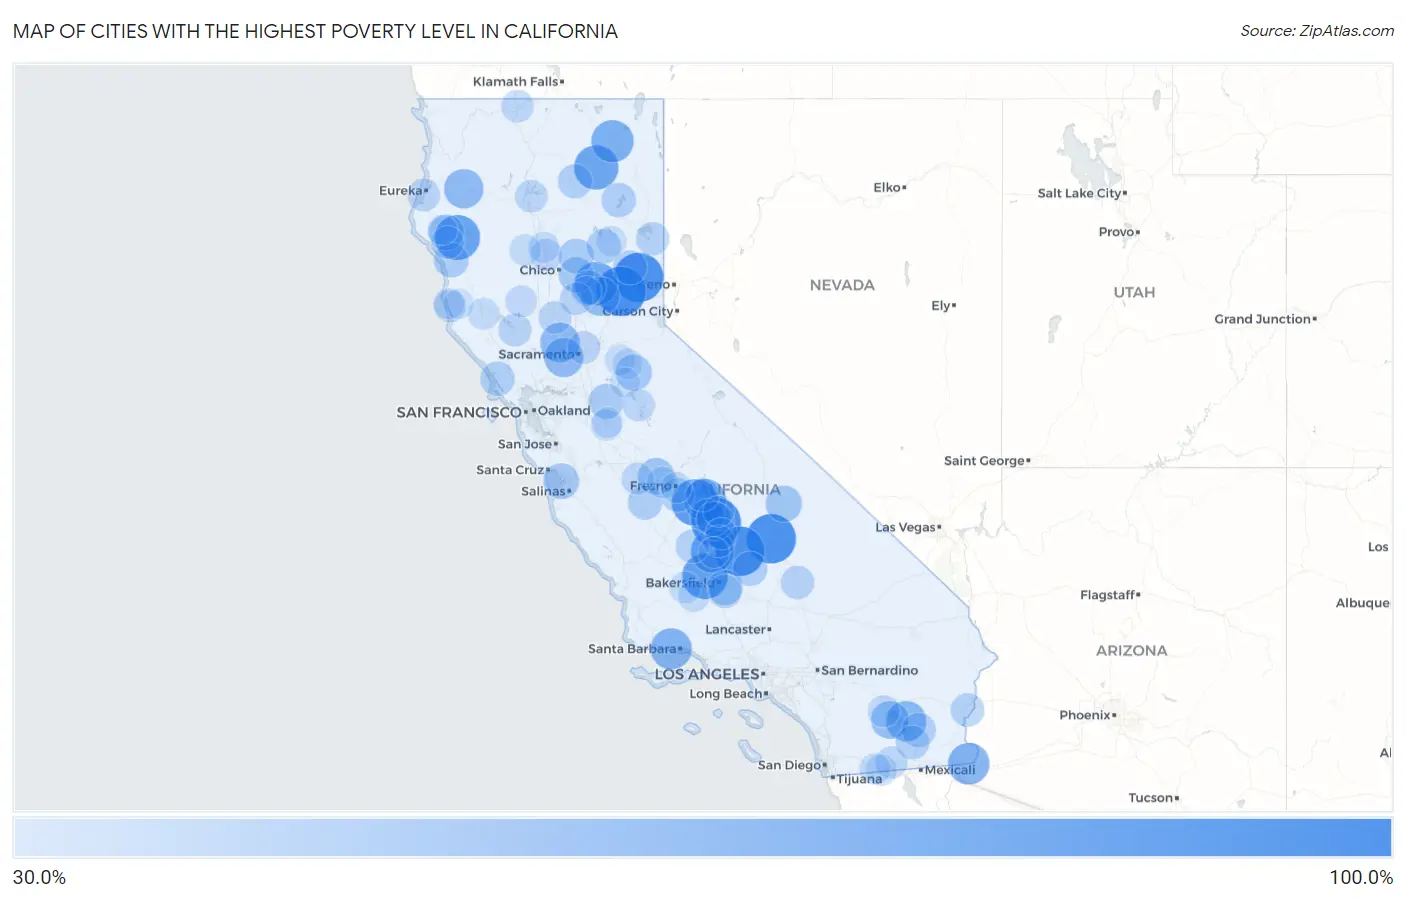
Map of Cities with the Highest Poverty Level in California
0.0%
100.0%
Cities with the Highest Poverty Level in California
| City | Poverty | vs State | vs National | |
| 1. | Kennedy Meadows | 100.0% | 12.1%(+87.9)#1 | 12.5%(+87.5)#28 |
| 2. | El Rancho | 100.0% | 12.1%(+87.9)#2 | 12.5%(+87.5)#40 |
| 3. | Sattley | 100.0% | 12.1%(+87.9)#3 | 12.5%(+87.5)#69 |
| 4. | Mcclenney Tract | 100.0% | 12.1%(+87.9)#4 | 12.5%(+87.5)#84 |
| 5. | Cold Springs Cdp Tuolumne County | 100.0% | 12.1%(+87.9)#5 | 12.5%(+87.5)#92 |
| 6. | Graniteville | 100.0% | 12.1%(+87.9)#6 | 12.5%(+87.5)#97 |
| 7. | Delft Colony | 90.4% | 12.1%(+78.2)#7 | 12.5%(+77.8)#149 |
| 8. | Cherokee Strip | 87.3% | 12.1%(+75.2)#8 | 12.5%(+74.7)#159 |
| 9. | Alderpoint | 85.7% | 12.1%(+73.6)#9 | 12.5%(+73.2)#167 |
| 10. | Nubieber | 83.3% | 12.1%(+71.2)#10 | 12.5%(+70.8)#176 |
| 11. | Clipper Mills | 80.3% | 12.1%(+68.1)#11 | 12.5%(+67.7)#195 |
| 12. | Rodriguez Camp | 78.8% | 12.1%(+66.7)#12 | 12.5%(+66.3)#209 |
| 13. | Canby | 76.5% | 12.1%(+64.3)#13 | 12.5%(+63.9)#229 |
| 14. | East Orosi | 76.3% | 12.1%(+64.2)#14 | 12.5%(+63.8)#231 |
| 15. | Strawberry Cdp Tuolumne County | 75.4% | 12.1%(+63.3)#15 | 12.5%(+62.9)#239 |
| 16. | Winterhaven | 73.6% | 12.1%(+61.5)#16 | 12.5%(+61.1)#261 |
| 17. | Isla Vista | 72.4% | 12.1%(+60.3)#17 | 12.5%(+59.9)#275 |
| 18. | Weitchpec | 70.9% | 12.1%(+58.8)#18 | 12.5%(+58.4)#303 |
| 19. | Bombay Beach | 69.4% | 12.1%(+57.3)#19 | 12.5%(+56.9)#326 |
| 20. | Yolo | 67.3% | 12.1%(+55.1)#20 | 12.5%(+54.7)#355 |
| 21. | Dales | 67.1% | 12.1%(+55.0)#21 | 12.5%(+54.6)#356 |
| 22. | Burnt Ranch | 66.7% | 12.1%(+54.5)#22 | 12.5%(+54.1)#365 |
| 23. | University Of California Davis | 66.0% | 12.1%(+53.9)#23 | 12.5%(+53.5)#375 |
| 24. | North San Juan | 65.1% | 12.1%(+53.0)#24 | 12.5%(+52.6)#394 |
| 25. | Tonyville | 62.4% | 12.1%(+50.3)#25 | 12.5%(+49.9)#452 |
| 26. | Salton Sea Beach | 62.0% | 12.1%(+49.8)#26 | 12.5%(+49.4)#465 |
| 27. | La Grange | 60.1% | 12.1%(+48.0)#27 | 12.5%(+47.6)#513 |
| 28. | Kep'el | 57.9% | 12.1%(+45.8)#28 | 12.5%(+45.4)#564 |
| 29. | Keeler | 57.1% | 12.1%(+45.0)#29 | 12.5%(+44.6)#588 |
| 30. | La Vina | 57.1% | 12.1%(+45.0)#30 | 12.5%(+44.6)#591 |
| 31. | Rail Road Flat | 56.4% | 12.1%(+44.3)#31 | 12.5%(+43.9)#610 |
| 32. | Moss Landing | 55.6% | 12.1%(+43.4)#32 | 12.5%(+43.0)#638 |
| 33. | Miranda | 54.7% | 12.1%(+42.6)#33 | 12.5%(+42.2)#675 |
| 34. | Cherokee | 53.7% | 12.1%(+41.5)#34 | 12.5%(+41.1)#722 |
| 35. | Fuller Acres | 53.3% | 12.1%(+41.2)#35 | 12.5%(+40.7)#741 |
| 36. | Farmington | 53.2% | 12.1%(+41.0)#36 | 12.5%(+40.6)#745 |
| 37. | Wautec | 52.9% | 12.1%(+40.8)#37 | 12.5%(+40.4)#755 |
| 38. | Stirling City | 52.8% | 12.1%(+40.6)#38 | 12.5%(+40.2)#761 |
| 39. | Leggett | 52.2% | 12.1%(+40.0)#39 | 12.5%(+39.6)#786 |
| 40. | Oak Run | 51.6% | 12.1%(+39.5)#40 | 12.5%(+39.1)#820 |
| 41. | Robinson Mill | 51.4% | 12.1%(+39.2)#41 | 12.5%(+38.8)#832 |
| 42. | Linnell Camp | 51.3% | 12.1%(+39.2)#42 | 12.5%(+38.8)#838 |
| 43. | Bodfish | 51.2% | 12.1%(+39.0)#43 | 12.5%(+38.6)#842 |
| 44. | Tomales | 51.1% | 12.1%(+39.0)#44 | 12.5%(+38.6)#845 |
| 45. | Twain | 51.1% | 12.1%(+39.0)#45 | 12.5%(+38.6)#846 |
| 46. | Tooleville | 51.0% | 12.1%(+38.9)#46 | 12.5%(+38.4)#855 |
| 47. | Spaulding | 50.6% | 12.1%(+38.5)#47 | 12.5%(+38.1)#874 |
| 48. | Cantua Creek | 50.6% | 12.1%(+38.5)#48 | 12.5%(+38.0)#879 |
| 49. | Cassel | 50.4% | 12.1%(+38.3)#49 | 12.5%(+37.9)#885 |
| 50. | Niland | 50.3% | 12.1%(+38.2)#50 | 12.5%(+37.8)#892 |
| 51. | Clio | 49.7% | 12.1%(+37.5)#51 | 12.5%(+37.1)#929 |
| 52. | Westmorland | 48.6% | 12.1%(+36.5)#52 | 12.5%(+36.1)#990 |
| 53. | Ripley | 48.6% | 12.1%(+36.5)#53 | 12.5%(+36.1)#994 |
| 54. | Alpaugh | 48.5% | 12.1%(+36.4)#54 | 12.5%(+36.0)#998 |
| 55. | Bowles | 48.5% | 12.1%(+36.4)#55 | 12.5%(+36.0)#999 |
| 56. | Weedpatch | 48.0% | 12.1%(+35.9)#56 | 12.5%(+35.5)#1,027 |
| 57. | Platina | 48.0% | 12.1%(+35.9)#57 | 12.5%(+35.5)#1,030 |
| 58. | Johannesburg | 47.9% | 12.1%(+35.7)#58 | 12.5%(+35.3)#1,034 |
| 59. | Patton Village | 47.6% | 12.1%(+35.5)#59 | 12.5%(+35.1)#1,052 |
| 60. | Lower Lake | 46.5% | 12.1%(+34.4)#60 | 12.5%(+34.0)#1,140 |
| 61. | Orange Cove | 46.5% | 12.1%(+34.4)#61 | 12.5%(+34.0)#1,142 |
| 62. | Honcut | 45.7% | 12.1%(+33.6)#62 | 12.5%(+33.2)#1,203 |
| 63. | Mcclellan Park | 45.7% | 12.1%(+33.6)#63 | 12.5%(+33.1)#1,205 |
| 64. | Grimes | 45.6% | 12.1%(+33.5)#64 | 12.5%(+33.1)#1,207 |
| 65. | East Bakersfield | 45.6% | 12.1%(+33.5)#65 | 12.5%(+33.1)#1,208 |
| 66. | Garberville | 45.5% | 12.1%(+33.4)#66 | 12.5%(+32.9)#1,213 |
| 67. | Fields Landing | 45.5% | 12.1%(+33.3)#67 | 12.5%(+32.9)#1,215 |
| 68. | Mountain Gate | 45.2% | 12.1%(+33.1)#68 | 12.5%(+32.6)#1,240 |
| 69. | Hornbrook | 45.1% | 12.1%(+33.0)#69 | 12.5%(+32.6)#1,242 |
| 70. | Chinese Camp | 44.4% | 12.1%(+32.3)#70 | 12.5%(+31.9)#1,290 |
| 71. | Vina | 44.1% | 12.1%(+31.9)#71 | 12.5%(+31.5)#1,319 |
| 72. | Ocotillo | 43.8% | 12.1%(+31.7)#72 | 12.5%(+31.3)#1,338 |
| 73. | Albion | 43.5% | 12.1%(+31.4)#73 | 12.5%(+30.9)#1,369 |
| 74. | Terra Bella | 43.4% | 12.1%(+31.3)#74 | 12.5%(+30.9)#1,377 |
| 75. | Firebaugh | 43.3% | 12.1%(+31.1)#75 | 12.5%(+30.7)#1,390 |
| 76. | Oasis | 43.0% | 12.1%(+30.9)#76 | 12.5%(+30.5)#1,420 |
| 77. | Edison | 42.9% | 12.1%(+30.7)#77 | 12.5%(+30.3)#1,430 |
| 78. | Lodoga | 42.3% | 12.1%(+30.2)#78 | 12.5%(+29.8)#1,481 |
| 79. | Mckittrick | 41.9% | 12.1%(+29.8)#79 | 12.5%(+29.4)#1,505 |
| 80. | Talmage | 41.8% | 12.1%(+29.7)#80 | 12.5%(+29.3)#1,521 |
| 81. | Biola | 41.8% | 12.1%(+29.7)#81 | 12.5%(+29.3)#1,525 |
| 82. | East Porterville | 41.8% | 12.1%(+29.6)#82 | 12.5%(+29.2)#1,535 |
| 83. | Ford City | 41.6% | 12.1%(+29.5)#83 | 12.5%(+29.1)#1,553 |
| 84. | Rancho Tehama Reserve | 41.6% | 12.1%(+29.5)#84 | 12.5%(+29.1)#1,557 |
| 85. | Jacumba | 41.4% | 12.1%(+29.3)#85 | 12.5%(+28.9)#1,569 |
| 86. | Bret Harte | 40.9% | 12.1%(+28.8)#86 | 12.5%(+28.4)#1,603 |
| 87. | Los Molinos | 40.8% | 12.1%(+28.7)#87 | 12.5%(+28.3)#1,607 |
| 88. | Boulevard | 40.7% | 12.1%(+28.5)#88 | 12.5%(+28.1)#1,616 |
| 89. | Calwa | 40.2% | 12.1%(+28.1)#89 | 12.5%(+27.7)#1,658 |
| 90. | Little River | 39.9% | 12.1%(+27.8)#90 | 12.5%(+27.4)#1,700 |
| 91. | Richgrove | 39.6% | 12.1%(+27.5)#91 | 12.5%(+27.1)#1,731 |
| 92. | Lemon Cove | 39.6% | 12.1%(+27.4)#92 | 12.5%(+27.0)#1,737 |
| 93. | Crescent Mills | 39.4% | 12.1%(+27.3)#93 | 12.5%(+26.9)#1,755 |
| 94. | Fiddletown | 39.3% | 12.1%(+27.2)#94 | 12.5%(+26.8)#1,765 |
| 95. | Airport | 39.0% | 12.1%(+26.9)#95 | 12.5%(+26.5)#1,789 |
| 96. | Volcano | 39.0% | 12.1%(+26.9)#96 | 12.5%(+26.4)#1,791 |
| 97. | Rackerby | 37.8% | 12.1%(+25.7)#97 | 12.5%(+25.3)#1,934 |
| 98. | Myers Flat | 37.5% | 12.1%(+25.4)#98 | 12.5%(+25.0)#1,975 |
| 99. | Comptche | 37.5% | 12.1%(+25.4)#99 | 12.5%(+25.0)#1,978 |
| 100. | San Andreas | 37.5% | 12.1%(+25.3)#100 | 12.5%(+24.9)#1,985 |
Common Questions
What are the Top 10 Cities with the Highest Poverty Level in California?
Top 10 Cities with the Highest Poverty Level in California are:
#1
100.0%
#2
100.0%
#3
100.0%
#4
100.0%
#5
100.0%
#6
90.4%
#7
87.3%
#8
85.7%
#9
83.3%
#10
80.3%
What city has the Highest Poverty Level in California?
Kennedy Meadows has the Highest Poverty Level in California with 100.0%.
What is the Poverty Level in the State of California?
Poverty Level in California is 12.1%.
What is the Poverty Level in the United States?
Poverty Level in the United States is 12.5%.