Cities with the Highest Percentage of Population Employed in Food Preparation & Serving in California
RELATED REPORTS & OPTIONS
Food Preparation & Serving
California
Compare Cities
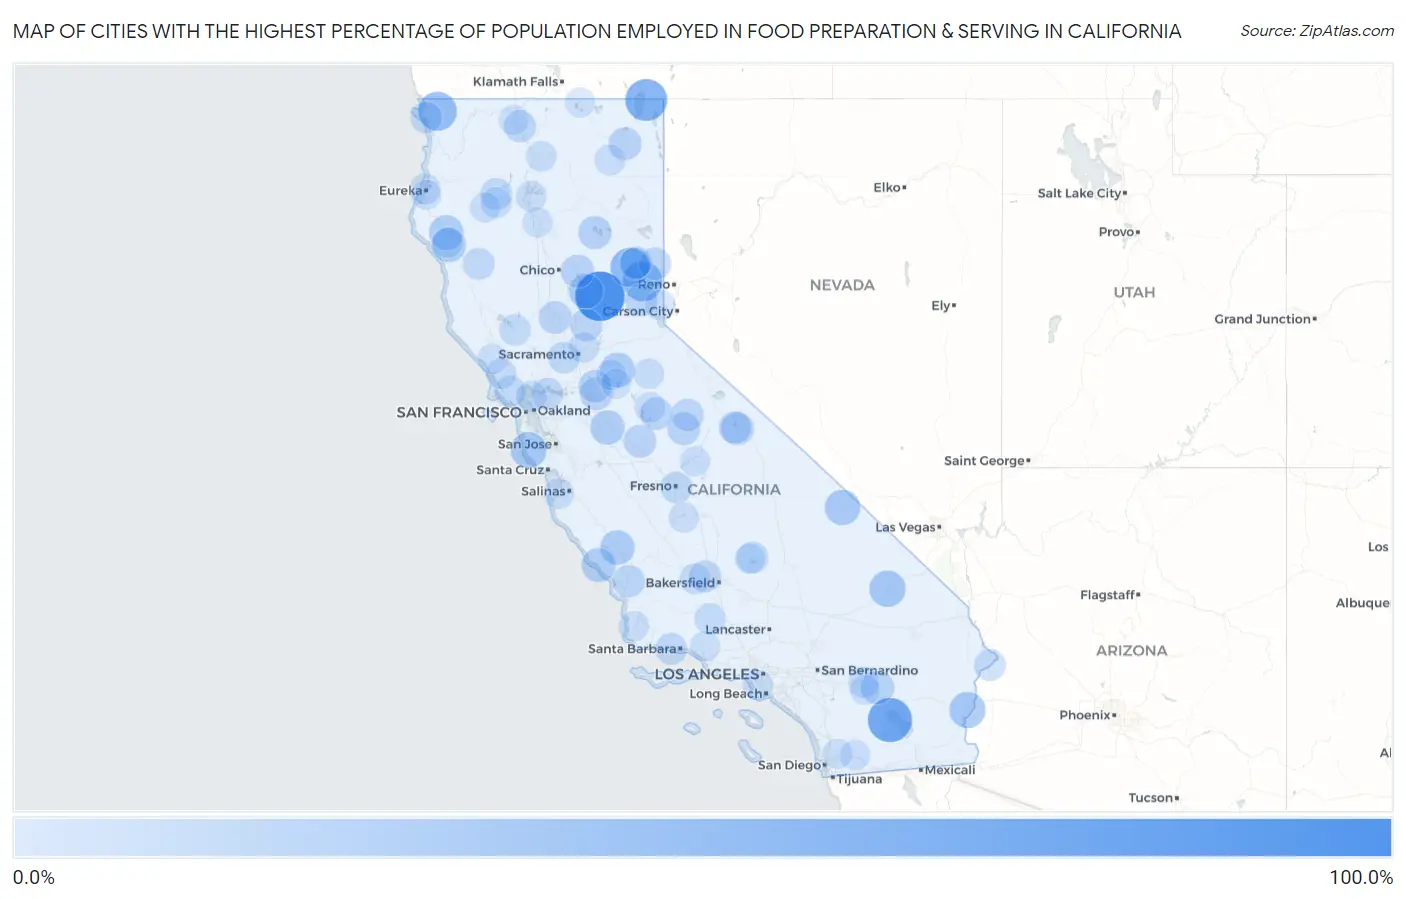
Map of Cities with the Highest Percentage of Population Employed in Food Preparation & Serving in California
0.0%
100.0%
Cities with the Highest Percentage of Population Employed in Food Preparation & Serving in California
| City | % Employed | vs State | vs National | |
| 1. | El Monte Mobile | 100.0% | 5.4%(+94.6)#1 | 5.3%(+94.7)#6 |
| 2. | North San Juan | 100.0% | 5.4%(+94.6)#2 | 5.3%(+94.7)#7 |
| 3. | Fort Hunter Liggett | 89.2% | 5.4%(+83.8)#3 | 5.3%(+83.9)#36 |
| 4. | Salton Sea Beach | 75.5% | 5.4%(+70.1)#4 | 5.3%(+70.2)#47 |
| 5. | Salyer | 67.5% | 5.4%(+62.1)#5 | 5.3%(+62.2)#57 |
| 6. | New Pine Creek | 64.7% | 5.4%(+59.3)#6 | 5.3%(+59.4)#60 |
| 7. | Sierraville | 55.0% | 5.4%(+49.6)#7 | 5.3%(+49.7)#87 |
| 8. | Clio | 52.8% | 5.4%(+47.4)#8 | 5.3%(+47.5)#100 |
| 9. | Gasquet | 50.0% | 5.4%(+44.6)#9 | 5.3%(+44.7)#106 |
| 10. | Baker | 39.0% | 5.4%(+33.7)#10 | 5.3%(+33.8)#197 |
| 11. | Ripley | 38.1% | 5.4%(+32.8)#11 | 5.3%(+32.8)#207 |
| 12. | Pescadero | 37.6% | 5.4%(+32.2)#12 | 5.3%(+32.3)#211 |
| 13. | Furnace Creek | 35.3% | 5.4%(+30.0)#13 | 5.3%(+30.1)#246 |
| 14. | Martell | 33.3% | 5.4%(+28.0)#14 | 5.3%(+28.0)#271 |
| 15. | Bradley | 32.1% | 5.4%(+26.8)#15 | 5.3%(+26.9)#293 |
| 16. | Miranda | 31.7% | 5.4%(+26.3)#16 | 5.3%(+26.4)#301 |
| 17. | El Centro Naval Air Facility | 31.6% | 5.4%(+26.2)#17 | 5.3%(+26.3)#303 |
| 18. | Cowan | 31.5% | 5.4%(+26.1)#18 | 5.3%(+26.2)#307 |
| 19. | Benbow | 31.3% | 5.4%(+26.0)#19 | 5.3%(+26.1)#311 |
| 20. | Hypericum | 31.3% | 5.4%(+25.9)#20 | 5.3%(+26.0)#312 |
| 21. | Rackerby | 31.0% | 5.4%(+25.7)#21 | 5.3%(+25.7)#317 |
| 22. | San Simeon | 29.9% | 5.4%(+24.5)#22 | 5.3%(+24.6)#349 |
| 23. | Lake Almanor West | 26.3% | 5.4%(+20.9)#23 | 5.3%(+21.0)#455 |
| 24. | Indio Hills | 26.3% | 5.4%(+20.9)#24 | 5.3%(+21.0)#460 |
| 25. | California Polytechnic State University | 26.0% | 5.4%(+20.6)#25 | 5.3%(+20.7)#473 |
| 26. | Yankee Hill | 25.9% | 5.4%(+20.5)#26 | 5.3%(+20.6)#477 |
| 27. | Aspen Springs | 24.8% | 5.4%(+19.4)#27 | 5.3%(+19.5)#515 |
| 28. | California Pines | 24.6% | 5.4%(+19.2)#28 | 5.3%(+19.3)#521 |
| 29. | Waterloo | 24.6% | 5.4%(+19.2)#29 | 5.3%(+19.3)#523 |
| 30. | Wawona | 24.1% | 5.4%(+18.7)#30 | 5.3%(+18.8)#545 |
| 31. | University Of California Merced | 24.1% | 5.4%(+18.7)#31 | 5.3%(+18.8)#546 |
| 32. | Victor | 23.6% | 5.4%(+18.2)#32 | 5.3%(+18.3)#572 |
| 33. | Grimes | 23.6% | 5.4%(+18.2)#33 | 5.3%(+18.3)#576 |
| 34. | Yosemite Valley | 23.3% | 5.4%(+17.9)#34 | 5.3%(+18.0)#596 |
| 35. | Greeley Hill | 23.1% | 5.4%(+17.7)#35 | 5.3%(+17.8)#605 |
| 36. | Sheridan | 23.0% | 5.4%(+17.6)#36 | 5.3%(+17.7)#619 |
| 37. | Santa Margarita | 22.8% | 5.4%(+17.4)#37 | 5.3%(+17.5)#628 |
| 38. | Chilcoot Vinton | 22.4% | 5.4%(+17.0)#38 | 5.3%(+17.1)#648 |
| 39. | Crowley Lake | 22.3% | 5.4%(+17.0)#39 | 5.3%(+17.1)#649 |
| 40. | Soda Springs | 22.2% | 5.4%(+16.8)#40 | 5.3%(+16.9)#669 |
| 41. | Grenada | 21.7% | 5.4%(+16.4)#41 | 5.3%(+16.5)#693 |
| 42. | Portola | 21.5% | 5.4%(+16.1)#42 | 5.3%(+16.2)#709 |
| 43. | Yermo | 21.4% | 5.4%(+16.0)#43 | 5.3%(+16.1)#711 |
| 44. | Mexican Colony | 20.8% | 5.4%(+15.4)#44 | 5.3%(+15.5)#754 |
| 45. | Delleker | 20.3% | 5.4%(+14.9)#45 | 5.3%(+15.0)#803 |
| 46. | Covelo | 20.2% | 5.4%(+14.8)#46 | 5.3%(+14.9)#817 |
| 47. | Weaverville | 20.1% | 5.4%(+14.8)#47 | 5.3%(+14.9)#824 |
| 48. | Isla Vista | 20.1% | 5.4%(+14.7)#48 | 5.3%(+14.8)#825 |
| 49. | Kernville | 19.7% | 5.4%(+14.3)#49 | 5.3%(+14.4)#877 |
| 50. | Calwa | 19.5% | 5.4%(+14.1)#50 | 5.3%(+14.2)#898 |
| 51. | Clyde | 19.4% | 5.4%(+14.0)#51 | 5.3%(+14.1)#906 |
| 52. | University Of California Davis | 19.2% | 5.4%(+13.8)#52 | 5.3%(+13.9)#924 |
| 53. | Bluewater | 19.0% | 5.4%(+13.7)#53 | 5.3%(+13.8)#938 |
| 54. | Bertsch Oceanview | 19.0% | 5.4%(+13.6)#54 | 5.3%(+13.7)#946 |
| 55. | Lower Lake | 18.9% | 5.4%(+13.5)#55 | 5.3%(+13.6)#960 |
| 56. | Knights Ferry | 18.2% | 5.4%(+12.8)#56 | 5.3%(+12.9)#1,044 |
| 57. | Nicasio | 18.0% | 5.4%(+12.6)#57 | 5.3%(+12.7)#1,067 |
| 58. | La Grange | 17.4% | 5.4%(+12.0)#58 | 5.3%(+12.1)#1,150 |
| 59. | Pine Mountain Club | 17.4% | 5.4%(+12.0)#59 | 5.3%(+12.1)#1,160 |
| 60. | Rumsey | 17.3% | 5.4%(+11.9)#60 | 5.3%(+12.0)#1,166 |
| 61. | Sonoma State University | 16.8% | 5.4%(+11.4)#61 | 5.3%(+11.5)#1,223 |
| 62. | Meyers | 16.4% | 5.4%(+11.0)#62 | 5.3%(+11.1)#1,312 |
| 63. | Garnet | 16.4% | 5.4%(+11.0)#63 | 5.3%(+11.1)#1,314 |
| 64. | Douglas City | 16.3% | 5.4%(+10.9)#64 | 5.3%(+11.0)#1,334 |
| 65. | Adin | 16.0% | 5.4%(+10.6)#65 | 5.3%(+10.7)#1,408 |
| 66. | Buttonwillow | 16.0% | 5.4%(+10.6)#66 | 5.3%(+10.7)#1,413 |
| 67. | Montalvin Manor | 15.8% | 5.4%(+10.4)#67 | 5.3%(+10.5)#1,457 |
| 68. | Mountain Gate | 15.4% | 5.4%(+10.1)#68 | 5.3%(+10.2)#1,517 |
| 69. | Mccloud | 15.2% | 5.4%(+9.81)#69 | 5.3%(+9.91)#1,578 |
| 70. | Samoa | 15.2% | 5.4%(+9.81)#70 | 5.3%(+9.90)#1,581 |
| 71. | Groveland | 15.2% | 5.4%(+9.77)#71 | 5.3%(+9.87)#1,584 |
| 72. | Bloomfield | 15.0% | 5.4%(+9.62)#72 | 5.3%(+9.71)#1,631 |
| 73. | Mcclellan Park | 15.0% | 5.4%(+9.58)#73 | 5.3%(+9.68)#1,646 |
| 74. | Garberville | 14.9% | 5.4%(+9.50)#74 | 5.3%(+9.60)#1,667 |
| 75. | Dorrington | 14.7% | 5.4%(+9.34)#75 | 5.3%(+9.44)#1,705 |
| 76. | Vandenberg Afb | 14.5% | 5.4%(+9.10)#76 | 5.3%(+9.19)#1,774 |
| 77. | Petaluma Center | 14.4% | 5.4%(+9.04)#77 | 5.3%(+9.14)#1,785 |
| 78. | Buena Vista | 14.4% | 5.4%(+9.03)#78 | 5.3%(+9.12)#1,789 |
| 79. | San Miguel Cdp San Luis Obispo County | 14.4% | 5.4%(+8.97)#79 | 5.3%(+9.07)#1,802 |
| 80. | Seaside | 14.2% | 5.4%(+8.84)#80 | 5.3%(+8.93)#1,855 |
| 81. | Tahoe Vista | 14.1% | 5.4%(+8.71)#81 | 5.3%(+8.81)#1,884 |
| 82. | Hayfork | 13.8% | 5.4%(+8.46)#82 | 5.3%(+8.55)#1,960 |
| 83. | Castella | 13.6% | 5.4%(+8.25)#83 | 5.3%(+8.35)#2,024 |
| 84. | Alondra Park | 13.6% | 5.4%(+8.24)#84 | 5.3%(+8.33)#2,031 |
| 85. | Descanso | 13.5% | 5.4%(+8.16)#85 | 5.3%(+8.26)#2,054 |
| 86. | Auberry | 13.5% | 5.4%(+8.10)#86 | 5.3%(+8.20)#2,074 |
| 87. | Home Garden | 13.3% | 5.4%(+7.96)#87 | 5.3%(+8.06)#2,121 |
| 88. | Wofford Heights | 13.1% | 5.4%(+7.73)#88 | 5.3%(+7.83)#2,211 |
| 89. | Meiners Oaks | 13.0% | 5.4%(+7.66)#89 | 5.3%(+7.76)#2,234 |
| 90. | Eucalyptus Hills | 12.9% | 5.4%(+7.51)#90 | 5.3%(+7.60)#2,304 |
| 91. | Guerneville | 12.9% | 5.4%(+7.49)#91 | 5.3%(+7.59)#2,310 |
| 92. | Yreka | 12.8% | 5.4%(+7.44)#92 | 5.3%(+7.54)#2,336 |
| 93. | University Of California-Santa Barbara | 12.7% | 5.4%(+7.31)#93 | 5.3%(+7.41)#2,405 |
| 94. | Cathedral City | 12.6% | 5.4%(+7.22)#94 | 5.3%(+7.31)#2,438 |
| 95. | Pine Hills | 12.6% | 5.4%(+7.20)#95 | 5.3%(+7.30)#2,450 |
| 96. | Lake California | 12.6% | 5.4%(+7.19)#96 | 5.3%(+7.29)#2,454 |
| 97. | Tulelake | 12.6% | 5.4%(+7.18)#97 | 5.3%(+7.28)#2,457 |
| 98. | Valley Springs | 12.5% | 5.4%(+7.12)#98 | 5.3%(+7.22)#2,476 |
| 99. | Di Giorgio | 12.5% | 5.4%(+7.12)#99 | 5.3%(+7.21)#2,494 |
| 100. | La Cresta | 12.4% | 5.4%(+7.04)#100 | 5.3%(+7.14)#2,553 |
Common Questions
What are the Top 10 Cities with the Highest Percentage of Population Employed in Food Preparation & Serving in California?
Top 10 Cities with the Highest Percentage of Population Employed in Food Preparation & Serving in California are:
#1
100.0%
#2
75.5%
#3
64.7%
#4
55.0%
#5
52.8%
#6
50.0%
#7
39.0%
#8
38.1%
#9
37.6%
#10
35.3%
What city has the Highest Percentage of Population Employed in Food Preparation & Serving in California?
North San Juan has the Highest Percentage of Population Employed in Food Preparation & Serving in California with 100.0%.
What is the Percentage of Population Employed in Food Preparation & Serving in the State of California?
Percentage of Population Employed in Food Preparation & Serving in California is 5.4%.
What is the Percentage of Population Employed in Food Preparation & Serving in the United States?
Percentage of Population Employed in Food Preparation & Serving in the United States is 5.3%.