Cities with the Highest Percentage of Immigrants from Belgium in California
RELATED REPORTS & OPTIONS
Belgium
California
Compare Cities
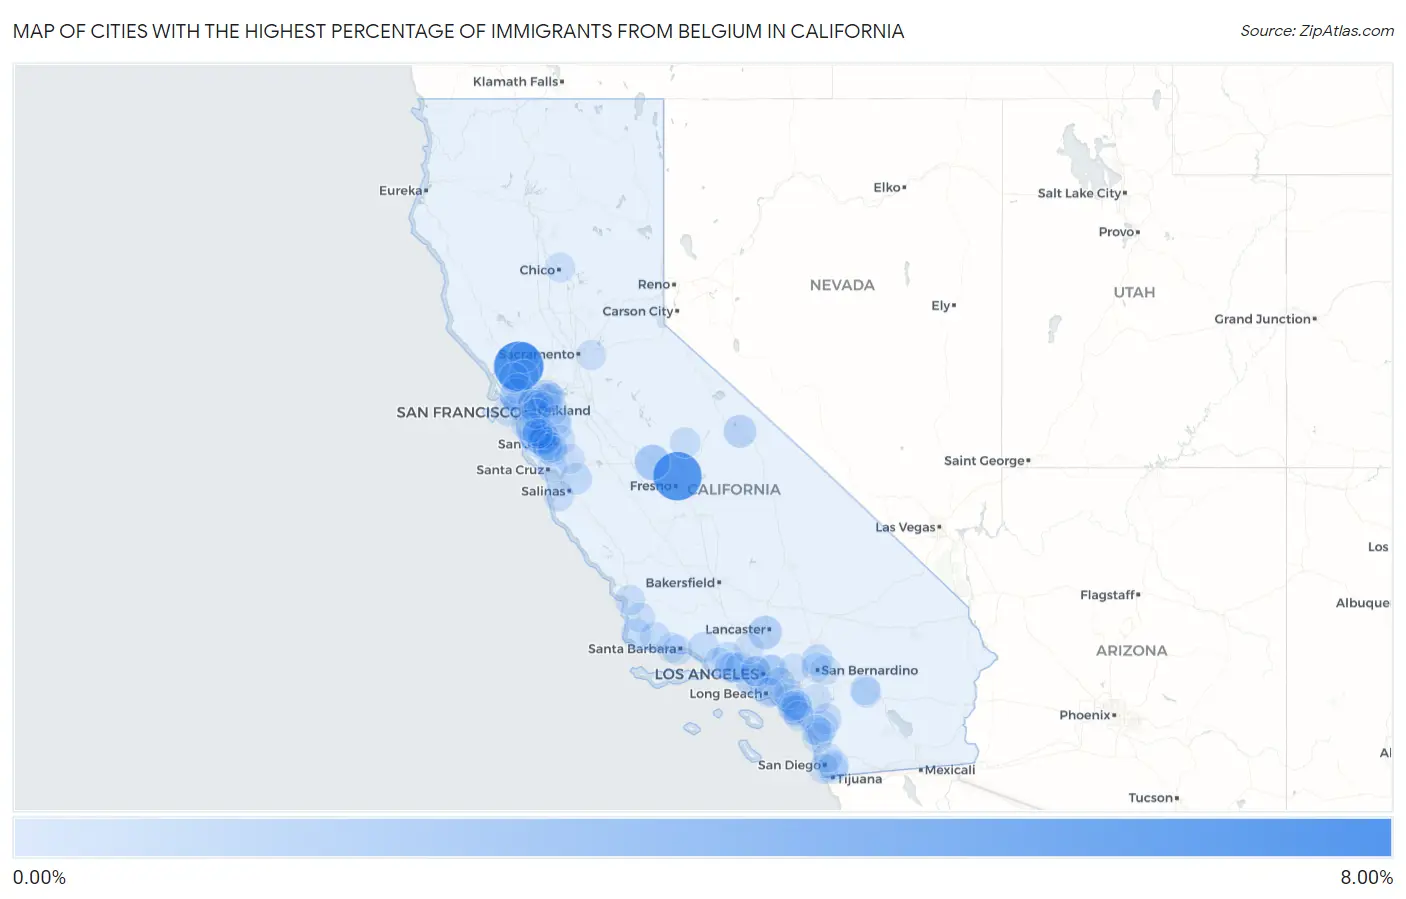
Map of Cities with the Highest Percentage of Immigrants from Belgium in California
0.00%
8.00%
Cities with the Highest Percentage of Immigrants from Belgium in California
| City | Belgium | vs State | vs National | |
| 1. | Kenwood | 6.08% | 0.016%(+6.06)#1 | 0.010%(+6.07)#2 |
| 2. | Fort Washington | 5.70% | 0.016%(+5.68)#2 | 0.010%(+5.69)#5 |
| 3. | Fairmead | 1.58% | 0.016%(+1.57)#3 | 0.010%(+1.57)#23 |
| 4. | Quartz Hill | 1.05% | 0.016%(+1.03)#4 | 0.010%(+1.04)#37 |
| 5. | Sleepy Hollow | 0.94% | 0.016%(+0.920)#5 | 0.010%(+0.925)#49 |
| 6. | Marina Del Rey | 0.88% | 0.016%(+0.860)#6 | 0.010%(+0.866)#54 |
| 7. | Swall Meadows | 0.82% | 0.016%(+0.806)#7 | 0.010%(+0.811)#60 |
| 8. | Pacheco | 0.77% | 0.016%(+0.758)#8 | 0.010%(+0.763)#67 |
| 9. | Trabuco Canyon | 0.63% | 0.016%(+0.612)#9 | 0.010%(+0.617)#80 |
| 10. | San Juan Bautista | 0.46% | 0.016%(+0.440)#10 | 0.010%(+0.445)#110 |
| 11. | Portola Valley | 0.45% | 0.016%(+0.439)#11 | 0.010%(+0.444)#111 |
| 12. | Crestline | 0.41% | 0.016%(+0.391)#12 | 0.010%(+0.397)#121 |
| 13. | Kensington | 0.34% | 0.016%(+0.323)#13 | 0.010%(+0.329)#138 |
| 14. | Emerald Lake Hills | 0.34% | 0.016%(+0.323)#14 | 0.010%(+0.328)#139 |
| 15. | Sunol | 0.33% | 0.016%(+0.310)#15 | 0.010%(+0.316)#142 |
| 16. | Moorpark | 0.32% | 0.016%(+0.300)#16 | 0.010%(+0.306)#145 |
| 17. | Mira Monte | 0.29% | 0.016%(+0.277)#17 | 0.010%(+0.282)#158 |
| 18. | Strawberry Cdp Marin County | 0.27% | 0.016%(+0.251)#18 | 0.010%(+0.256)#170 |
| 19. | Bonsall | 0.27% | 0.016%(+0.251)#19 | 0.010%(+0.256)#171 |
| 20. | Solvang | 0.27% | 0.016%(+0.249)#20 | 0.010%(+0.255)#173 |
| 21. | South Pasadena | 0.26% | 0.016%(+0.244)#21 | 0.010%(+0.249)#176 |
| 22. | Ladera Ranch | 0.19% | 0.016%(+0.178)#22 | 0.010%(+0.183)#236 |
| 23. | Woodside | 0.19% | 0.016%(+0.175)#23 | 0.010%(+0.180)#239 |
| 24. | Camp Pendleton Mainside | 0.19% | 0.016%(+0.172)#24 | 0.010%(+0.177)#240 |
| 25. | Foster City | 0.18% | 0.016%(+0.168)#25 | 0.010%(+0.173)#244 |
| 26. | Los Altos | 0.17% | 0.016%(+0.151)#26 | 0.010%(+0.157)#260 |
| 27. | St Helena | 0.17% | 0.016%(+0.150)#27 | 0.010%(+0.155)#261 |
| 28. | Tamalpais Homestead Valley | 0.16% | 0.016%(+0.148)#28 | 0.010%(+0.153)#267 |
| 29. | Rainbow | 0.16% | 0.016%(+0.148)#29 | 0.010%(+0.153)#268 |
| 30. | Oakhurst | 0.16% | 0.016%(+0.144)#30 | 0.010%(+0.149)#272 |
| 31. | San Juan Capistrano | 0.16% | 0.016%(+0.144)#31 | 0.010%(+0.149)#273 |
| 32. | Pleasant Hill | 0.16% | 0.016%(+0.141)#32 | 0.010%(+0.146)#280 |
| 33. | Menlo Park | 0.13% | 0.016%(+0.116)#33 | 0.010%(+0.122)#305 |
| 34. | Del Rey Oaks | 0.12% | 0.016%(+0.108)#34 | 0.010%(+0.114)#324 |
| 35. | Los Altos Hills | 0.12% | 0.016%(+0.103)#35 | 0.010%(+0.108)#332 |
| 36. | Camarillo | 0.12% | 0.016%(+0.100)#36 | 0.010%(+0.106)#335 |
| 37. | San Francisco | 0.11% | 0.016%(+0.091)#37 | 0.010%(+0.096)#353 |
| 38. | Sonoma | 0.10% | 0.016%(+0.087)#38 | 0.010%(+0.092)#355 |
| 39. | East Foothills | 0.097% | 0.016%(+0.081)#39 | 0.010%(+0.086)#369 |
| 40. | Alameda | 0.097% | 0.016%(+0.081)#40 | 0.010%(+0.086)#370 |
| 41. | Agoura Hills | 0.095% | 0.016%(+0.079)#41 | 0.010%(+0.084)#374 |
| 42. | Rancho Mirage | 0.093% | 0.016%(+0.077)#42 | 0.010%(+0.082)#377 |
| 43. | Bonita | 0.089% | 0.016%(+0.073)#43 | 0.010%(+0.079)#387 |
| 44. | Westlake Village | 0.088% | 0.016%(+0.072)#44 | 0.010%(+0.078)#392 |
| 45. | Beverly Hills | 0.086% | 0.016%(+0.071)#45 | 0.010%(+0.076)#396 |
| 46. | Rossmoor | 0.085% | 0.016%(+0.069)#46 | 0.010%(+0.075)#397 |
| 47. | Piedmont | 0.081% | 0.016%(+0.065)#47 | 0.010%(+0.070)#407 |
| 48. | Millbrae | 0.079% | 0.016%(+0.063)#48 | 0.010%(+0.068)#413 |
| 49. | La Canada Flintridge | 0.079% | 0.016%(+0.063)#49 | 0.010%(+0.068)#415 |
| 50. | Lompoc | 0.077% | 0.016%(+0.061)#50 | 0.010%(+0.067)#419 |
| 51. | Soquel | 0.076% | 0.016%(+0.060)#51 | 0.010%(+0.066)#423 |
| 52. | Saratoga | 0.071% | 0.016%(+0.056)#52 | 0.010%(+0.061)#430 |
| 53. | Berkeley | 0.071% | 0.016%(+0.055)#53 | 0.010%(+0.060)#433 |
| 54. | Mountain View | 0.068% | 0.016%(+0.052)#54 | 0.010%(+0.058)#450 |
| 55. | Moraga | 0.065% | 0.016%(+0.050)#55 | 0.010%(+0.055)#455 |
| 56. | Arroyo Grande | 0.065% | 0.016%(+0.049)#56 | 0.010%(+0.055)#456 |
| 57. | Novato | 0.062% | 0.016%(+0.047)#57 | 0.010%(+0.052)#469 |
| 58. | Irvine | 0.060% | 0.016%(+0.044)#58 | 0.010%(+0.049)#479 |
| 59. | La Presa | 0.060% | 0.016%(+0.044)#59 | 0.010%(+0.049)#480 |
| 60. | Laguna Niguel | 0.058% | 0.016%(+0.042)#60 | 0.010%(+0.047)#484 |
| 61. | East San Gabriel | 0.057% | 0.016%(+0.042)#61 | 0.010%(+0.047)#486 |
| 62. | Lake Elsinore | 0.053% | 0.016%(+0.037)#62 | 0.010%(+0.042)#495 |
| 63. | North Tustin | 0.052% | 0.016%(+0.036)#63 | 0.010%(+0.041)#504 |
| 64. | Palo Alto | 0.052% | 0.016%(+0.036)#64 | 0.010%(+0.041)#505 |
| 65. | Danville | 0.048% | 0.016%(+0.033)#65 | 0.010%(+0.038)#519 |
| 66. | Carlsbad | 0.048% | 0.016%(+0.032)#66 | 0.010%(+0.037)#520 |
| 67. | Orinda | 0.046% | 0.016%(+0.031)#67 | 0.010%(+0.036)#527 |
| 68. | Claremont | 0.046% | 0.016%(+0.030)#68 | 0.010%(+0.036)#528 |
| 69. | Chico | 0.046% | 0.016%(+0.030)#69 | 0.010%(+0.035)#530 |
| 70. | Calabasas | 0.043% | 0.016%(+0.028)#70 | 0.010%(+0.033)#546 |
| 71. | Los Gatos | 0.042% | 0.016%(+0.027)#71 | 0.010%(+0.032)#551 |
| 72. | Redwood City | 0.041% | 0.016%(+0.025)#72 | 0.010%(+0.030)#555 |
| 73. | Goleta | 0.040% | 0.016%(+0.024)#73 | 0.010%(+0.029)#559 |
| 74. | West Hollywood | 0.040% | 0.016%(+0.024)#74 | 0.010%(+0.029)#562 |
| 75. | La Habra | 0.038% | 0.016%(+0.022)#75 | 0.010%(+0.028)#568 |
| 76. | East Palo Alto | 0.037% | 0.016%(+0.022)#76 | 0.010%(+0.027)#575 |
| 77. | Cupertino | 0.037% | 0.016%(+0.021)#77 | 0.010%(+0.026)#579 |
| 78. | Santa Barbara | 0.035% | 0.016%(+0.019)#78 | 0.010%(+0.024)#592 |
| 79. | Vista | 0.035% | 0.016%(+0.019)#79 | 0.010%(+0.024)#595 |
| 80. | Pleasanton | 0.034% | 0.016%(+0.019)#80 | 0.010%(+0.024)#596 |
| 81. | San Mateo | 0.034% | 0.016%(+0.018)#81 | 0.010%(+0.023)#601 |
| 82. | Coronado | 0.032% | 0.016%(+0.016)#82 | 0.010%(+0.021)#611 |
| 83. | Highland | 0.032% | 0.016%(+0.016)#83 | 0.010%(+0.021)#613 |
| 84. | Santa Clarita | 0.031% | 0.016%(+0.016)#84 | 0.010%(+0.021)#615 |
| 85. | Morgan Hill | 0.031% | 0.016%(+0.015)#85 | 0.010%(+0.020)#619 |
| 86. | Mission Viejo | 0.030% | 0.016%(+0.014)#86 | 0.010%(+0.020)#624 |
| 87. | Oakland | 0.029% | 0.016%(+0.013)#87 | 0.010%(+0.019)#630 |
| 88. | Cathedral City | 0.029% | 0.016%(+0.013)#88 | 0.010%(+0.018)#631 |
| 89. | Petaluma | 0.028% | 0.016%(+0.013)#89 | 0.010%(+0.018)#632 |
| 90. | Concord | 0.028% | 0.016%(+0.012)#90 | 0.010%(+0.018)#639 |
| 91. | Oceanside | 0.026% | 0.016%(+0.011)#91 | 0.010%(+0.016)#651 |
| 92. | San Diego | 0.026% | 0.016%(+0.010)#92 | 0.010%(+0.015)#654 |
| 93. | Rancho Cordova | 0.025% | 0.016%(+0.010)#93 | 0.010%(+0.015)#658 |
| 94. | San Clemente | 0.023% | 0.016%(+0.008)#94 | 0.010%(+0.013)#671 |
| 95. | Long Beach | 0.023% | 0.016%(+0.007)#95 | 0.010%(+0.013)#673 |
| 96. | Campbell | 0.023% | 0.016%(+0.007)#96 | 0.010%(+0.013)#676 |
| 97. | Orcutt | 0.022% | 0.016%(+0.007)#97 | 0.010%(+0.012)#678 |
| 98. | San Bernardino | 0.022% | 0.016%(+0.006)#98 | 0.010%(+0.012)#681 |
| 99. | North Fair Oaks | 0.022% | 0.016%(+0.006)#99 | 0.010%(+0.011)#686 |
| 100. | Aliso Viejo | 0.021% | 0.016%(+0.006)#100 | 0.010%(+0.011)#697 |
Common Questions
What are the Top 10 Cities with the Highest Percentage of Immigrants from Belgium in California?
Top 10 Cities with the Highest Percentage of Immigrants from Belgium in California are:
#1
6.08%
#2
5.70%
#3
1.58%
#4
1.05%
#5
0.94%
#6
0.88%
#7
0.82%
#8
0.77%
#9
0.46%
#10
0.45%
What city has the Highest Percentage of Immigrants from Belgium in California?
Kenwood has the Highest Percentage of Immigrants from Belgium in California with 6.08%.
What is the Percentage of Immigrants from Belgium in the State of California?
Percentage of Immigrants from Belgium in California is 0.016%.
What is the Percentage of Immigrants from Belgium in the United States?
Percentage of Immigrants from Belgium in the United States is 0.010%.