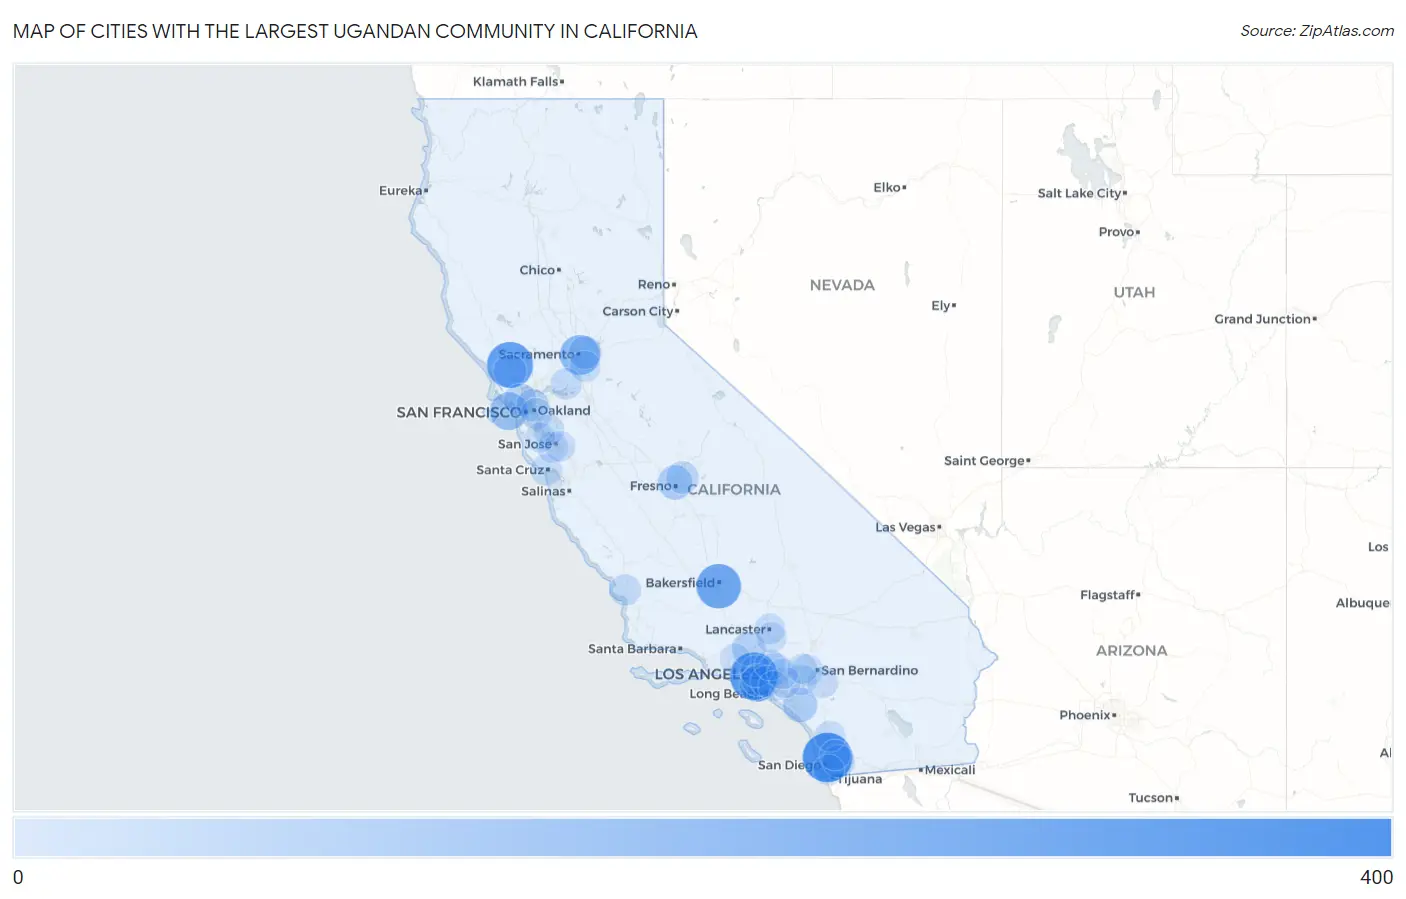
Cities with the Largest Ugandan Community in California
RELATED REPORTS & OPTIONS
Ugandan
California
Compare Cities
Map of Cities with the Largest Ugandan Community in California
0
400

Cities with the Largest Ugandan Community in California
| City | Ugandan | vs State | vs National | |
| 1. | San Diego | 347 | 2,482(13.98%)#1 | 25,234(1.38%)#3 |
| 2. | Los Angeles | 309 | 2,482(12.45%)#2 | 25,234(1.22%)#7 |
| 3. | Santa Rosa | 284 | 2,482(11.44%)#3 | 25,234(1.13%)#12 |
| 4. | Bakersfield | 254 | 2,482(10.23%)#4 | 25,234(1.01%)#13 |
| 5. | Sacramento | 175 | 2,482(7.05%)#5 | 25,234(0.69%)#25 |
| 6. | San Francisco | 135 | 2,482(5.44%)#6 | 25,234(0.53%)#43 |
| 7. | Hawthorne | 102 | 2,482(4.11%)#7 | 25,234(0.40%)#62 |
| 8. | Coto De Caza | 75 | 2,482(3.02%)#8 | 25,234(0.30%)#87 |
| 9. | Fresno | 74 | 2,482(2.98%)#9 | 25,234(0.29%)#88 |
| 10. | Santa Clarita | 61 | 2,482(2.46%)#10 | 25,234(0.24%)#99 |
| 11. | Rohnert Park | 50 | 2,482(2.01%)#11 | 25,234(0.20%)#119 |
| 12. | Arden Arcade | 47 | 2,482(1.89%)#12 | 25,234(0.19%)#124 |
| 13. | Clovis | 42 | 2,482(1.69%)#13 | 25,234(0.17%)#138 |
| 14. | Larkspur | 40 | 2,482(1.61%)#14 | 25,234(0.16%)#146 |
| 15. | Rancho San Diego | 39 | 2,482(1.57%)#15 | 25,234(0.15%)#148 |
| 16. | Berkeley | 36 | 2,482(1.45%)#16 | 25,234(0.14%)#156 |
| 17. | Arcadia | 33 | 2,482(1.33%)#17 | 25,234(0.13%)#169 |
| 18. | Inglewood | 32 | 2,482(1.29%)#18 | 25,234(0.13%)#172 |
| 19. | West Hollywood | 30 | 2,482(1.21%)#19 | 25,234(0.12%)#178 |
| 20. | Oakland | 23 | 2,482(0.93%)#20 | 25,234(0.09%)#204 |
| 21. | Rio Vista | 23 | 2,482(0.93%)#21 | 25,234(0.09%)#207 |
| 22. | San Luis Obispo | 22 | 2,482(0.89%)#22 | 25,234(0.09%)#212 |
| 23. | Santa Cruz | 21 | 2,482(0.85%)#23 | 25,234(0.08%)#218 |
| 24. | Fontana | 18 | 2,482(0.73%)#24 | 25,234(0.07%)#227 |
| 25. | Elk Grove | 16 | 2,482(0.64%)#25 | 25,234(0.06%)#234 |
| 26. | South Gate | 16 | 2,482(0.64%)#26 | 25,234(0.06%)#236 |
| 27. | Eastvale | 15 | 2,482(0.60%)#27 | 25,234(0.06%)#244 |
| 28. | Campbell | 15 | 2,482(0.60%)#28 | 25,234(0.06%)#245 |
| 29. | Moreno Valley | 14 | 2,482(0.56%)#29 | 25,234(0.06%)#253 |
| 30. | Brea | 14 | 2,482(0.56%)#30 | 25,234(0.06%)#256 |
| 31. | Fremont | 12 | 2,482(0.48%)#31 | 25,234(0.05%)#271 |
| 32. | Escondido | 11 | 2,482(0.44%)#32 | 25,234(0.04%)#284 |
| 33. | Lancaster | 10 | 2,482(0.40%)#33 | 25,234(0.04%)#293 |
| 34. | National City | 10 | 2,482(0.40%)#34 | 25,234(0.04%)#299 |
| 35. | San Jose | 9 | 2,482(0.36%)#35 | 25,234(0.04%)#306 |
| 36. | Pasadena | 9 | 2,482(0.36%)#36 | 25,234(0.04%)#310 |
| 37. | Cerritos | 9 | 2,482(0.36%)#37 | 25,234(0.04%)#312 |
| 38. | Simi Valley | 8 | 2,482(0.32%)#38 | 25,234(0.03%)#320 |
| 39. | Palmdale | 7 | 2,482(0.28%)#39 | 25,234(0.03%)#330 |
| 40. | West Covina | 7 | 2,482(0.28%)#40 | 25,234(0.03%)#331 |
| 41. | Santee | 7 | 2,482(0.28%)#41 | 25,234(0.03%)#332 |
| 42. | Rancho Cucamonga | 1 | 2,482(0.04%)#42 | 25,234(0.00%)#399 |
| 43. | Stanford | 1 | 2,482(0.04%)#43 | 25,234(0.00%)#413 |
Common Questions
What are the Top 10 Cities with the Largest Ugandan Community in California?
Top 10 Cities with the Largest Ugandan Community in California are:
#1
347
#2
309
#3
284
#4
254
#5
175
#6
135
#7
102
#8
75
#9
74
#10
61
What city has the Largest Ugandan Community in California?
San Diego has the Largest Ugandan Community in California with 347.
What is the Total Ugandan Population in the State of California?
Total Ugandan Population in California is 2,482.
What is the Total Ugandan Population in the United States?
Total Ugandan Population in the United States is 25,234.