Cities with the Highest Percentage of Central American Population in California
RELATED REPORTS & OPTIONS
Central American
California
Compare Cities
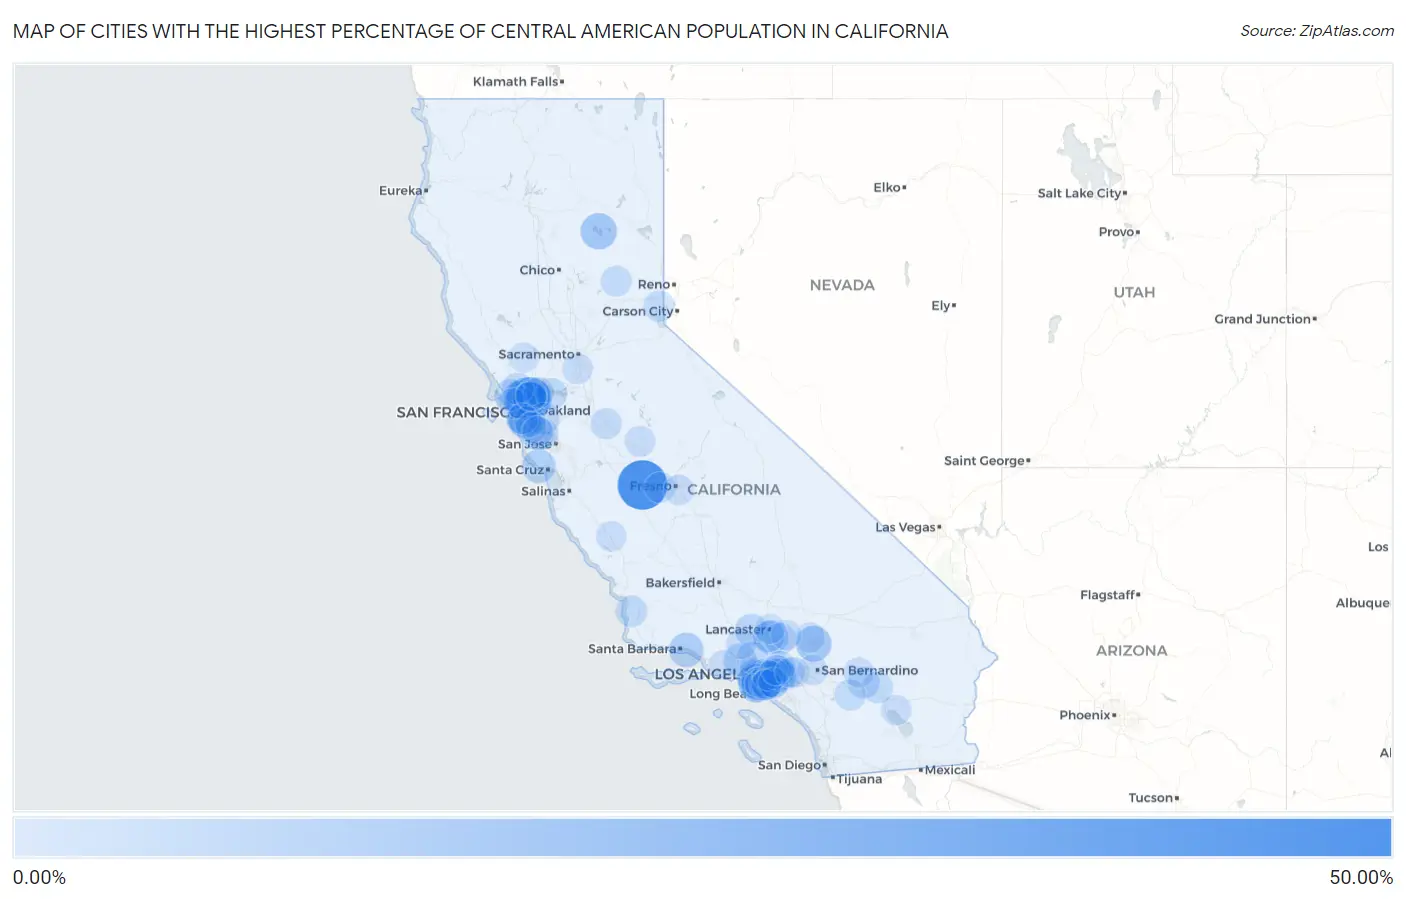
Map of Cities with the Highest Percentage of Central American Population in California
0.00%
50.00%
Cities with the Highest Percentage of Central American Population in California
| City | Central American | vs State | vs National | |
| 1. | Mendota | 40.88% | 3.80%(+37.1)#1 | 1.81%(+39.1)#20 |
| 2. | North Richmond | 28.31% | 3.80%(+24.5)#2 | 1.81%(+26.5)#71 |
| 3. | Rollingwood | 24.43% | 3.80%(+20.6)#3 | 1.81%(+22.6)#103 |
| 4. | Westmont | 22.94% | 3.80%(+19.1)#4 | 1.81%(+21.1)#112 |
| 5. | Montalvin Manor | 20.32% | 3.80%(+16.5)#5 | 1.81%(+18.5)#135 |
| 6. | Vernon | 18.54% | 3.80%(+14.7)#6 | 1.81%(+16.7)#173 |
| 7. | Lennox | 17.16% | 3.80%(+13.4)#7 | 1.81%(+15.3)#193 |
| 8. | Lake Almanor Country Club | 16.64% | 3.80%(+12.8)#8 | 1.81%(+14.8)#201 |
| 9. | Mountain View Acres | 15.97% | 3.80%(+12.2)#9 | 1.81%(+14.2)#215 |
| 10. | Willowbrook | 15.56% | 3.80%(+11.8)#10 | 1.81%(+13.7)#229 |
| 11. | Colma | 15.48% | 3.80%(+11.7)#11 | 1.81%(+13.7)#231 |
| 12. | Lawndale | 15.24% | 3.80%(+11.4)#12 | 1.81%(+13.4)#237 |
| 13. | Florence Graham | 14.86% | 3.80%(+11.1)#13 | 1.81%(+13.0)#247 |
| 14. | Cudahy | 14.59% | 3.80%(+10.8)#14 | 1.81%(+12.8)#254 |
| 15. | Maywood | 14.49% | 3.80%(+10.7)#15 | 1.81%(+12.7)#259 |
| 16. | Huntington Park | 14.36% | 3.80%(+10.6)#16 | 1.81%(+12.5)#264 |
| 17. | Summerland | 13.66% | 3.80%(+9.85)#17 | 1.81%(+11.8)#282 |
| 18. | Los Angeles | 12.85% | 3.80%(+9.05)#18 | 1.81%(+11.0)#313 |
| 19. | Bell Gardens | 12.84% | 3.80%(+9.04)#19 | 1.81%(+11.0)#314 |
| 20. | San Rafael | 12.82% | 3.80%(+9.02)#20 | 1.81%(+11.0)#318 |
| 21. | Palmdale | 12.81% | 3.80%(+9.01)#21 | 1.81%(+11.0)#319 |
| 22. | Davenport | 12.77% | 3.80%(+8.97)#22 | 1.81%(+11.0)#320 |
| 23. | Bell | 12.33% | 3.80%(+8.53)#23 | 1.81%(+10.5)#334 |
| 24. | Richmond | 12.26% | 3.80%(+8.46)#24 | 1.81%(+10.4)#338 |
| 25. | San Pablo | 11.88% | 3.80%(+8.07)#25 | 1.81%(+10.1)#352 |
| 26. | Alondra Park | 11.72% | 3.80%(+7.91)#26 | 1.81%(+9.90)#358 |
| 27. | South Gate | 11.63% | 3.80%(+7.83)#27 | 1.81%(+9.82)#360 |
| 28. | Walnut Park | 11.39% | 3.80%(+7.59)#28 | 1.81%(+9.58)#370 |
| 29. | Santa Susana | 11.31% | 3.80%(+7.50)#29 | 1.81%(+9.49)#372 |
| 30. | West Rancho Dominguez | 11.07% | 3.80%(+7.27)#30 | 1.81%(+9.26)#380 |
| 31. | Lynwood | 10.96% | 3.80%(+7.16)#31 | 1.81%(+9.15)#388 |
| 32. | Daly City | 10.85% | 3.80%(+7.04)#32 | 1.81%(+9.03)#394 |
| 33. | North Fair Oaks | 10.78% | 3.80%(+6.98)#33 | 1.81%(+8.97)#400 |
| 34. | Inglewood | 10.09% | 3.80%(+6.29)#34 | 1.81%(+8.28)#432 |
| 35. | Lake Hughes | 9.92% | 3.80%(+6.12)#35 | 1.81%(+8.11)#439 |
| 36. | Commerce | 9.61% | 3.80%(+5.81)#36 | 1.81%(+7.80)#460 |
| 37. | Industry | 9.40% | 3.80%(+5.60)#37 | 1.81%(+7.59)#473 |
| 38. | Hawthorne | 9.36% | 3.80%(+5.56)#38 | 1.81%(+7.55)#478 |
| 39. | San Bruno | 9.31% | 3.80%(+5.51)#39 | 1.81%(+7.50)#481 |
| 40. | Alto | 9.26% | 3.80%(+5.45)#40 | 1.81%(+7.44)#486 |
| 41. | Lagunitas Forest Knolls | 9.22% | 3.80%(+5.41)#41 | 1.81%(+7.40)#490 |
| 42. | Cherryland | 9.19% | 3.80%(+5.39)#42 | 1.81%(+7.38)#491 |
| 43. | East Palo Alto | 9.12% | 3.80%(+5.31)#43 | 1.81%(+7.30)#495 |
| 44. | Sun Village | 9.07% | 3.80%(+5.26)#44 | 1.81%(+7.25)#500 |
| 45. | Desert View Highlands | 9.01% | 3.80%(+5.20)#45 | 1.81%(+7.19)#504 |
| 46. | Novato | 8.92% | 3.80%(+5.11)#46 | 1.81%(+7.10)#510 |
| 47. | San Fernando | 8.90% | 3.80%(+5.10)#47 | 1.81%(+7.09)#512 |
| 48. | Garnet | 8.77% | 3.80%(+4.97)#48 | 1.81%(+6.96)#521 |
| 49. | Guadalupe | 8.53% | 3.80%(+4.73)#49 | 1.81%(+6.72)#536 |
| 50. | La Puente | 8.32% | 3.80%(+4.52)#50 | 1.81%(+6.51)#554 |
| 51. | Indio Hills | 8.26% | 3.80%(+4.46)#51 | 1.81%(+6.45)#561 |
| 52. | Bay Point | 8.17% | 3.80%(+4.37)#52 | 1.81%(+6.36)#570 |
| 53. | Downey | 8.13% | 3.80%(+4.33)#53 | 1.81%(+6.32)#574 |
| 54. | West Athens | 7.98% | 3.80%(+4.18)#54 | 1.81%(+6.17)#589 |
| 55. | Irwindale | 7.97% | 3.80%(+4.16)#55 | 1.81%(+6.15)#593 |
| 56. | South San Francisco | 7.92% | 3.80%(+4.12)#56 | 1.81%(+6.11)#602 |
| 57. | West Puente Valley | 7.83% | 3.80%(+4.03)#57 | 1.81%(+6.02)#610 |
| 58. | Carnelian Bay | 7.68% | 3.80%(+3.87)#58 | 1.81%(+5.86)#632 |
| 59. | Idyllwild Pine Cove | 7.65% | 3.80%(+3.85)#59 | 1.81%(+5.84)#635 |
| 60. | Downieville | 7.62% | 3.80%(+3.82)#60 | 1.81%(+5.81)#641 |
| 61. | South San Jose Hills | 7.61% | 3.80%(+3.81)#61 | 1.81%(+5.80)#642 |
| 62. | Rouse | 7.58% | 3.80%(+3.77)#62 | 1.81%(+5.76)#649 |
| 63. | Gardena | 7.56% | 3.80%(+3.76)#63 | 1.81%(+5.75)#651 |
| 64. | Kerman | 7.50% | 3.80%(+3.69)#64 | 1.81%(+5.68)#659 |
| 65. | Montclair | 7.47% | 3.80%(+3.66)#65 | 1.81%(+5.65)#661 |
| 66. | University Of California Merced | 7.32% | 3.80%(+3.52)#66 | 1.81%(+5.51)#683 |
| 67. | Stinson Beach | 7.28% | 3.80%(+3.47)#67 | 1.81%(+5.46)#687 |
| 68. | Baldwin Park | 7.27% | 3.80%(+3.47)#68 | 1.81%(+5.46)#688 |
| 69. | Compton | 7.27% | 3.80%(+3.46)#69 | 1.81%(+5.45)#689 |
| 70. | Port Costa | 7.17% | 3.80%(+3.37)#70 | 1.81%(+5.36)#699 |
| 71. | Pinole | 7.14% | 3.80%(+3.33)#71 | 1.81%(+5.32)#703 |
| 72. | Duarte | 7.06% | 3.80%(+3.26)#72 | 1.81%(+5.25)#707 |
| 73. | Hood | 7.01% | 3.80%(+3.20)#73 | 1.81%(+5.19)#714 |
| 74. | San Mateo | 6.99% | 3.80%(+3.18)#74 | 1.81%(+5.17)#719 |
| 75. | Castaic | 6.97% | 3.80%(+3.17)#75 | 1.81%(+5.16)#722 |
| 76. | Broadmoor | 6.90% | 3.80%(+3.10)#76 | 1.81%(+5.09)#736 |
| 77. | Norwalk | 6.88% | 3.80%(+3.07)#77 | 1.81%(+5.06)#740 |
| 78. | Tara Hills | 6.75% | 3.80%(+2.94)#78 | 1.81%(+4.93)#763 |
| 79. | North Shore | 6.74% | 3.80%(+2.94)#79 | 1.81%(+4.93)#766 |
| 80. | San Ardo | 6.73% | 3.80%(+2.93)#80 | 1.81%(+4.92)#769 |
| 81. | Morongo Valley | 6.70% | 3.80%(+2.90)#81 | 1.81%(+4.89)#775 |
| 82. | Montebello | 6.69% | 3.80%(+2.89)#82 | 1.81%(+4.88)#779 |
| 83. | South El Monte | 6.68% | 3.80%(+2.87)#83 | 1.81%(+4.86)#782 |
| 84. | Paramount | 6.64% | 3.80%(+2.84)#84 | 1.81%(+4.83)#788 |
| 85. | East Los Angeles | 6.60% | 3.80%(+2.80)#85 | 1.81%(+4.79)#792 |
| 86. | Adelanto | 6.56% | 3.80%(+2.76)#86 | 1.81%(+4.75)#798 |
| 87. | Malaga | 6.51% | 3.80%(+2.70)#87 | 1.81%(+4.69)#807 |
| 88. | Rialto | 6.44% | 3.80%(+2.64)#88 | 1.81%(+4.63)#814 |
| 89. | East Rancho Dominguez | 6.37% | 3.80%(+2.56)#89 | 1.81%(+4.55)#821 |
| 90. | Santa Fe Springs | 6.36% | 3.80%(+2.56)#90 | 1.81%(+4.55)#822 |
| 91. | Redwood City | 6.36% | 3.80%(+2.55)#91 | 1.81%(+4.54)#826 |
| 92. | North El Monte | 6.35% | 3.80%(+2.55)#92 | 1.81%(+4.54)#829 |
| 93. | St Helena | 6.30% | 3.80%(+2.50)#93 | 1.81%(+4.49)#838 |
| 94. | Lake Los Angeles | 6.28% | 3.80%(+2.48)#94 | 1.81%(+4.47)#840 |
| 95. | Bayview Cdp Contra Costa County | 6.25% | 3.80%(+2.44)#95 | 1.81%(+4.43)#844 |
| 96. | Lancaster | 6.24% | 3.80%(+2.44)#96 | 1.81%(+4.43)#845 |
| 97. | El Sobrante Cdp Contra Costa County | 6.16% | 3.80%(+2.36)#97 | 1.81%(+4.35)#857 |
| 98. | Casa Conejo | 6.12% | 3.80%(+2.32)#98 | 1.81%(+4.31)#867 |
| 99. | Edison | 6.12% | 3.80%(+2.32)#99 | 1.81%(+4.31)#868 |
| 100. | Pomona | 6.12% | 3.80%(+2.31)#100 | 1.81%(+4.30)#871 |
Common Questions
What are the Top 10 Cities with the Highest Percentage of Central American Population in California?
Top 10 Cities with the Highest Percentage of Central American Population in California are:
#1
40.88%
#2
28.31%
#3
24.43%
#4
22.94%
#5
20.32%
#6
18.54%
#7
17.16%
#8
16.64%
#9
15.97%
#10
15.56%
What city has the Highest Percentage of Central American Population in California?
Mendota has the Highest Percentage of Central American Population in California with 40.88%.
What is the Percentage of Central American Population in the State of California?
Percentage of Central American Population in California is 3.80%.
What is the Percentage of Central American Population in the United States?
Percentage of Central American Population in the United States is 1.81%.