Cities with the Largest Peruvian Community in California
RELATED REPORTS & OPTIONS
Peruvian
California
Compare Cities
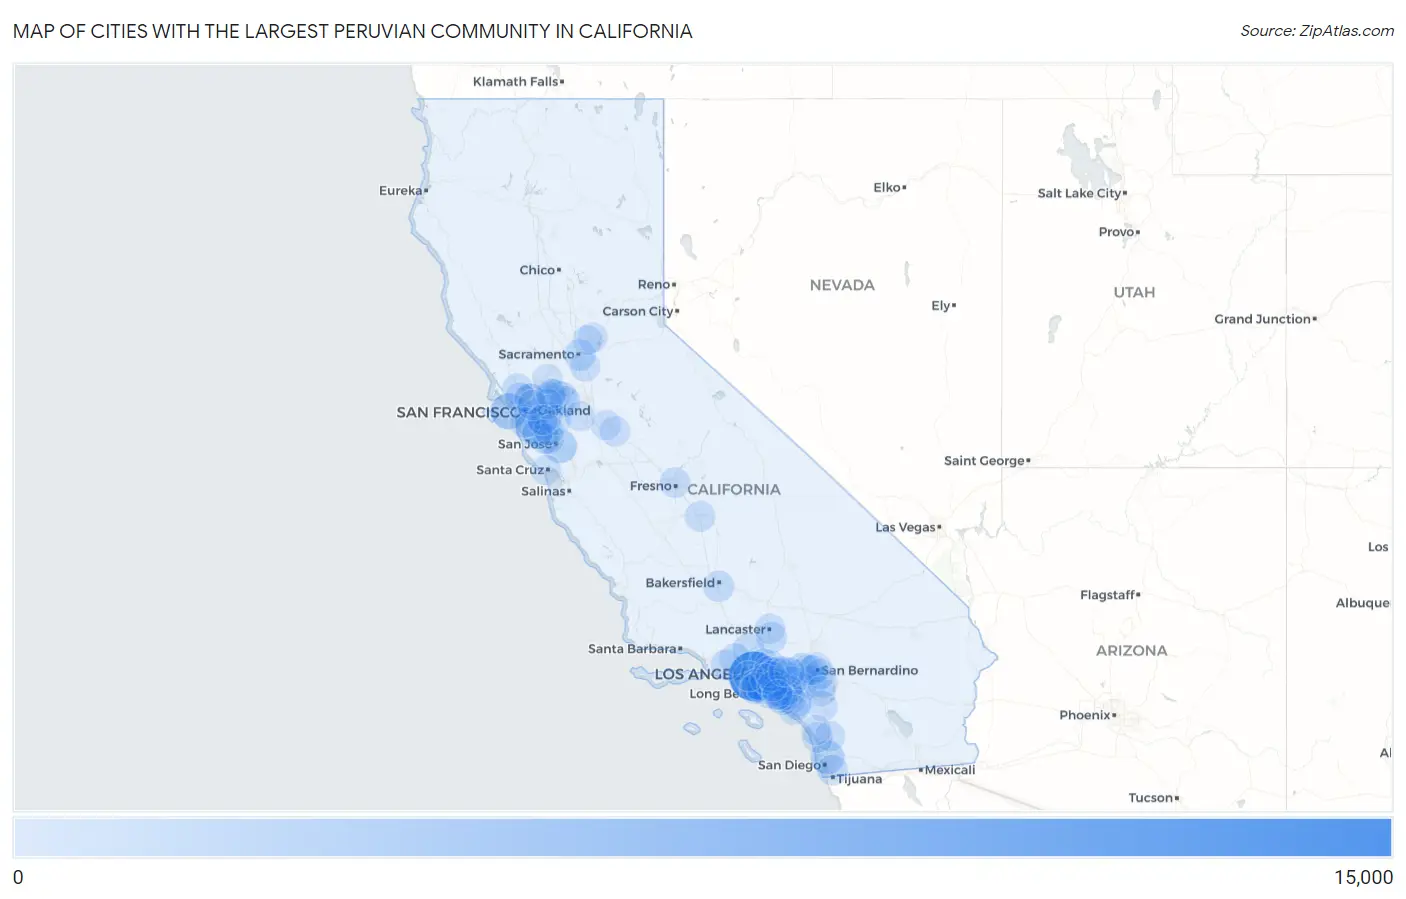
Map of Cities with the Largest Peruvian Community in California
0
15,000
Cities with the Largest Peruvian Community in California
| City | Peruvian | vs State | vs National | |
| 1. | Los Angeles | 13,670 | 114,315(11.96%)#1 | 712,740(1.92%)#2 |
| 2. | San Francisco | 4,248 | 114,315(3.72%)#2 | 712,740(0.60%)#7 |
| 3. | San Diego | 2,779 | 114,315(2.43%)#3 | 712,740(0.39%)#17 |
| 4. | San Jose | 2,767 | 114,315(2.42%)#4 | 712,740(0.39%)#19 |
| 5. | San Mateo | 1,444 | 114,315(1.26%)#5 | 712,740(0.20%)#55 |
| 6. | Antioch | 1,440 | 114,315(1.26%)#6 | 712,740(0.20%)#57 |
| 7. | Long Beach | 1,331 | 114,315(1.16%)#7 | 712,740(0.19%)#67 |
| 8. | Rancho Cucamonga | 1,308 | 114,315(1.14%)#8 | 712,740(0.18%)#70 |
| 9. | Riverside | 1,256 | 114,315(1.10%)#9 | 712,740(0.18%)#72 |
| 10. | Santa Clarita | 1,255 | 114,315(1.10%)#10 | 712,740(0.18%)#73 |
| 11. | Hayward | 1,179 | 114,315(1.03%)#11 | 712,740(0.17%)#77 |
| 12. | Sacramento | 1,157 | 114,315(1.01%)#12 | 712,740(0.16%)#80 |
| 13. | Ontario | 1,151 | 114,315(1.01%)#13 | 712,740(0.16%)#82 |
| 14. | Lawndale | 1,115 | 114,315(0.98%)#14 | 712,740(0.16%)#87 |
| 15. | Downey | 1,051 | 114,315(0.92%)#15 | 712,740(0.15%)#90 |
| 16. | Anaheim | 1,023 | 114,315(0.89%)#16 | 712,740(0.14%)#94 |
| 17. | Bakersfield | 1,003 | 114,315(0.88%)#17 | 712,740(0.14%)#98 |
| 18. | Palmdale | 943 | 114,315(0.82%)#18 | 712,740(0.13%)#104 |
| 19. | Pittsburg | 901 | 114,315(0.79%)#19 | 712,740(0.13%)#108 |
| 20. | Simi Valley | 893 | 114,315(0.78%)#20 | 712,740(0.13%)#110 |
| 21. | Concord | 880 | 114,315(0.77%)#21 | 712,740(0.12%)#113 |
| 22. | Torrance | 866 | 114,315(0.76%)#22 | 712,740(0.12%)#119 |
| 23. | Richmond | 834 | 114,315(0.73%)#23 | 712,740(0.12%)#125 |
| 24. | Brentwood | 797 | 114,315(0.70%)#24 | 712,740(0.11%)#131 |
| 25. | Novato | 756 | 114,315(0.66%)#25 | 712,740(0.11%)#137 |
| 26. | Sunnyvale | 743 | 114,315(0.65%)#26 | 712,740(0.10%)#140 |
| 27. | Hawthorne | 724 | 114,315(0.63%)#27 | 712,740(0.10%)#145 |
| 28. | Fontana | 705 | 114,315(0.62%)#28 | 712,740(0.10%)#150 |
| 29. | Carlsbad | 698 | 114,315(0.61%)#29 | 712,740(0.10%)#156 |
| 30. | Chula Vista | 691 | 114,315(0.60%)#30 | 712,740(0.10%)#160 |
| 31. | Thousand Oaks | 691 | 114,315(0.60%)#31 | 712,740(0.10%)#161 |
| 32. | Oakland | 678 | 114,315(0.59%)#32 | 712,740(0.10%)#165 |
| 33. | Redwood City | 661 | 114,315(0.58%)#33 | 712,740(0.09%)#174 |
| 34. | Castro Valley | 652 | 114,315(0.57%)#34 | 712,740(0.09%)#176 |
| 35. | Norwalk | 631 | 114,315(0.55%)#35 | 712,740(0.09%)#180 |
| 36. | Visalia | 616 | 114,315(0.54%)#36 | 712,740(0.09%)#185 |
| 37. | West Covina | 615 | 114,315(0.54%)#37 | 712,740(0.09%)#186 |
| 38. | Fresno | 614 | 114,315(0.54%)#38 | 712,740(0.09%)#187 |
| 39. | Moreno Valley | 608 | 114,315(0.53%)#39 | 712,740(0.09%)#190 |
| 40. | South San Francisco | 585 | 114,315(0.51%)#40 | 712,740(0.08%)#199 |
| 41. | Pasadena | 578 | 114,315(0.51%)#41 | 712,740(0.08%)#203 |
| 42. | San Pablo | 548 | 114,315(0.48%)#42 | 712,740(0.08%)#216 |
| 43. | Fullerton | 545 | 114,315(0.48%)#43 | 712,740(0.08%)#217 |
| 44. | Walnut Creek | 524 | 114,315(0.46%)#44 | 712,740(0.07%)#229 |
| 45. | Lake Forest | 523 | 114,315(0.46%)#45 | 712,740(0.07%)#230 |
| 46. | Irvine | 520 | 114,315(0.45%)#46 | 712,740(0.07%)#234 |
| 47. | San Bernardino | 519 | 114,315(0.45%)#47 | 712,740(0.07%)#235 |
| 48. | Lancaster | 519 | 114,315(0.45%)#48 | 712,740(0.07%)#236 |
| 49. | Garden Grove | 496 | 114,315(0.43%)#49 | 712,740(0.07%)#243 |
| 50. | Gardena | 479 | 114,315(0.42%)#50 | 712,740(0.07%)#251 |
| 51. | Corona | 477 | 114,315(0.42%)#51 | 712,740(0.07%)#252 |
| 52. | Carson | 464 | 114,315(0.41%)#52 | 712,740(0.07%)#263 |
| 53. | Glendale | 462 | 114,315(0.40%)#53 | 712,740(0.06%)#266 |
| 54. | San Rafael | 455 | 114,315(0.40%)#54 | 712,740(0.06%)#271 |
| 55. | Murrieta | 454 | 114,315(0.40%)#55 | 712,740(0.06%)#272 |
| 56. | Turlock | 454 | 114,315(0.40%)#56 | 712,740(0.06%)#273 |
| 57. | Escondido | 447 | 114,315(0.39%)#57 | 712,740(0.06%)#276 |
| 58. | Tustin | 446 | 114,315(0.39%)#58 | 712,740(0.06%)#279 |
| 59. | Elk Grove | 418 | 114,315(0.37%)#59 | 712,740(0.06%)#292 |
| 60. | El Monte | 418 | 114,315(0.37%)#60 | 712,740(0.06%)#293 |
| 61. | Baldwin Park | 417 | 114,315(0.36%)#61 | 712,740(0.06%)#294 |
| 62. | Pleasanton | 414 | 114,315(0.36%)#62 | 712,740(0.06%)#296 |
| 63. | Mountain View | 403 | 114,315(0.35%)#63 | 712,740(0.06%)#303 |
| 64. | Buena Park | 401 | 114,315(0.35%)#64 | 712,740(0.06%)#304 |
| 65. | North Fair Oaks | 395 | 114,315(0.35%)#65 | 712,740(0.06%)#307 |
| 66. | Redondo Beach | 390 | 114,315(0.34%)#66 | 712,740(0.05%)#312 |
| 67. | Santa Ana | 382 | 114,315(0.33%)#67 | 712,740(0.05%)#320 |
| 68. | La Mirada | 381 | 114,315(0.33%)#68 | 712,740(0.05%)#323 |
| 69. | Orange | 378 | 114,315(0.33%)#69 | 712,740(0.05%)#327 |
| 70. | Chino Hills | 363 | 114,315(0.32%)#70 | 712,740(0.05%)#340 |
| 71. | Fairfield | 359 | 114,315(0.31%)#71 | 712,740(0.05%)#343 |
| 72. | Loma Linda | 358 | 114,315(0.31%)#72 | 712,740(0.05%)#345 |
| 73. | Mission Viejo | 355 | 114,315(0.31%)#73 | 712,740(0.05%)#348 |
| 74. | El Sobrante Cdp Contra Costa County | 354 | 114,315(0.31%)#74 | 712,740(0.05%)#352 |
| 75. | Fremont | 352 | 114,315(0.31%)#75 | 712,740(0.05%)#354 |
| 76. | South Whittier | 346 | 114,315(0.30%)#76 | 712,740(0.05%)#363 |
| 77. | Laguna Niguel | 336 | 114,315(0.29%)#77 | 712,740(0.05%)#376 |
| 78. | San Bruno | 336 | 114,315(0.29%)#78 | 712,740(0.05%)#377 |
| 79. | Santa Monica | 331 | 114,315(0.29%)#79 | 712,740(0.05%)#384 |
| 80. | Rocklin | 331 | 114,315(0.29%)#80 | 712,740(0.05%)#385 |
| 81. | Berkeley | 326 | 114,315(0.29%)#81 | 712,740(0.05%)#391 |
| 82. | Fountain Valley | 326 | 114,315(0.29%)#82 | 712,740(0.05%)#392 |
| 83. | Alhambra | 314 | 114,315(0.27%)#83 | 712,740(0.04%)#404 |
| 84. | Stanton | 311 | 114,315(0.27%)#84 | 712,740(0.04%)#408 |
| 85. | Rialto | 309 | 114,315(0.27%)#85 | 712,740(0.04%)#410 |
| 86. | Huntington Park | 309 | 114,315(0.27%)#86 | 712,740(0.04%)#411 |
| 87. | Costa Mesa | 305 | 114,315(0.27%)#87 | 712,740(0.04%)#417 |
| 88. | Oceanside | 301 | 114,315(0.26%)#88 | 712,740(0.04%)#422 |
| 89. | Artesia | 300 | 114,315(0.26%)#89 | 712,740(0.04%)#424 |
| 90. | Montebello | 297 | 114,315(0.26%)#90 | 712,740(0.04%)#428 |
| 91. | Bay Point | 294 | 114,315(0.26%)#91 | 712,740(0.04%)#433 |
| 92. | Tracy | 289 | 114,315(0.25%)#92 | 712,740(0.04%)#442 |
| 93. | Modesto | 285 | 114,315(0.25%)#93 | 712,740(0.04%)#444 |
| 94. | Perris | 285 | 114,315(0.25%)#94 | 712,740(0.04%)#445 |
| 95. | Covina | 275 | 114,315(0.24%)#95 | 712,740(0.04%)#457 |
| 96. | Pomona | 274 | 114,315(0.24%)#96 | 712,740(0.04%)#458 |
| 97. | Santa Cruz | 274 | 114,315(0.24%)#97 | 712,740(0.04%)#460 |
| 98. | San Lorenzo | 274 | 114,315(0.24%)#98 | 712,740(0.04%)#462 |
| 99. | Roseville | 273 | 114,315(0.24%)#99 | 712,740(0.04%)#464 |
| 100. | Westminster | 272 | 114,315(0.24%)#100 | 712,740(0.04%)#467 |
Common Questions
What are the Top 10 Cities with the Largest Peruvian Community in California?
Top 10 Cities with the Largest Peruvian Community in California are:
#1
13,670
#2
4,248
#3
2,779
#4
2,767
#5
1,444
#6
1,440
#7
1,331
#8
1,308
#9
1,256
#10
1,255
What city has the Largest Peruvian Community in California?
Los Angeles has the Largest Peruvian Community in California with 13,670.
What is the Total Peruvian Population in the State of California?
Total Peruvian Population in California is 114,315.
What is the Total Peruvian Population in the United States?
Total Peruvian Population in the United States is 712,740.