College City, CA Map & Demographics
College City Map
College City Overview
$26,507
PER CAPITA INCOME
$79,559
AVG FAMILY INCOME
$79,265
AVG HOUSEHOLD INCOME
0.26
INEQUALITY / GINI INDEX
343
TOTAL POPULATION
152
MALE POPULATION
191
FEMALE POPULATION
79.58
MALES / 100 FEMALES
125.66
FEMALES / 100 MALES
30.3
MEDIAN AGE
4.2
AVG FAMILY SIZE
3.1
AVG HOUSEHOLD SIZE
126
LABOR FORCE [ PEOPLE ]
51.6%
PERCENT IN LABOR FORCE
College City Area Codes
Income in College City
Income Overview in College City
Per Capita Income in College City is $26,507, while median incomes of families and households are $79,559 and $79,265 respectively.
| Characteristic | Number | Measure |
| Per Capita Income | 343 | $26,507 |
| Median Family Income | 72 | $79,559 |
| Mean Family Income | 72 | $83,244 |
| Median Household Income | 112 | $79,265 |
| Mean Household Income | 112 | $80,329 |
| Income Deficit | 72 | $0 |
| Wage / Income Gap (%) | 343 | 0.00% |
| Wage / Income Gap ($) | 343 | 100.00¢ per $1 |
| Gini / Inequality Index | 343 | 0.26 |
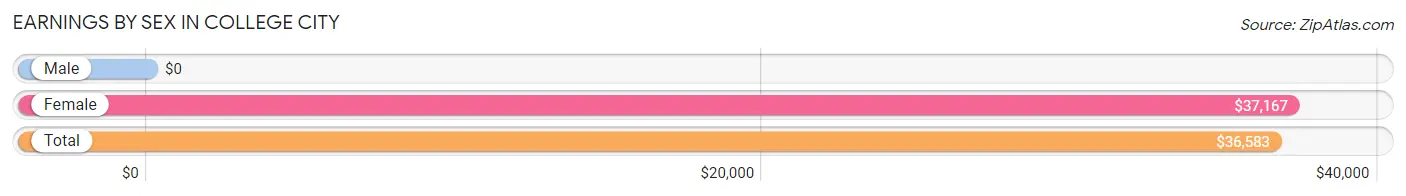
Earnings by Sex in College City
| Sex | Number | Average Earnings |
| Male | 69 (48.2%) | $0 |
| Female | 74 (51.7%) | $37,167 |
| Total | 143 (100.0%) | $36,583 |
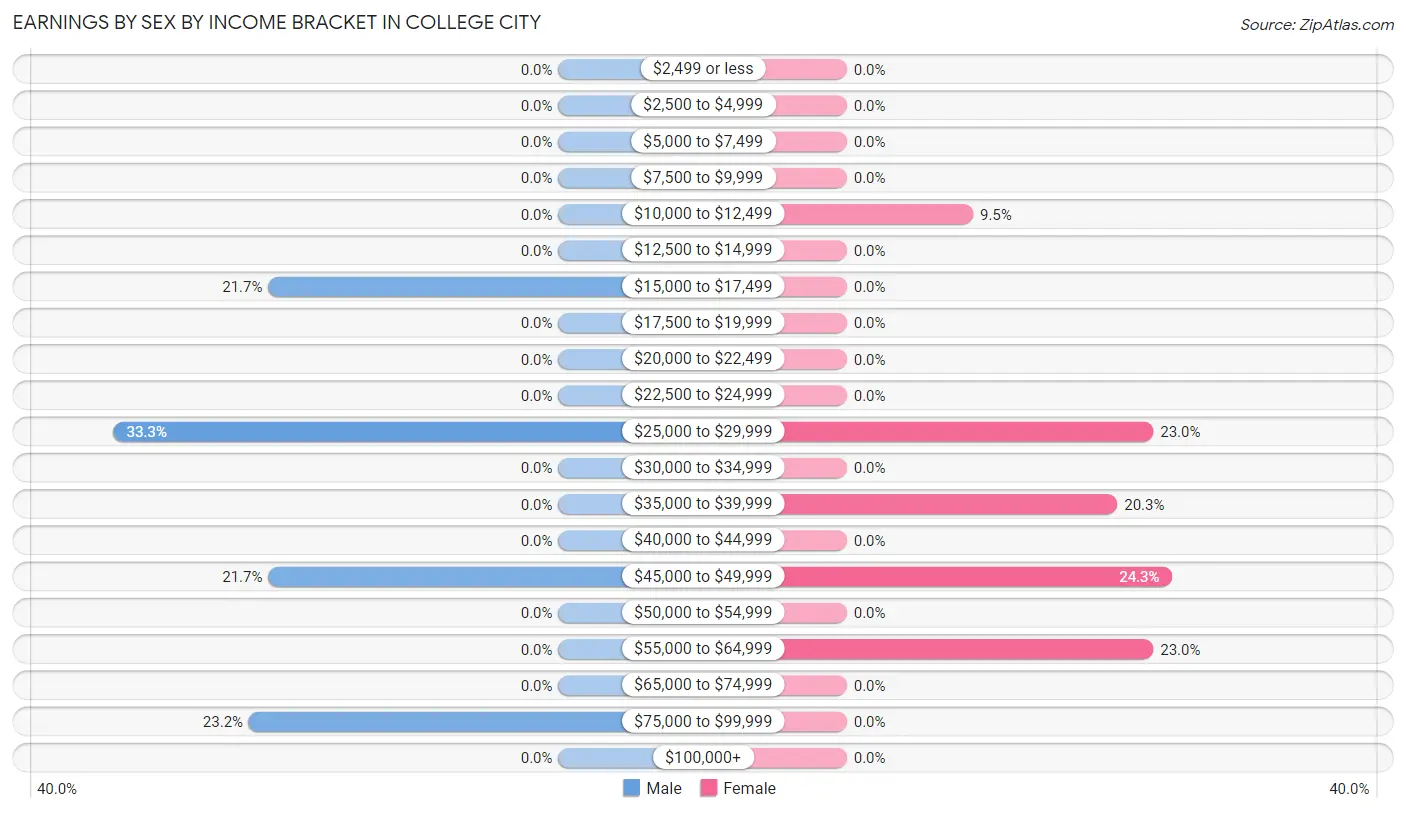
Earnings by Sex by Income Bracket in College City
The most common earnings brackets in College City are $25,000 to $29,999 for men (23 | 33.3%) and $45,000 to $49,999 for women (18 | 24.3%).
| Income | Male | Female |
| $2,499 or less | 0 (0.0%) | 0 (0.0%) |
| $2,500 to $4,999 | 0 (0.0%) | 0 (0.0%) |
| $5,000 to $7,499 | 0 (0.0%) | 0 (0.0%) |
| $7,500 to $9,999 | 0 (0.0%) | 0 (0.0%) |
| $10,000 to $12,499 | 0 (0.0%) | 7 (9.5%) |
| $12,500 to $14,999 | 0 (0.0%) | 0 (0.0%) |
| $15,000 to $17,499 | 15 (21.7%) | 0 (0.0%) |
| $17,500 to $19,999 | 0 (0.0%) | 0 (0.0%) |
| $20,000 to $22,499 | 0 (0.0%) | 0 (0.0%) |
| $22,500 to $24,999 | 0 (0.0%) | 0 (0.0%) |
| $25,000 to $29,999 | 23 (33.3%) | 17 (23.0%) |
| $30,000 to $34,999 | 0 (0.0%) | 0 (0.0%) |
| $35,000 to $39,999 | 0 (0.0%) | 15 (20.3%) |
| $40,000 to $44,999 | 0 (0.0%) | 0 (0.0%) |
| $45,000 to $49,999 | 15 (21.7%) | 18 (24.3%) |
| $50,000 to $54,999 | 0 (0.0%) | 0 (0.0%) |
| $55,000 to $64,999 | 0 (0.0%) | 17 (23.0%) |
| $65,000 to $74,999 | 0 (0.0%) | 0 (0.0%) |
| $75,000 to $99,999 | 16 (23.2%) | 0 (0.0%) |
| $100,000+ | 0 (0.0%) | 0 (0.0%) |
| Total | 69 (100.0%) | 74 (100.0%) |
Earnings by Sex by Educational Attainment in College City
| Educational Attainment | Male Income | Female Income |
| Less than High School | - | - |
| High School Diploma | - | - |
| College or Associate's Degree | - | - |
| Bachelor's Degree | - | - |
| Graduate Degree | - | - |
| Total | $48,833 | $37,167 |
Family Income in College City
Family Income Brackets in College City
According to the College City family income data, there are 32 families falling into the $75,000 to $99,999 income range, which is the most common income bracket and makes up 44.4% of all families.
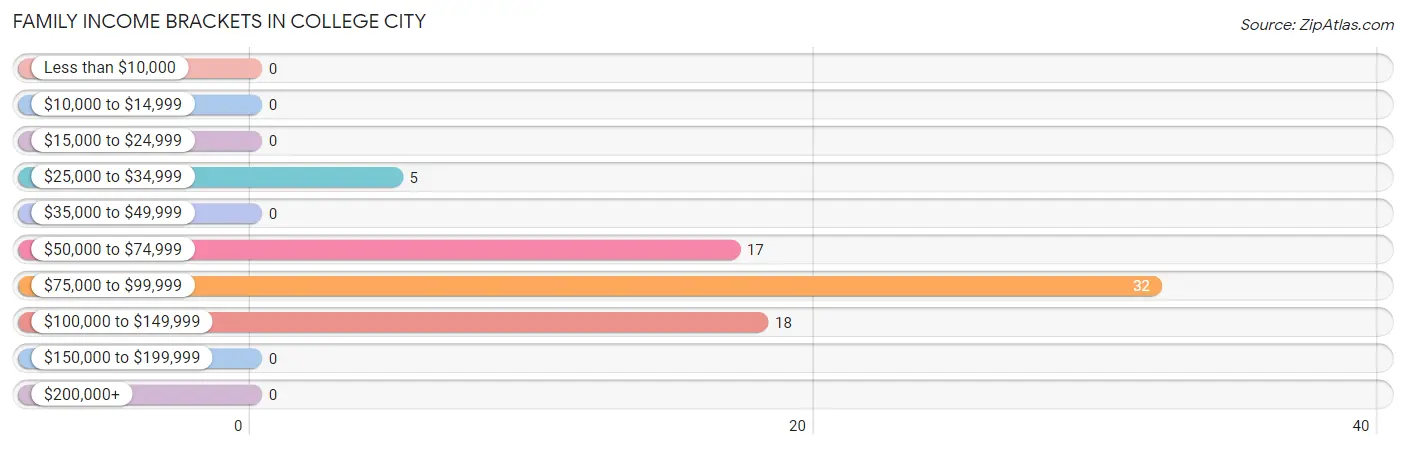
| Income Bracket | # Families | % Families |
| Less than $10,000 | 0 | 0.0% |
| $10,000 to $14,999 | 0 | 0.0% |
| $15,000 to $24,999 | 0 | 0.0% |
| $25,000 to $34,999 | 5 | 6.9% |
| $35,000 to $49,999 | 0 | 0.0% |
| $50,000 to $74,999 | 17 | 23.6% |
| $75,000 to $99,999 | 32 | 44.4% |
| $100,000 to $149,999 | 18 | 25.0% |
| $150,000 to $199,999 | 0 | 0.0% |
| $200,000+ | 0 | 0.0% |
Family Income by Famaliy Size in College City
| Income Bracket | # Families | Median Income |
| 2-Person Families | 23 (31.9%) | $0 |
| 3-Person Families | 0 (0.0%) | $0 |
| 4-Person Families | 17 (23.6%) | $0 |
| 5-Person Families | 32 (44.4%) | $0 |
| 6-Person Families | 0 (0.0%) | $0 |
| 7+ Person Families | 0 (0.0%) | $0 |
| Total | 72 (100.0%) | $79,559 |
Family Income by Number of Earners in College City
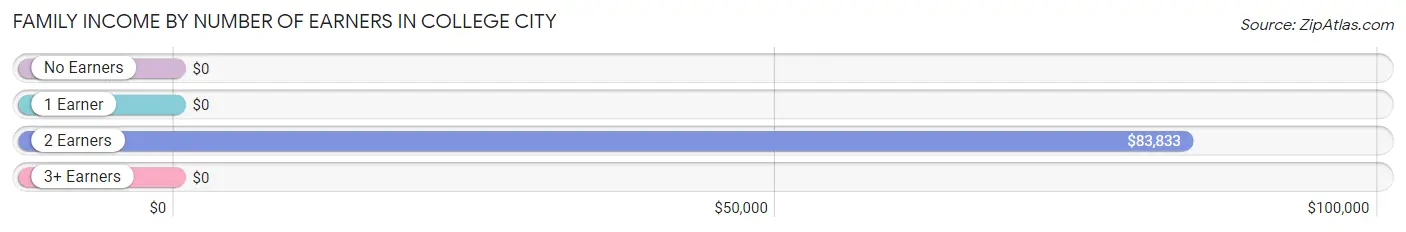
| Number of Earners | # Families | Median Income |
| No Earners | 5 (6.9%) | $0 |
| 1 Earner | 17 (23.6%) | $0 |
| 2 Earners | 50 (69.4%) | $83,833 |
| 3+ Earners | 0 (0.0%) | $0 |
| Total | 72 (100.0%) | $79,559 |
Household Income in College City
Household Income Brackets in College City
With 36 households falling in the category, the $100,000 to $149,999 income range is the most frequent in College City, accounting for 32.1% of all households.
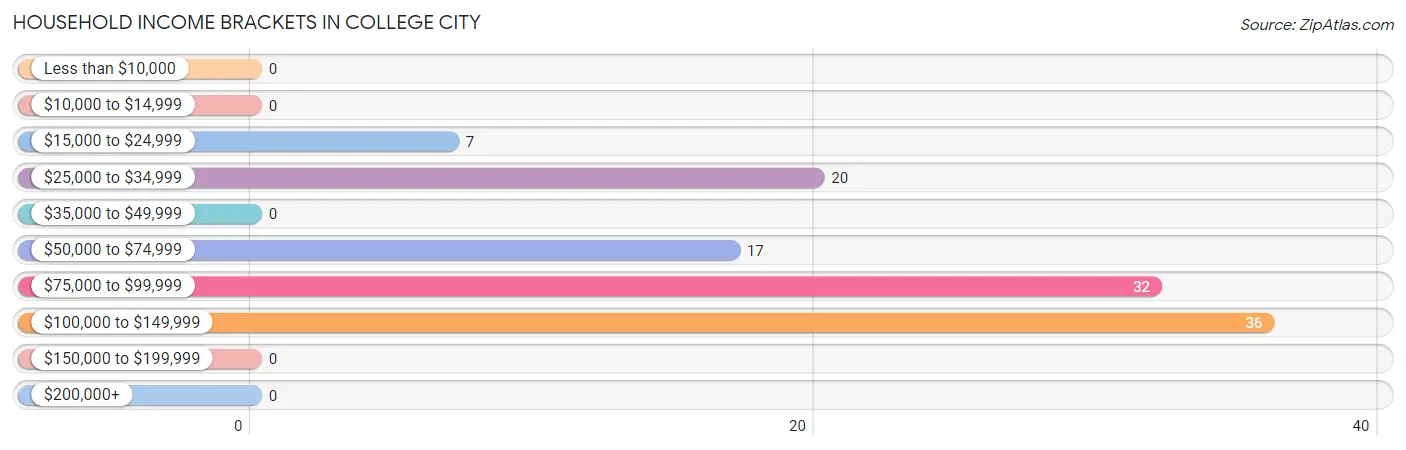
| Income Bracket | # Households | % Households |
| Less than $10,000 | 0 | 0.0% |
| $10,000 to $14,999 | 0 | 0.0% |
| $15,000 to $24,999 | 7 | 6.3% |
| $25,000 to $34,999 | 20 | 17.9% |
| $35,000 to $49,999 | 0 | 0.0% |
| $50,000 to $74,999 | 17 | 15.2% |
| $75,000 to $99,999 | 32 | 28.6% |
| $100,000 to $149,999 | 36 | 32.1% |
| $150,000 to $199,999 | 0 | 0.0% |
| $200,000+ | 0 | 0.0% |
Household Income by Householder Age in College City
The median household income in College City is $79,265, with the highest median household income of $79,926 found in the 25 to 44 years age bracket for the primary householder. A total of 67 households (59.8%) fall into this category.
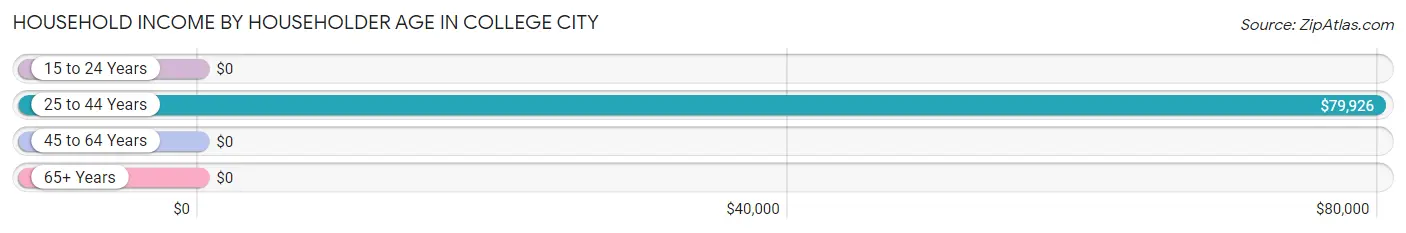
| Income Bracket | # Households | Median Income |
| 15 to 24 Years | 0 (0.0%) | $0 |
| 25 to 44 Years | 67 (59.8%) | $79,926 |
| 45 to 64 Years | 0 (0.0%) | $0 |
| 65+ Years | 45 (40.2%) | $0 |
| Total | 112 (100.0%) | $79,265 |
Poverty in College City
Income Below Poverty by Sex and Age in College City
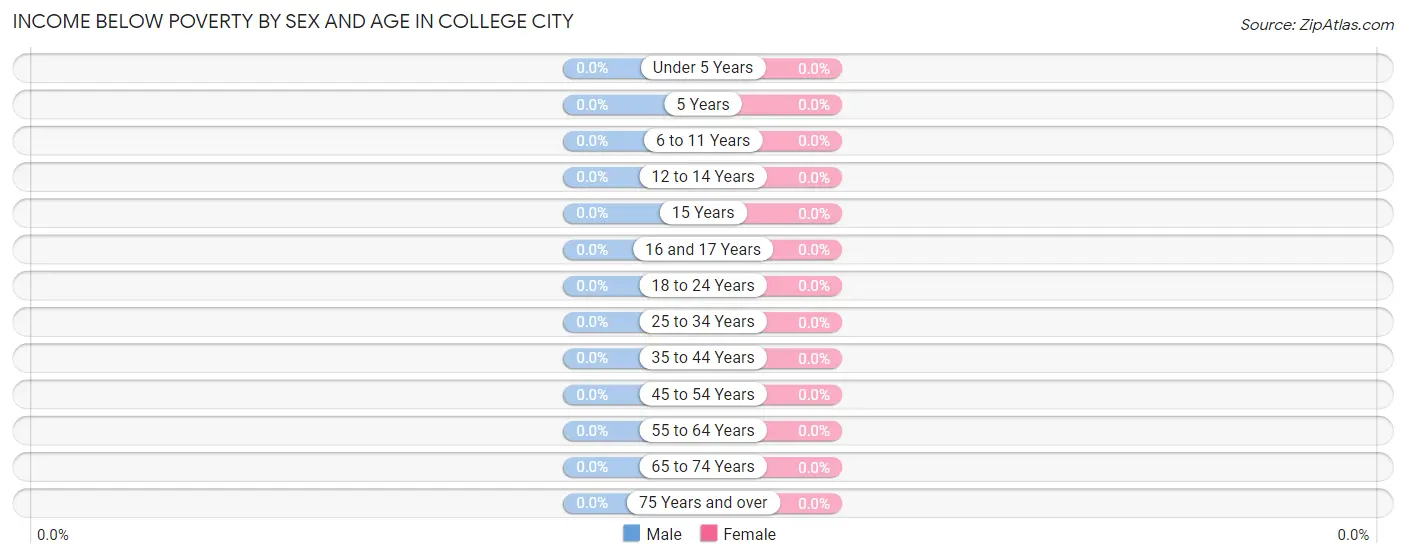
| Age Bracket | Male | Female |
| Under 5 Years | 0 (0.0%) | 0 (0.0%) |
| 5 Years | 0 (0.0%) | 0 (0.0%) |
| 6 to 11 Years | 0 (0.0%) | 0 (0.0%) |
| 12 to 14 Years | 0 (0.0%) | 0 (0.0%) |
| 15 Years | 0 (0.0%) | 0 (0.0%) |
| 16 and 17 Years | 0 (0.0%) | 0 (0.0%) |
| 18 to 24 Years | 0 (0.0%) | 0 (0.0%) |
| 25 to 34 Years | 0 (0.0%) | 0 (0.0%) |
| 35 to 44 Years | 0 (0.0%) | 0 (0.0%) |
| 45 to 54 Years | 0 (0.0%) | 0 (0.0%) |
| 55 to 64 Years | 0 (0.0%) | 0 (0.0%) |
| 65 to 74 Years | 0 (0.0%) | 0 (0.0%) |
| 75 Years and over | 0 (0.0%) | 0 (0.0%) |
| Total | 0 (0.0%) | 0 (0.0%) |
Income Above Poverty by Sex and Age in College City
According to the poverty statistics in College City, males aged 12 to 14 years and females aged under 5 years are the age groups that are most secure financially, with 100.0% of males and 100.0% of females in these age groups living above the poverty line.
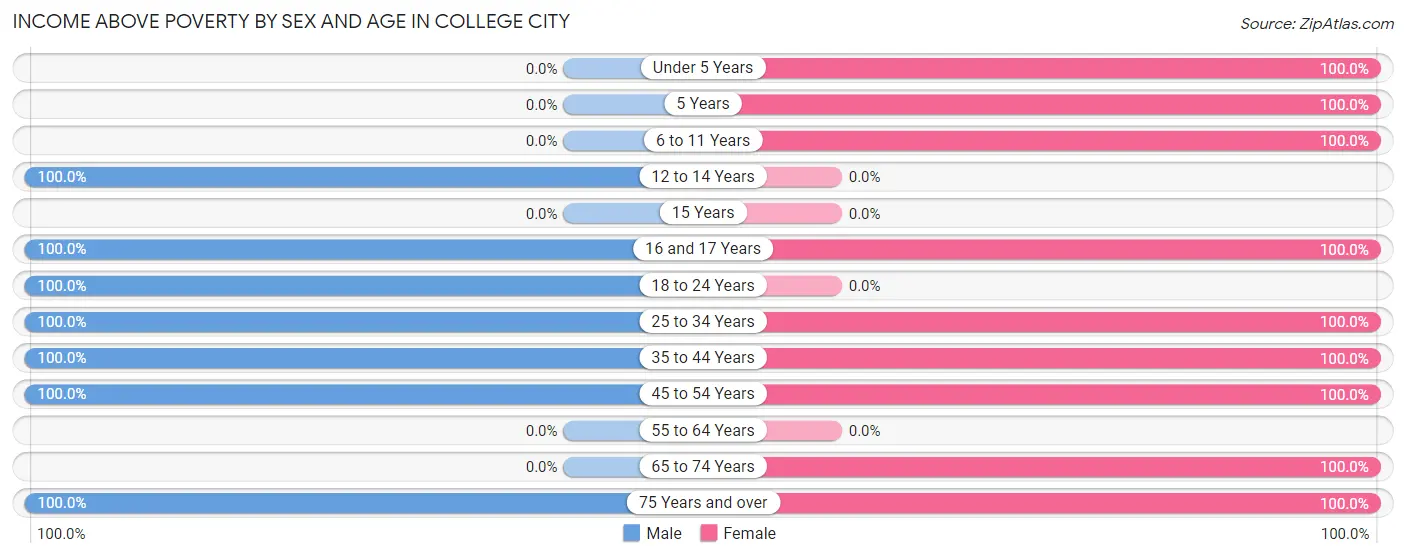
| Age Bracket | Male | Female |
| Under 5 Years | 0 (0.0%) | 19 (100.0%) |
| 5 Years | 0 (0.0%) | 21 (100.0%) |
| 6 to 11 Years | 0 (0.0%) | 38 (100.0%) |
| 12 to 14 Years | 21 (100.0%) | 0 (0.0%) |
| 15 Years | 0 (0.0%) | 0 (0.0%) |
| 16 and 17 Years | 13 (100.0%) | 13 (100.0%) |
| 18 to 24 Years | 23 (100.0%) | 0 (0.0%) |
| 25 to 34 Years | 16 (100.0%) | 18 (100.0%) |
| 35 to 44 Years | 35 (100.0%) | 34 (100.0%) |
| 45 to 54 Years | 24 (100.0%) | 15 (100.0%) |
| 55 to 64 Years | 0 (0.0%) | 0 (0.0%) |
| 65 to 74 Years | 0 (0.0%) | 15 (100.0%) |
| 75 Years and over | 20 (100.0%) | 18 (100.0%) |
| Total | 152 (100.0%) | 191 (100.0%) |
Income Below Poverty Among Married-Couple Families in College City
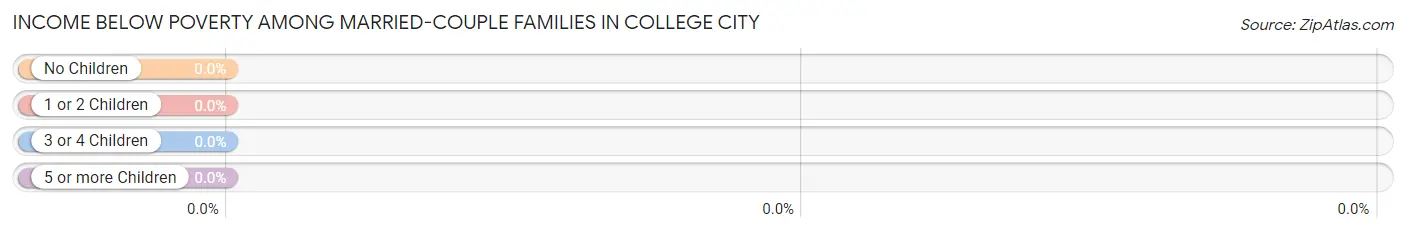
| Children | Above Poverty | Below Poverty |
| No Children | 23 (100.0%) | 0 (0.0%) |
| 1 or 2 Children | 17 (100.0%) | 0 (0.0%) |
| 3 or 4 Children | 32 (100.0%) | 0 (0.0%) |
| 5 or more Children | 0 (0.0%) | 0 (0.0%) |
| Total | 72 (100.0%) | 0 (0.0%) |
Income Below Poverty Among Single-Parent Households in College City
| Children | Single Father | Single Mother |
| No Children | 0 (0.0%) | 0 (0.0%) |
| 1 or 2 Children | 0 (0.0%) | 0 (0.0%) |
| 3 or 4 Children | 0 (0.0%) | 0 (0.0%) |
| 5 or more Children | 0 (0.0%) | 0 (0.0%) |
| Total | 0 (0.0%) | 0 (0.0%) |
Income Below Poverty Among Married-Couple vs Single-Parent Households in College City
| Children | Married-Couple Families | Single-Parent Households |
| No Children | 0 (0.0%) | 0 (0.0%) |
| 1 or 2 Children | 0 (0.0%) | 0 (0.0%) |
| 3 or 4 Children | 0 (0.0%) | 0 (0.0%) |
| 5 or more Children | 0 (0.0%) | 0 (0.0%) |
| Total | 0 (0.0%) | 0 (0.0%) |
Race in College City
The most populous races in College City are White / Caucasian (238 | 69.4%), Hispanic or Latino (204 | 59.5%), and Some other Race (105 | 30.6%).
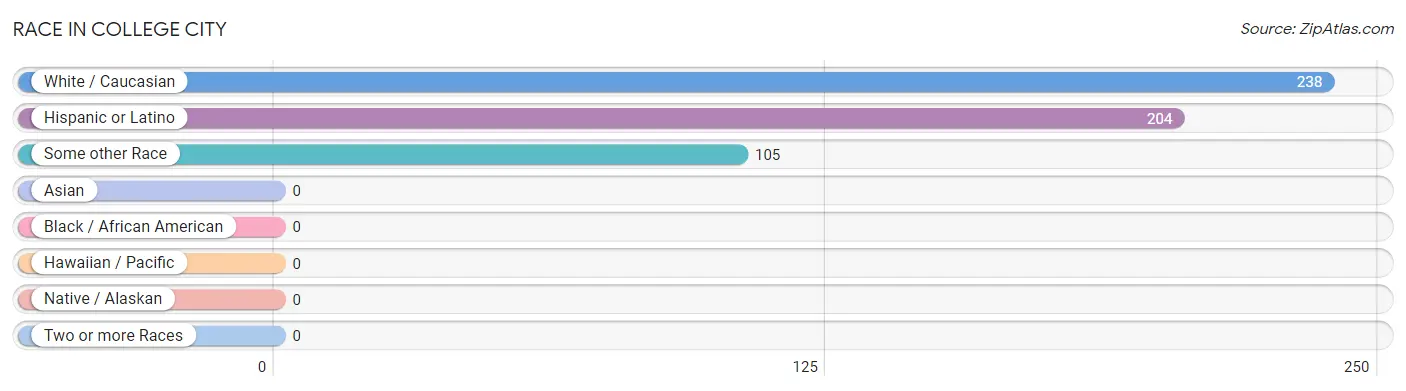
| Race | # Population | % Population |
| Asian | 0 | 0.0% |
| Black / African American | 0 | 0.0% |
| Hawaiian / Pacific | 0 | 0.0% |
| Hispanic or Latino | 204 | 59.5% |
| Native / Alaskan | 0 | 0.0% |
| White / Caucasian | 238 | 69.4% |
| Two or more Races | 0 | 0.0% |
| Some other Race | 105 | 30.6% |
| Total | 343 | 100.0% |
Ancestry in College City
The most populous ancestries reported in College City are Mexican (189 | 55.1%), American (78 | 22.7%), European (34 | 9.9%), German (18 | 5.2%), and English (7 | 2.0%), together accounting for 95.0% of all College City residents.
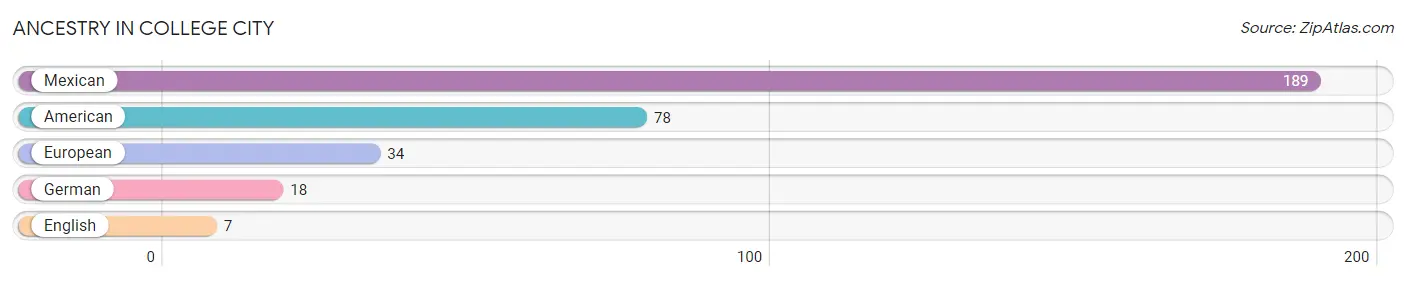
| Ancestry | # Population | % Population |
| American | 78 | 22.7% |
| English | 7 | 2.0% |
| European | 34 | 9.9% |
| German | 18 | 5.2% |
| Mexican | 189 | 55.1% | View All 5 Rows |
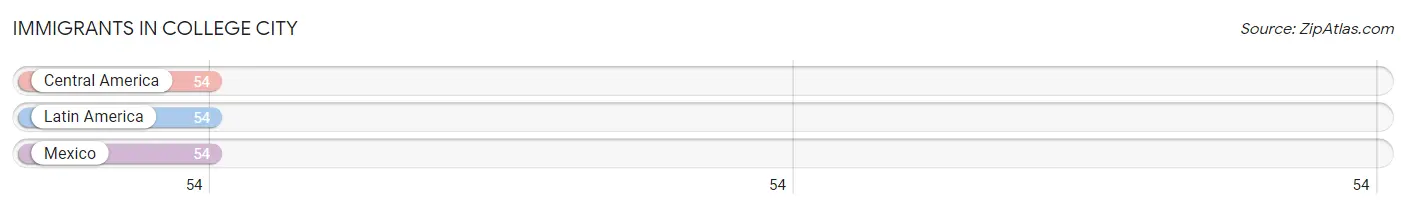
Immigrants in College City
The most numerous immigrant groups reported in College City came from Central America (54 | 15.7%), Latin America (54 | 15.7%), and Mexico (54 | 15.7%), together accounting for 47.2% of all College City residents.
| Immigration Origin | # Population | % Population |
| Central America | 54 | 15.7% |
| Latin America | 54 | 15.7% |
| Mexico | 54 | 15.7% | View All 3 Rows |
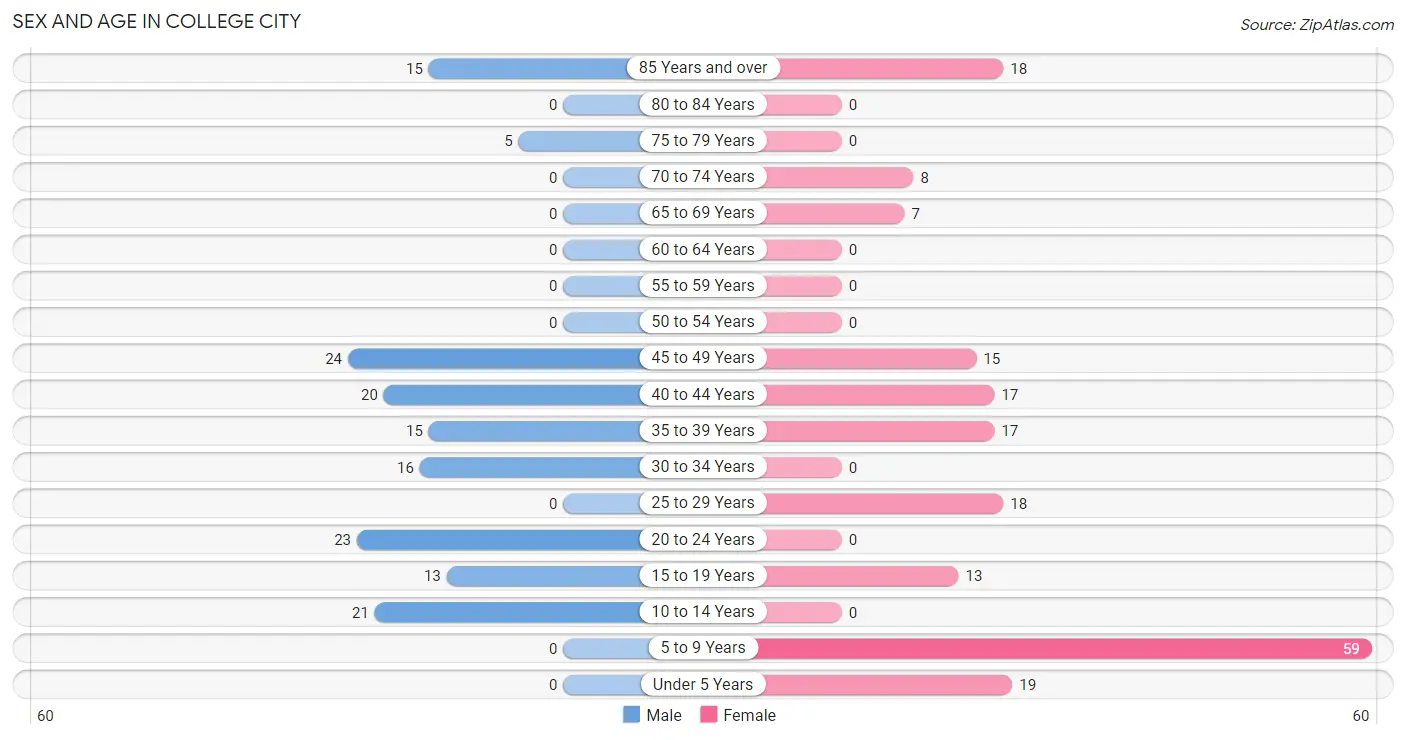
Sex and Age in College City
Sex and Age in College City
The most populous age groups in College City are 45 to 49 Years (24 | 15.8%) for men and 5 to 9 Years (59 | 30.9%) for women.
| Age Bracket | Male | Female |
| Under 5 Years | 0 (0.0%) | 19 (10.0%) |
| 5 to 9 Years | 0 (0.0%) | 59 (30.9%) |
| 10 to 14 Years | 21 (13.8%) | 0 (0.0%) |
| 15 to 19 Years | 13 (8.6%) | 13 (6.8%) |
| 20 to 24 Years | 23 (15.1%) | 0 (0.0%) |
| 25 to 29 Years | 0 (0.0%) | 18 (9.4%) |
| 30 to 34 Years | 16 (10.5%) | 0 (0.0%) |
| 35 to 39 Years | 15 (9.9%) | 17 (8.9%) |
| 40 to 44 Years | 20 (13.2%) | 17 (8.9%) |
| 45 to 49 Years | 24 (15.8%) | 15 (7.9%) |
| 50 to 54 Years | 0 (0.0%) | 0 (0.0%) |
| 55 to 59 Years | 0 (0.0%) | 0 (0.0%) |
| 60 to 64 Years | 0 (0.0%) | 0 (0.0%) |
| 65 to 69 Years | 0 (0.0%) | 7 (3.7%) |
| 70 to 74 Years | 0 (0.0%) | 8 (4.2%) |
| 75 to 79 Years | 5 (3.3%) | 0 (0.0%) |
| 80 to 84 Years | 0 (0.0%) | 0 (0.0%) |
| 85 Years and over | 15 (9.9%) | 18 (9.4%) |
| Total | 152 (100.0%) | 191 (100.0%) |
Families and Households in College City
Median Family Size in College City
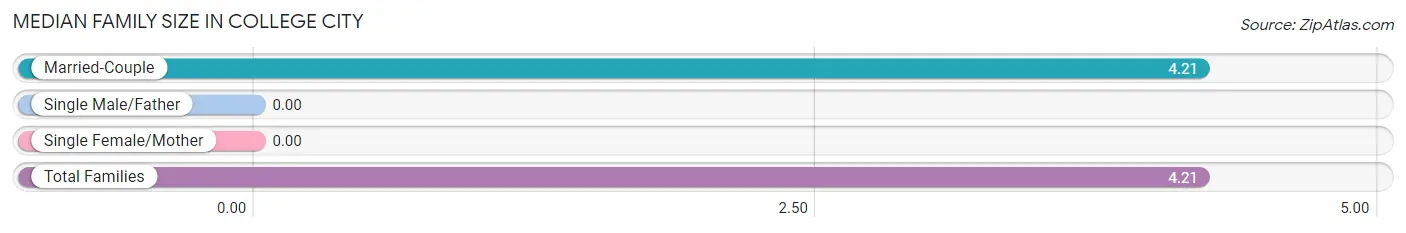
| Family Type | # Families | Family Size |
| Married-Couple | 72 (100.0%) | 4.21 |
| Single Male/Father | 0 (0.0%) | - |
| Single Female/Mother | 0 (0.0%) | - |
| Total Families | 72 (100.0%) | 4.21 |
Median Household Size in College City
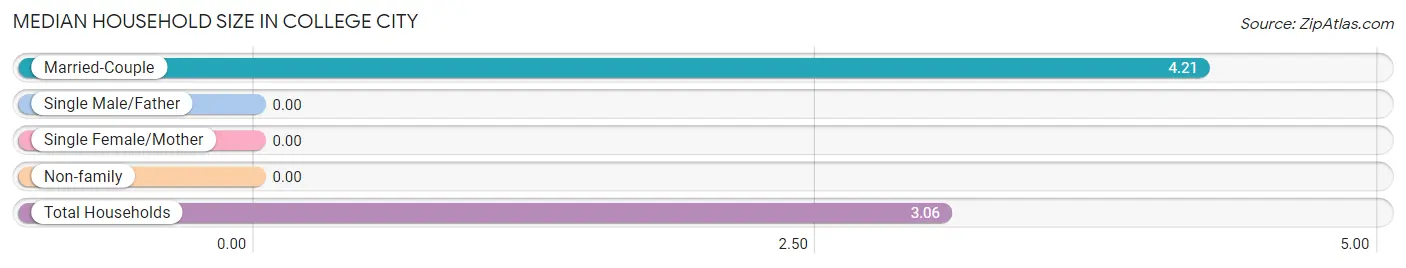
| Household Type | # Households | Household Size |
| Married-Couple | 72 (64.3%) | 4.21 |
| Single Male/Father | 0 (0.0%) | - |
| Single Female/Mother | 0 (0.0%) | - |
| Non-family | 40 (35.7%) | - |
| Total Households | 112 (100.0%) | 3.06 |
Household Size by Marriage Status in College City
Out of a total of 112 households in College City, 72 (64.3%) are family households, while 40 (35.7%) are nonfamily households. The most numerous type of family households are 5-person households, comprising 32, and the most common type of nonfamily households are 1-person households, comprising 40.
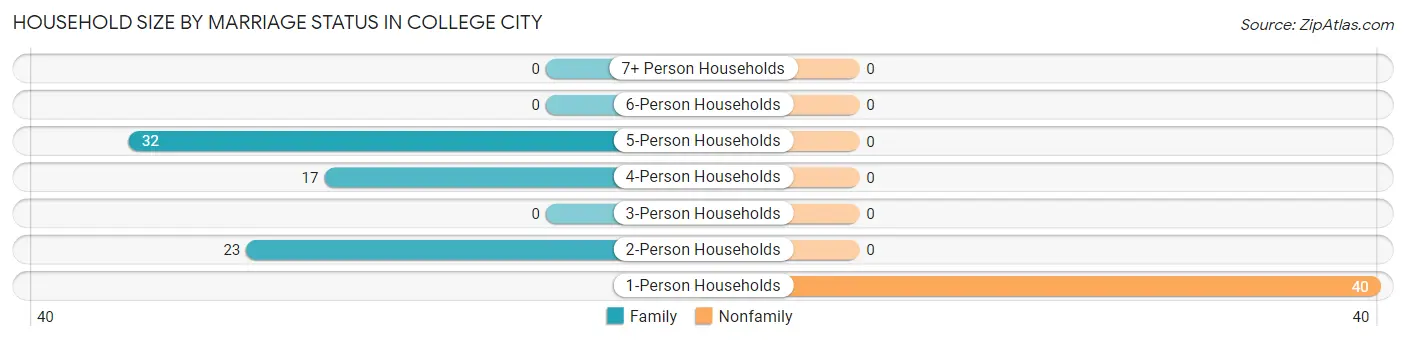
| Household Size | Family Households | Nonfamily Households |
| 1-Person Households | - | 40 (35.7%) |
| 2-Person Households | 23 (20.5%) | 0 (0.0%) |
| 3-Person Households | 0 (0.0%) | 0 (0.0%) |
| 4-Person Households | 17 (15.2%) | 0 (0.0%) |
| 5-Person Households | 32 (28.6%) | 0 (0.0%) |
| 6-Person Households | 0 (0.0%) | 0 (0.0%) |
| 7+ Person Households | 0 (0.0%) | 0 (0.0%) |
| Total | 72 (64.3%) | 40 (35.7%) |
Female Fertility in College City
Fertility by Age in College City
Average fertility rate in College City is 213.0 births per 1,000 women. Women in the age bracket of 35 to 50 years have the highest fertility rate with 347.0 births per 1,000 women. Women in the age bracket of 35 to 50 years acount for 100.0% of all women with births.
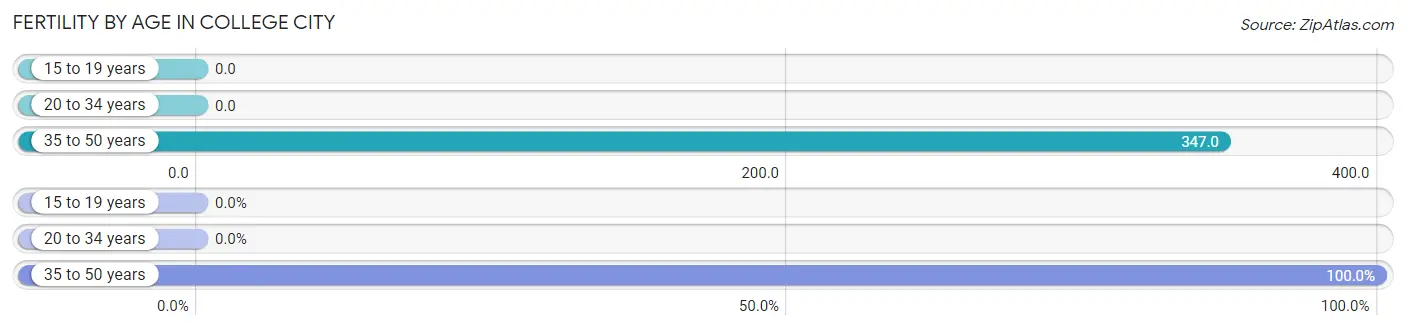
| Age Bracket | Women with Births | Births / 1,000 Women |
| 15 to 19 years | 0 (0.0%) | 0.0 |
| 20 to 34 years | 0 (0.0%) | 0.0 |
| 35 to 50 years | 17 (100.0%) | 347.0 |
| Total | 17 (100.0%) | 213.0 |
Fertility by Age by Marriage Status in College City
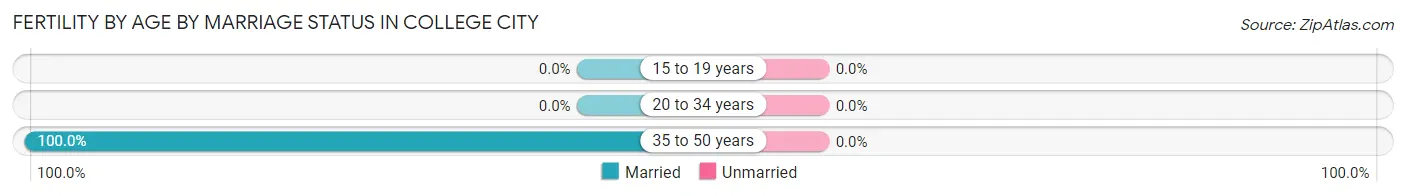
| Age Bracket | Married | Unmarried |
| 15 to 19 years | 0 (0.0%) | 0 (0.0%) |
| 20 to 34 years | 0 (0.0%) | 0 (0.0%) |
| 35 to 50 years | 17 (100.0%) | 0 (0.0%) |
| Total | 17 (100.0%) | 0 (0.0%) |
Fertility by Education in College City
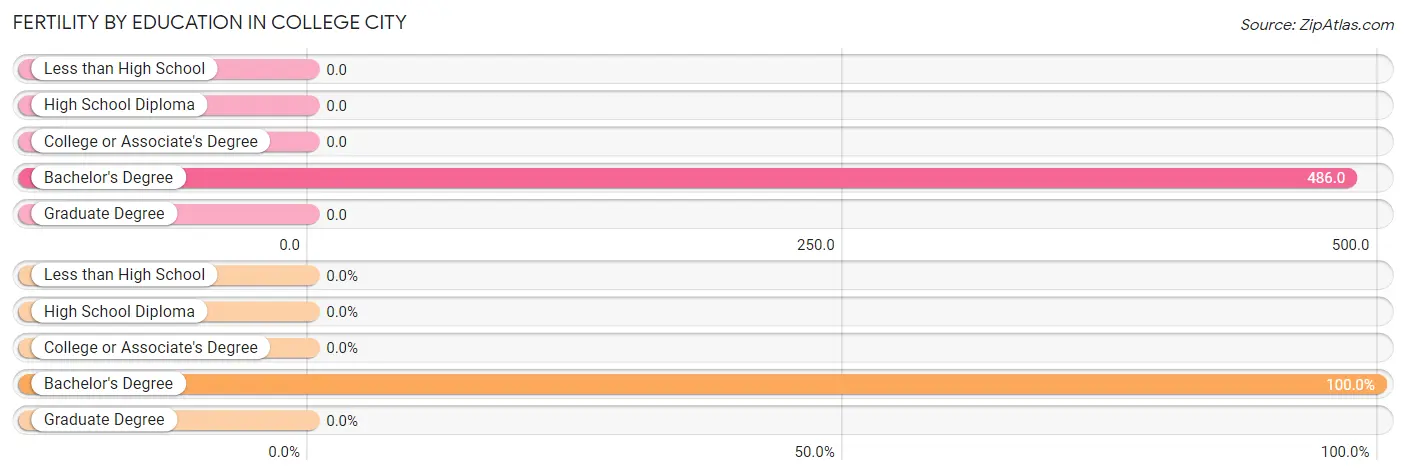
| Educational Attainment | Women with Births | Births / 1,000 Women |
| Less than High School | 0 (0.0%) | 0.0 |
| High School Diploma | 0 (0.0%) | 0.0 |
| College or Associate's Degree | 0 (0.0%) | 0.0 |
| Bachelor's Degree | 17 (100.0%) | 486.0 |
| Graduate Degree | 0 (0.0%) | 0.0 |
| Total | 17 (100.0%) | 213.0 |
Fertility by Education by Marriage Status in College City
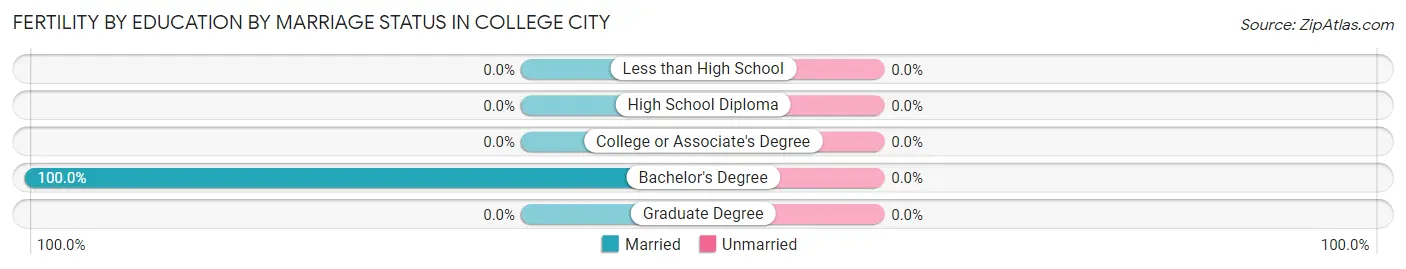
| Educational Attainment | Married | Unmarried |
| Less than High School | 0 (0.0%) | 0 (0.0%) |
| High School Diploma | 0 (0.0%) | 0 (0.0%) |
| College or Associate's Degree | 0 (0.0%) | 0 (0.0%) |
| Bachelor's Degree | 17 (100.0%) | 0 (0.0%) |
| Graduate Degree | 0 (0.0%) | 0 (0.0%) |
| Total | 17 (100.0%) | 0 (0.0%) |
Employment Characteristics in College City
Employment by Class of Employer in College City
Among the 126 employed individuals in College City, private company employees (94 | 74.6%), local government employees (17 | 13.5%), and self-employed (not incorporated) (15 | 11.9%) make up the most common classes of employment.
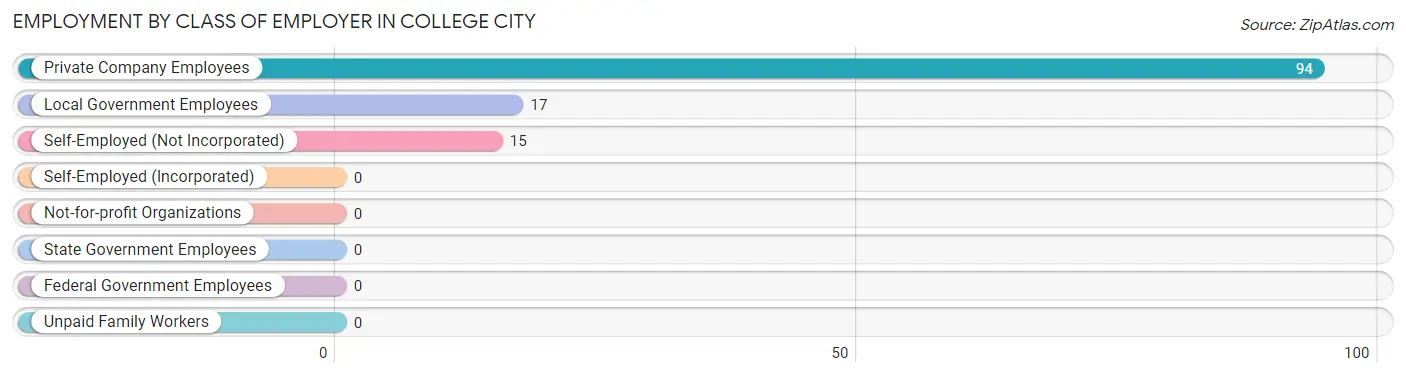
| Employer Class | # Employees | % Employees |
| Private Company Employees | 94 | 74.6% |
| Self-Employed (Incorporated) | 0 | 0.0% |
| Self-Employed (Not Incorporated) | 15 | 11.9% |
| Not-for-profit Organizations | 0 | 0.0% |
| Local Government Employees | 17 | 13.5% |
| State Government Employees | 0 | 0.0% |
| Federal Government Employees | 0 | 0.0% |
| Unpaid Family Workers | 0 | 0.0% |
| Total | 126 | 100.0% |
Employment Status by Age in College City
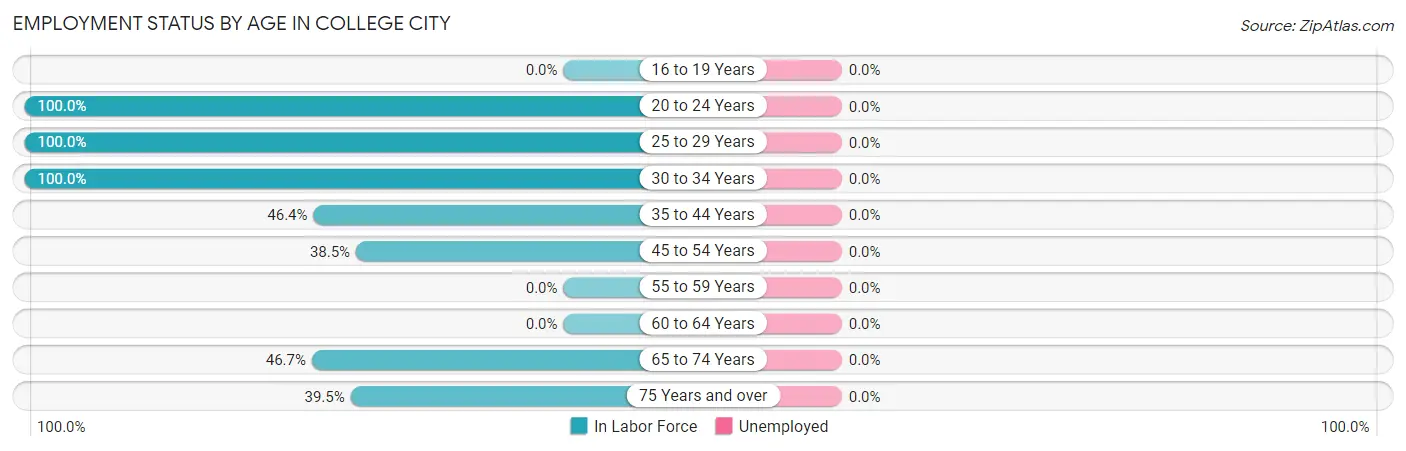
| Age Bracket | In Labor Force | Unemployed |
| 16 to 19 Years | 0 (0.0%) | 0 (0.0%) |
| 20 to 24 Years | 23 (100.0%) | 0 (0.0%) |
| 25 to 29 Years | 18 (100.0%) | 0 (0.0%) |
| 30 to 34 Years | 16 (100.0%) | 0 (0.0%) |
| 35 to 44 Years | 32 (46.4%) | 0 (0.0%) |
| 45 to 54 Years | 15 (38.5%) | 0 (0.0%) |
| 55 to 59 Years | 0 (0.0%) | 0 (0.0%) |
| 60 to 64 Years | 0 (0.0%) | 0 (0.0%) |
| 65 to 74 Years | 7 (46.7%) | 0 (0.0%) |
| 75 Years and over | 15 (39.5%) | 0 (0.0%) |
| Total | 126 (51.6%) | 0 (0.0%) |
Employment Status by Educational Attainment in College City
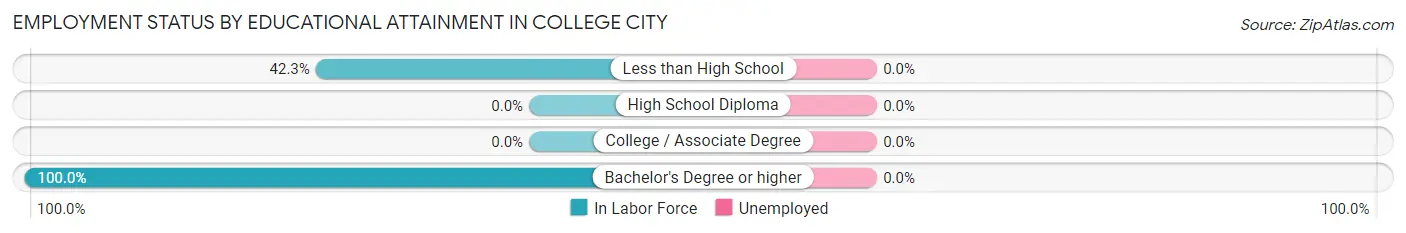
| Educational Attainment | In Labor Force | Unemployed |
| Less than High School | 30 (42.3%) | 0 (0.0%) |
| High School Diploma | 0 (0.0%) | 0 (0.0%) |
| College / Associate Degree | 0 (0.0%) | 0 (0.0%) |
| Bachelor's Degree or higher | 51 (100.0%) | 0 (0.0%) |
| Total | 81 (57.0%) | 0 (0.0%) |
Employment Occupations by Sex in College City
Management, Business, Science and Arts Occupations
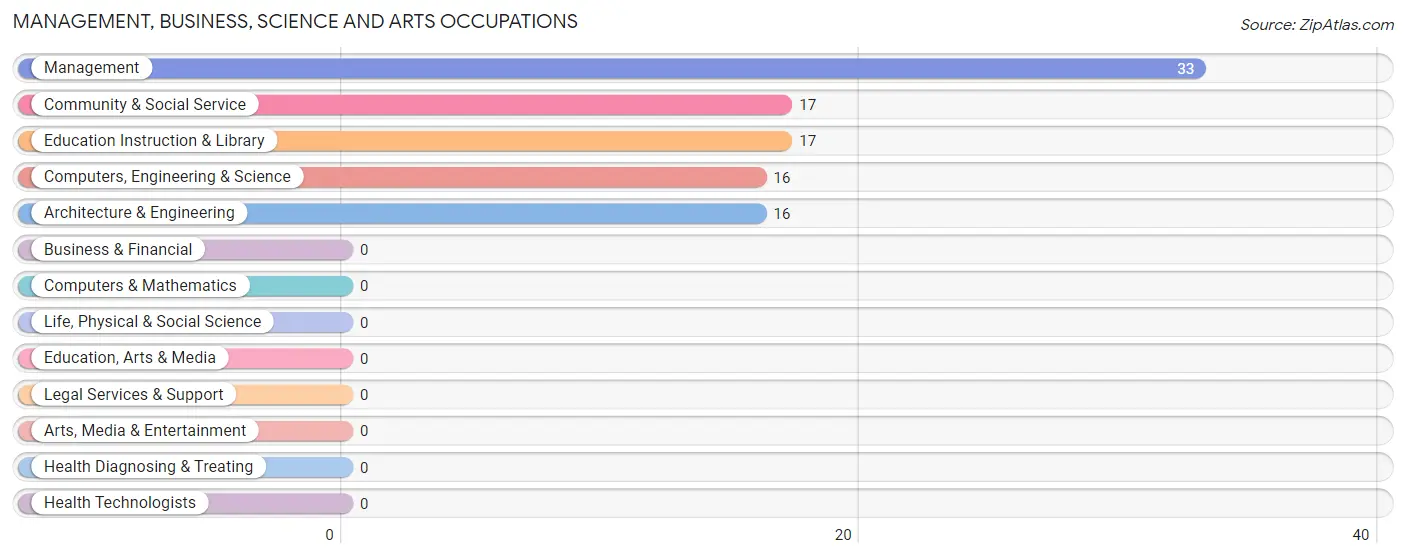
The most common Management, Business, Science and Arts occupations in College City are Management (33 | 26.2%), Community & Social Service (17 | 13.5%), Education Instruction & Library (17 | 13.5%), Computers, Engineering & Science (16 | 12.7%), and Architecture & Engineering (16 | 12.7%).
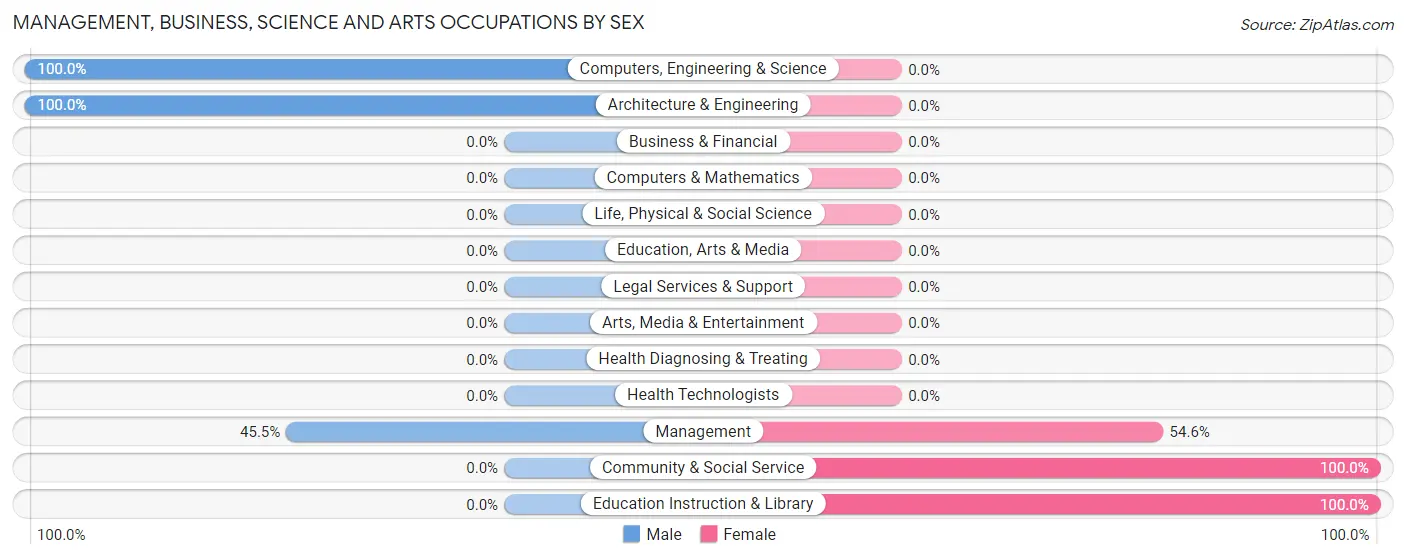
Management, Business, Science and Arts Occupations by Sex
Within the Management, Business, Science and Arts occupations in College City, the most male-oriented occupations are Computers, Engineering & Science (100.0%), Architecture & Engineering (100.0%), and Management (45.5%), while the most female-oriented occupations are Community & Social Service (100.0%), Education Instruction & Library (100.0%), and Management (54.5%).
| Occupation | Male | Female |
| Management | 15 (45.5%) | 18 (54.5%) |
| Business & Financial | 0 (0.0%) | 0 (0.0%) |
| Computers, Engineering & Science | 16 (100.0%) | 0 (0.0%) |
| Computers & Mathematics | 0 (0.0%) | 0 (0.0%) |
| Architecture & Engineering | 16 (100.0%) | 0 (0.0%) |
| Life, Physical & Social Science | 0 (0.0%) | 0 (0.0%) |
| Community & Social Service | 0 (0.0%) | 17 (100.0%) |
| Education, Arts & Media | 0 (0.0%) | 0 (0.0%) |
| Legal Services & Support | 0 (0.0%) | 0 (0.0%) |
| Education Instruction & Library | 0 (0.0%) | 17 (100.0%) |
| Arts, Media & Entertainment | 0 (0.0%) | 0 (0.0%) |
| Health Diagnosing & Treating | 0 (0.0%) | 0 (0.0%) |
| Health Technologists | 0 (0.0%) | 0 (0.0%) |
| Total (Category) | 31 (47.0%) | 35 (53.0%) |
| Total (Overall) | 69 (54.8%) | 57 (45.2%) |
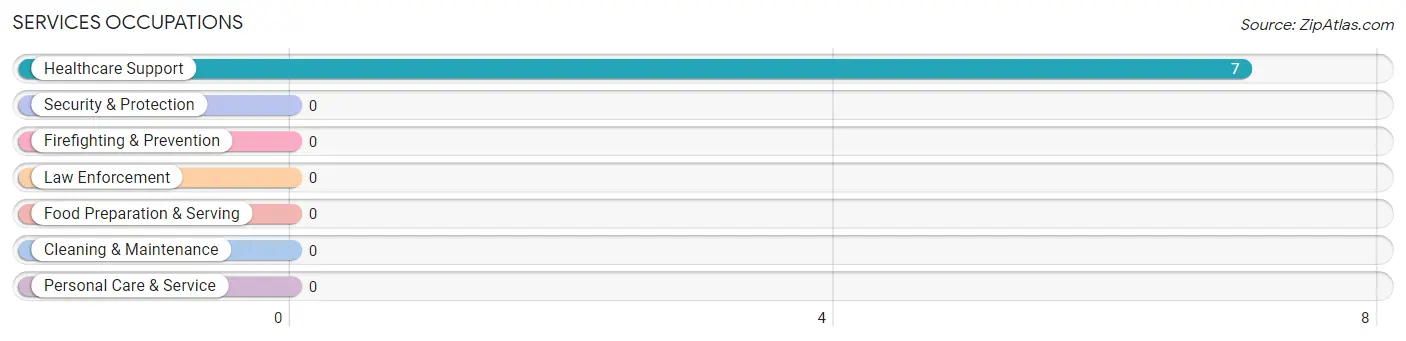
Services Occupations
The most common Services occupations in College City are , and Healthcare Support (7 | 5.6%).
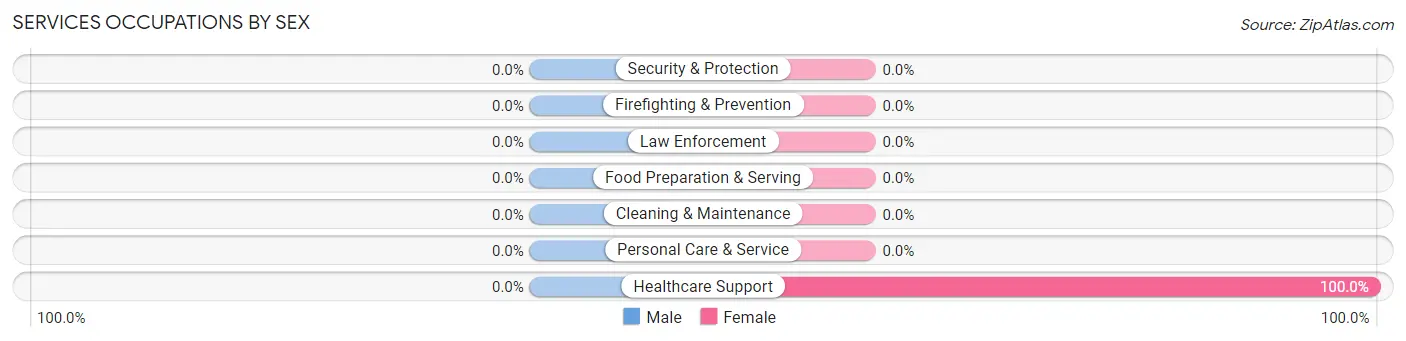
Services Occupations by Sex
| Occupation | Male | Female |
| Healthcare Support | 0 (0.0%) | 7 (100.0%) |
| Security & Protection | 0 (0.0%) | 0 (0.0%) |
| Firefighting & Prevention | 0 (0.0%) | 0 (0.0%) |
| Law Enforcement | 0 (0.0%) | 0 (0.0%) |
| Food Preparation & Serving | 0 (0.0%) | 0 (0.0%) |
| Cleaning & Maintenance | 0 (0.0%) | 0 (0.0%) |
| Personal Care & Service | 0 (0.0%) | 0 (0.0%) |
| Total (Category) | 0 (0.0%) | 7 (100.0%) |
| Total (Overall) | 69 (54.8%) | 57 (45.2%) |
Sales and Office Occupations

Sales and Office Occupations by Sex
| Occupation | Male | Female |
| Sales & Related | 0 (0.0%) | 0 (0.0%) |
| Office & Administration | 0 (0.0%) | 0 (0.0%) |
| Total (Category) | 0 (0.0%) | 0 (0.0%) |
| Total (Overall) | 69 (54.8%) | 57 (45.2%) |
Natural Resources, Construction and Maintenance Occupations
The most common Natural Resources, Construction and Maintenance occupations in College City are Installation, Maintenance & Repair (23 | 18.2%), and Farming, Fishing & Forestry (15 | 11.9%).
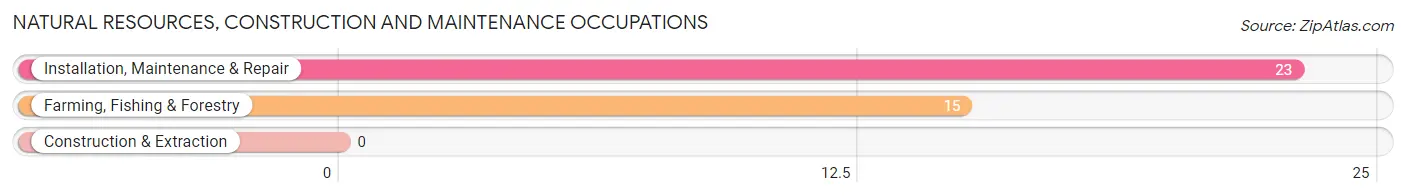
Natural Resources, Construction and Maintenance Occupations by Sex

| Occupation | Male | Female |
| Farming, Fishing & Forestry | 0 (0.0%) | 15 (100.0%) |
| Construction & Extraction | 0 (0.0%) | 0 (0.0%) |
| Installation, Maintenance & Repair | 23 (100.0%) | 0 (0.0%) |
| Total (Category) | 23 (60.5%) | 15 (39.5%) |
| Total (Overall) | 69 (54.8%) | 57 (45.2%) |
Production, Transportation and Moving Occupations
The most common Production, Transportation and Moving occupations in College City are , and Production (15 | 11.9%).
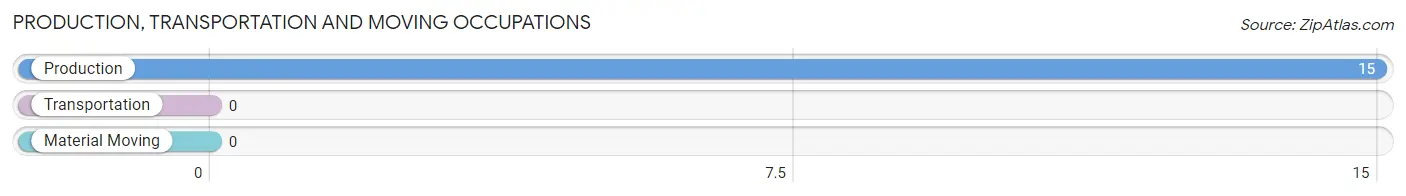
Production, Transportation and Moving Occupations by Sex
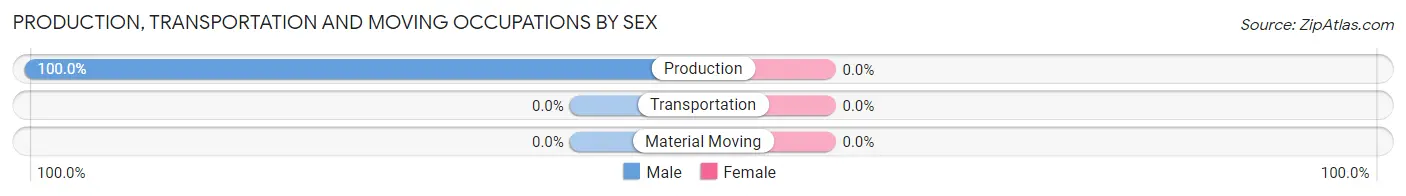
| Occupation | Male | Female |
| Production | 15 (100.0%) | 0 (0.0%) |
| Transportation | 0 (0.0%) | 0 (0.0%) |
| Material Moving | 0 (0.0%) | 0 (0.0%) |
| Total (Category) | 15 (100.0%) | 0 (0.0%) |
| Total (Overall) | 69 (54.8%) | 57 (45.2%) |
Employment Industries by Sex in College City
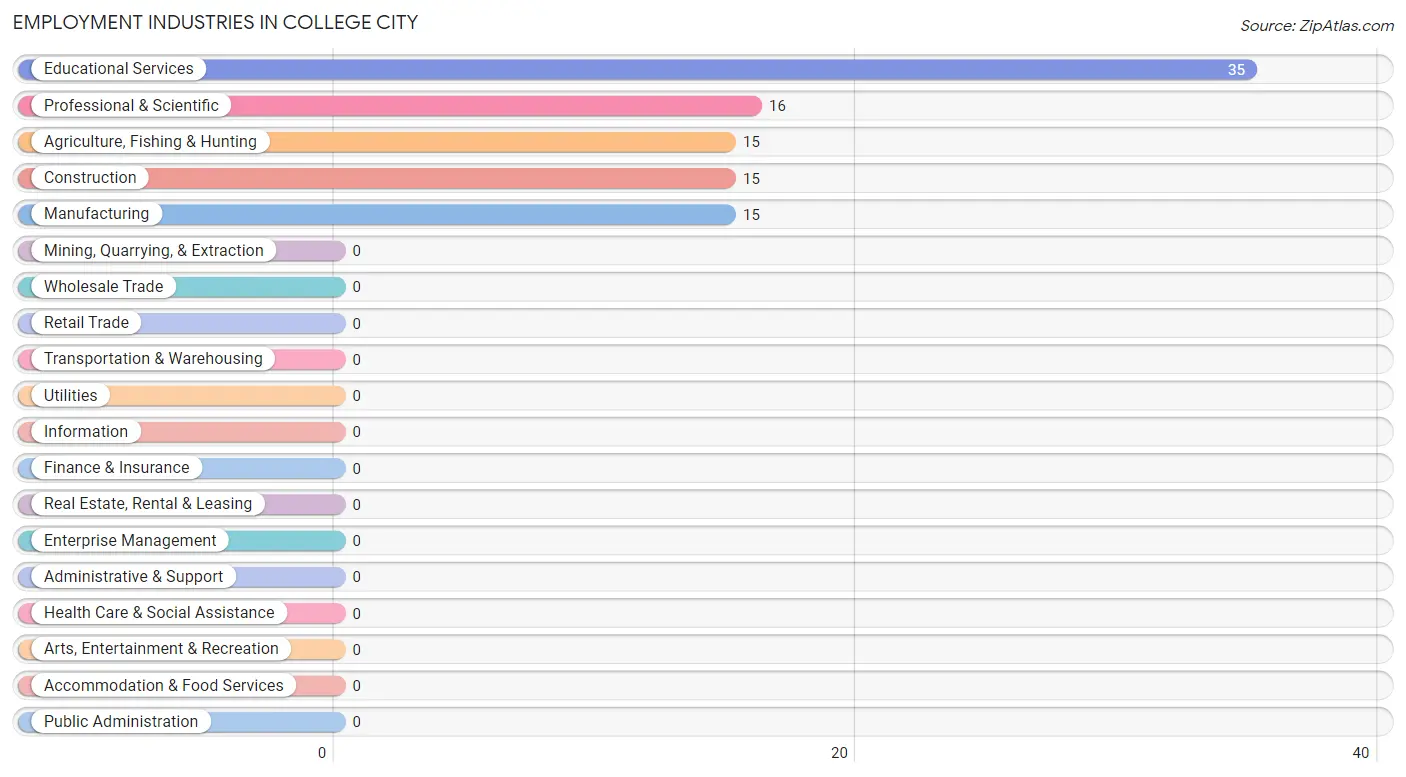
Employment Industries in College City
The major employment industries in College City include Educational Services (35 | 27.8%), Professional & Scientific (16 | 12.7%), Agriculture, Fishing & Hunting (15 | 11.9%), Construction (15 | 11.9%), and Manufacturing (15 | 11.9%).
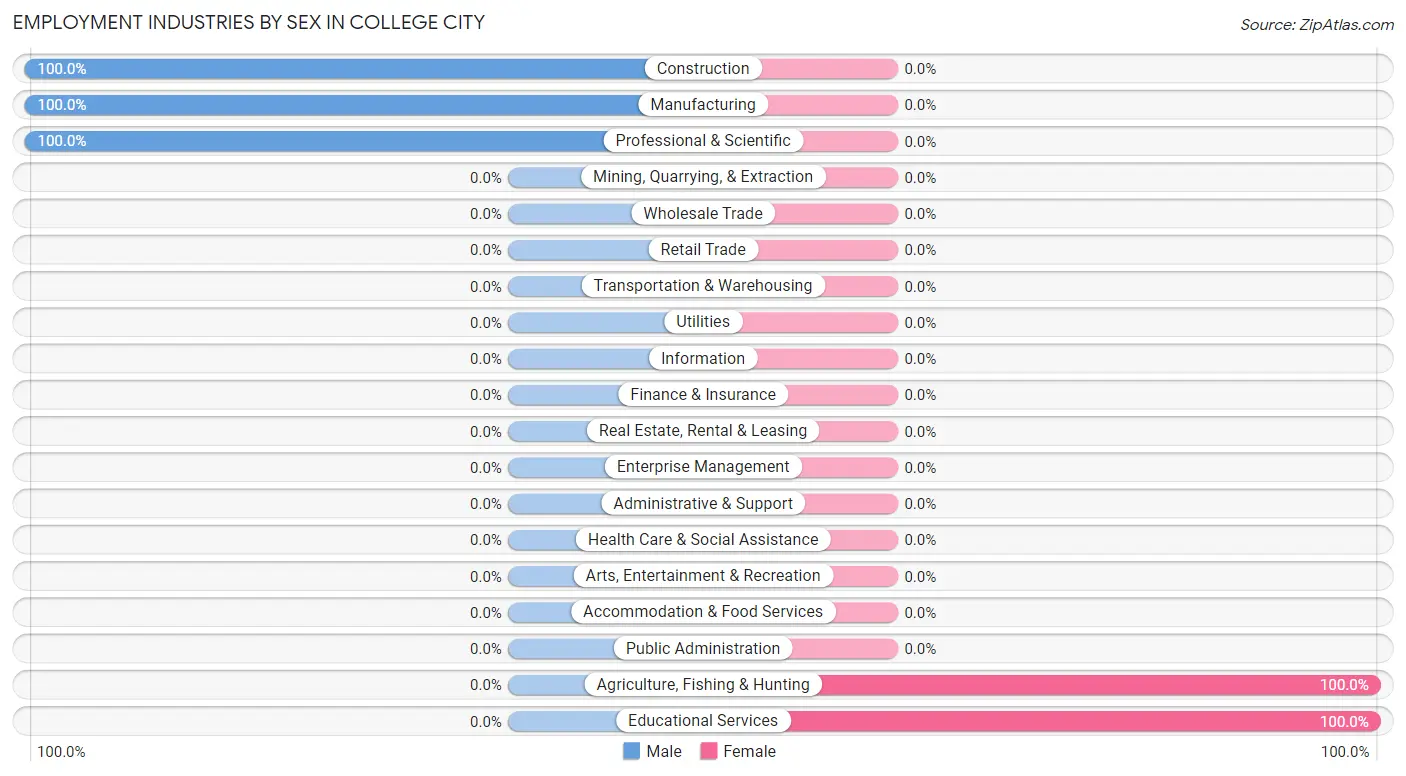
Employment Industries by Sex in College City
The College City industries that see more men than women are Construction (100.0%), Manufacturing (100.0%), and Professional & Scientific (100.0%), whereas the industries that tend to have a higher number of women are Agriculture, Fishing & Hunting (100.0%), and Educational Services (100.0%).
| Industry | Male | Female |
| Agriculture, Fishing & Hunting | 0 (0.0%) | 15 (100.0%) |
| Mining, Quarrying, & Extraction | 0 (0.0%) | 0 (0.0%) |
| Construction | 15 (100.0%) | 0 (0.0%) |
| Manufacturing | 15 (100.0%) | 0 (0.0%) |
| Wholesale Trade | 0 (0.0%) | 0 (0.0%) |
| Retail Trade | 0 (0.0%) | 0 (0.0%) |
| Transportation & Warehousing | 0 (0.0%) | 0 (0.0%) |
| Utilities | 0 (0.0%) | 0 (0.0%) |
| Information | 0 (0.0%) | 0 (0.0%) |
| Finance & Insurance | 0 (0.0%) | 0 (0.0%) |
| Real Estate, Rental & Leasing | 0 (0.0%) | 0 (0.0%) |
| Professional & Scientific | 16 (100.0%) | 0 (0.0%) |
| Enterprise Management | 0 (0.0%) | 0 (0.0%) |
| Administrative & Support | 0 (0.0%) | 0 (0.0%) |
| Educational Services | 0 (0.0%) | 35 (100.0%) |
| Health Care & Social Assistance | 0 (0.0%) | 0 (0.0%) |
| Arts, Entertainment & Recreation | 0 (0.0%) | 0 (0.0%) |
| Accommodation & Food Services | 0 (0.0%) | 0 (0.0%) |
| Public Administration | 0 (0.0%) | 0 (0.0%) |
| Total | 69 (54.8%) | 57 (45.2%) |
Education in College City
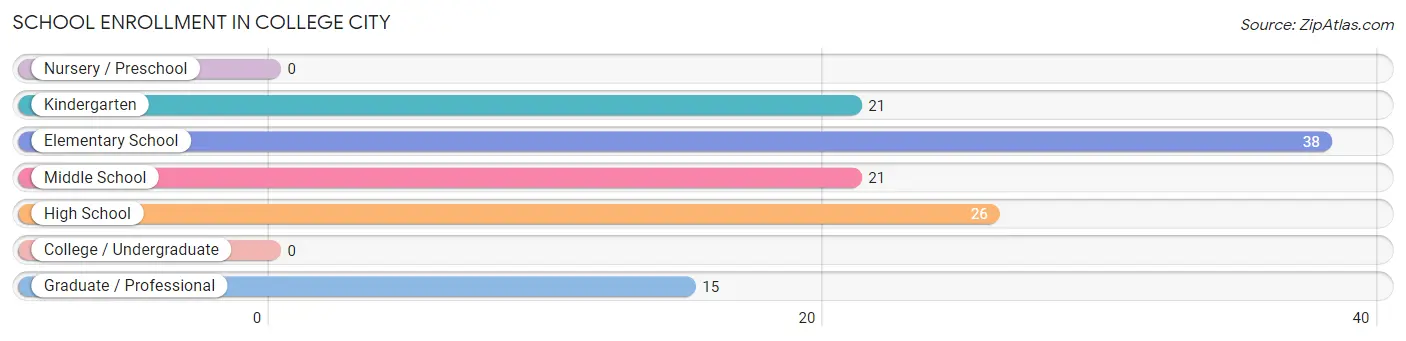
School Enrollment in College City
The most common levels of schooling among the 121 students in College City are elementary school (38 | 31.4%), high school (26 | 21.5%), and kindergarten (21 | 17.4%).
| School Level | # Students | % Students |
| Nursery / Preschool | 0 | 0.0% |
| Kindergarten | 21 | 17.4% |
| Elementary School | 38 | 31.4% |
| Middle School | 21 | 17.4% |
| High School | 26 | 21.5% |
| College / Undergraduate | 0 | 0.0% |
| Graduate / Professional | 15 | 12.4% |
| Total | 121 | 100.0% |
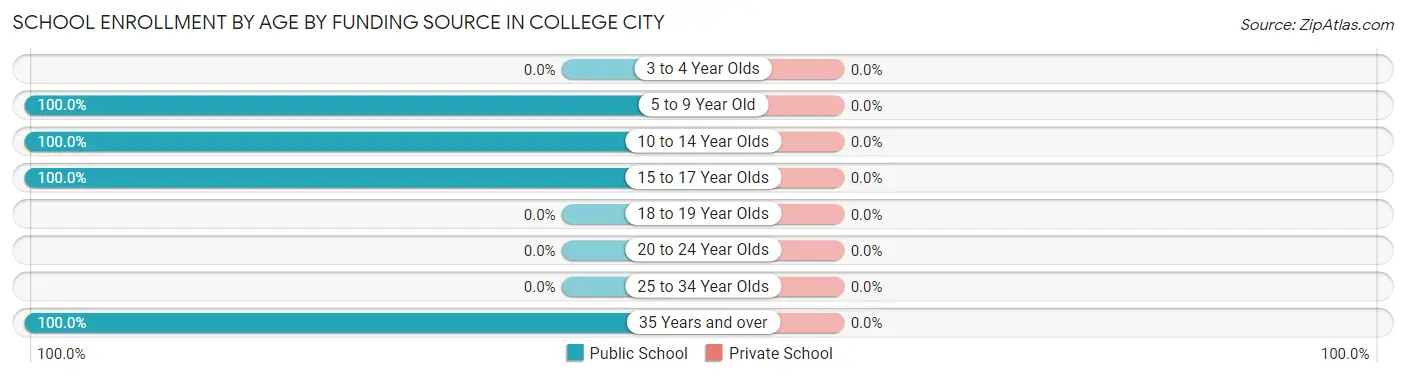
School Enrollment by Age by Funding Source in College City
| Age Bracket | Public School | Private School |
| 3 to 4 Year Olds | 0 (0.0%) | 0 (0.0%) |
| 5 to 9 Year Old | 59 (100.0%) | 0 (0.0%) |
| 10 to 14 Year Olds | 21 (100.0%) | 0 (0.0%) |
| 15 to 17 Year Olds | 26 (100.0%) | 0 (0.0%) |
| 18 to 19 Year Olds | 0 (0.0%) | 0 (0.0%) |
| 20 to 24 Year Olds | 0 (0.0%) | 0 (0.0%) |
| 25 to 34 Year Olds | 0 (0.0%) | 0 (0.0%) |
| 35 Years and over | 15 (100.0%) | 0 (0.0%) |
| Total | 121 (100.0%) | 0 (0.0%) |
Educational Attainment by Field of Study in College City
Bio, nature & agricultural (18 | 26.5%), social sciences (17 | 25.0%), education (17 | 25.0%), and engineering (16 | 23.5%) are the most common fields of study among 68 individuals in College City who have obtained a bachelor's degree or higher.
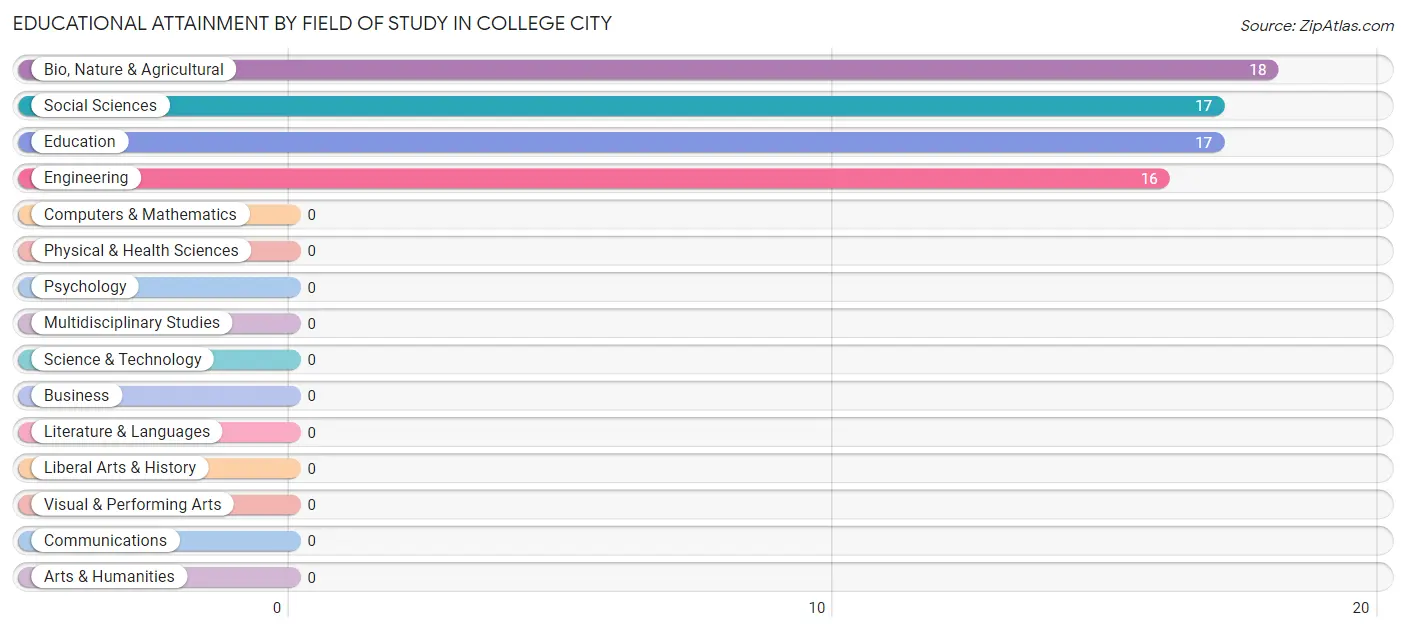
| Field of Study | # Graduates | % Graduates |
| Computers & Mathematics | 0 | 0.0% |
| Bio, Nature & Agricultural | 18 | 26.5% |
| Physical & Health Sciences | 0 | 0.0% |
| Psychology | 0 | 0.0% |
| Social Sciences | 17 | 25.0% |
| Engineering | 16 | 23.5% |
| Multidisciplinary Studies | 0 | 0.0% |
| Science & Technology | 0 | 0.0% |
| Business | 0 | 0.0% |
| Education | 17 | 25.0% |
| Literature & Languages | 0 | 0.0% |
| Liberal Arts & History | 0 | 0.0% |
| Visual & Performing Arts | 0 | 0.0% |
| Communications | 0 | 0.0% |
| Arts & Humanities | 0 | 0.0% |
| Total | 68 | 100.0% |
Transportation & Commute in College City
Vehicle Availability by Sex in College City
The most prevalent vehicle ownership categories in College City are males with 5 or more vehicles (23, accounting for 33.3%) and females with 5 or more vehicles (0, making up 40.4%).
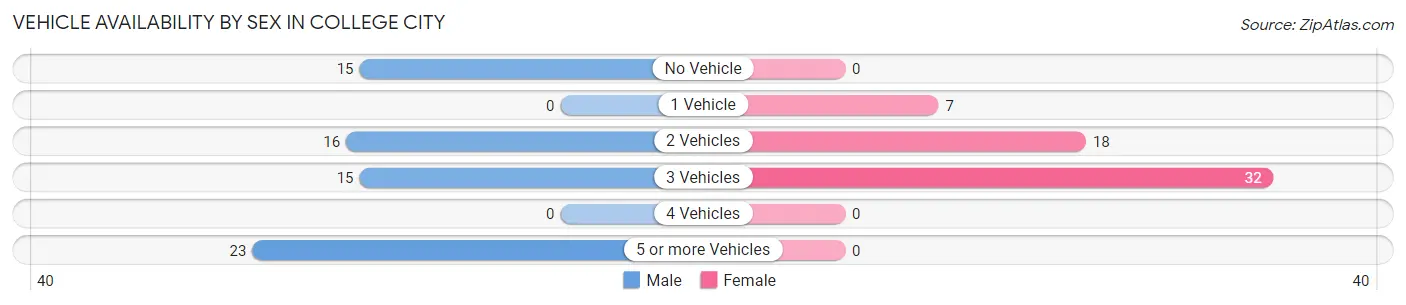
| Vehicles Available | Male | Female |
| No Vehicle | 15 (21.7%) | 0 (0.0%) |
| 1 Vehicle | 0 (0.0%) | 7 (12.3%) |
| 2 Vehicles | 16 (23.2%) | 18 (31.6%) |
| 3 Vehicles | 15 (21.7%) | 32 (56.1%) |
| 4 Vehicles | 0 (0.0%) | 0 (0.0%) |
| 5 or more Vehicles | 23 (33.3%) | 0 (0.0%) |
| Total | 69 (100.0%) | 57 (100.0%) |
Commute Time in College City
The most frequently occuring commute durations in College City are 40 to 44 minutes (48 commuters, 38.1%), 20 to 24 minutes (40 commuters, 31.8%), and 15 to 19 minutes (16 commuters, 12.7%).
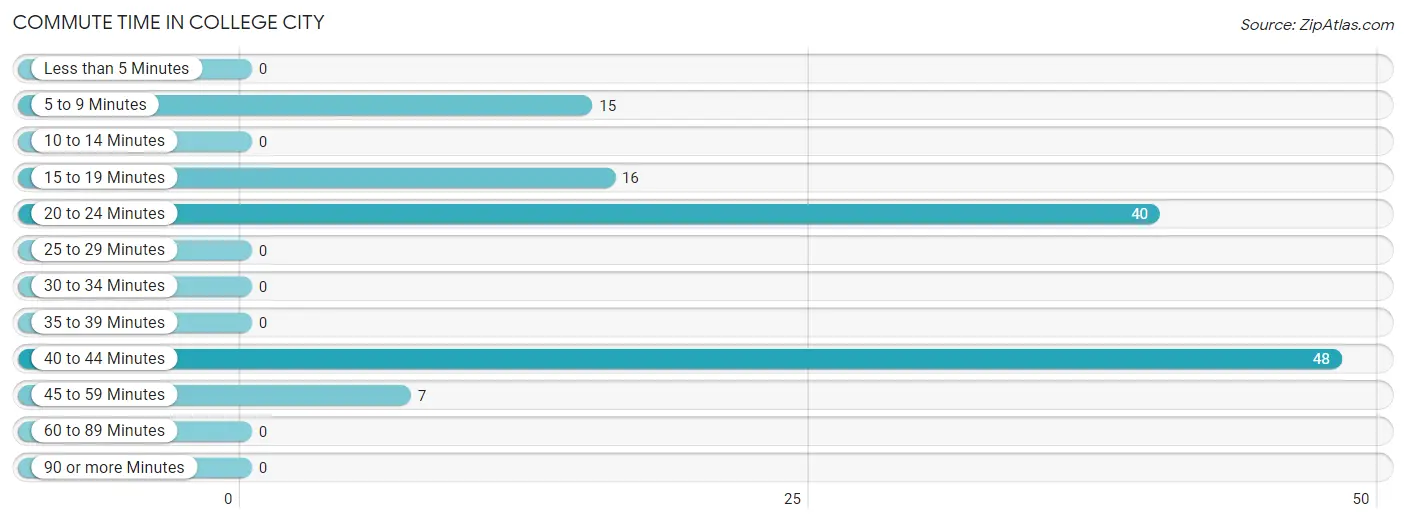
| Commute Time | # Commuters | % Commuters |
| Less than 5 Minutes | 0 | 0.0% |
| 5 to 9 Minutes | 15 | 11.9% |
| 10 to 14 Minutes | 0 | 0.0% |
| 15 to 19 Minutes | 16 | 12.7% |
| 20 to 24 Minutes | 40 | 31.8% |
| 25 to 29 Minutes | 0 | 0.0% |
| 30 to 34 Minutes | 0 | 0.0% |
| 35 to 39 Minutes | 0 | 0.0% |
| 40 to 44 Minutes | 48 | 38.1% |
| 45 to 59 Minutes | 7 | 5.6% |
| 60 to 89 Minutes | 0 | 0.0% |
| 90 or more Minutes | 0 | 0.0% |
Commute Time by Sex in College City
The most common commute times in College City are 20 to 24 minutes (23 commuters, 33.3%) for males and 40 to 44 minutes (33 commuters, 57.9%) for females.
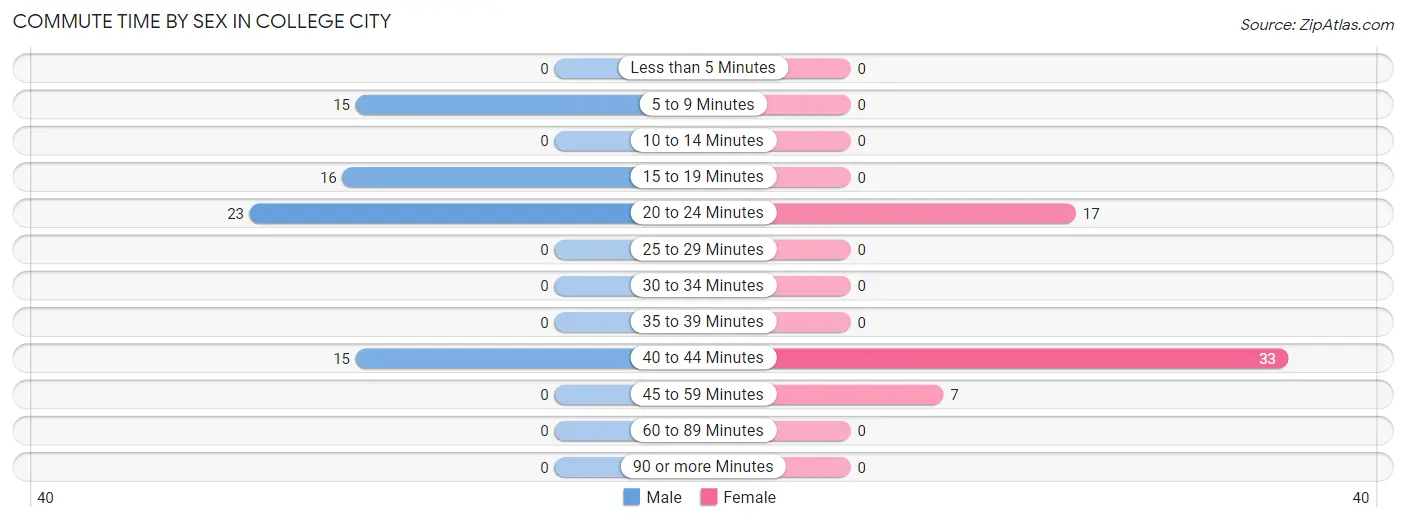
| Commute Time | Male | Female |
| Less than 5 Minutes | 0 (0.0%) | 0 (0.0%) |
| 5 to 9 Minutes | 15 (21.7%) | 0 (0.0%) |
| 10 to 14 Minutes | 0 (0.0%) | 0 (0.0%) |
| 15 to 19 Minutes | 16 (23.2%) | 0 (0.0%) |
| 20 to 24 Minutes | 23 (33.3%) | 17 (29.8%) |
| 25 to 29 Minutes | 0 (0.0%) | 0 (0.0%) |
| 30 to 34 Minutes | 0 (0.0%) | 0 (0.0%) |
| 35 to 39 Minutes | 0 (0.0%) | 0 (0.0%) |
| 40 to 44 Minutes | 15 (21.7%) | 33 (57.9%) |
| 45 to 59 Minutes | 0 (0.0%) | 7 (12.3%) |
| 60 to 89 Minutes | 0 (0.0%) | 0 (0.0%) |
| 90 or more Minutes | 0 (0.0%) | 0 (0.0%) |
Time of Departure to Work by Sex in College City
The most frequent times of departure to work in College City are 6:30 AM to 6:59 AM (23, 33.3%) for males and 7:00 AM to 7:29 AM (18, 31.6%) for females.
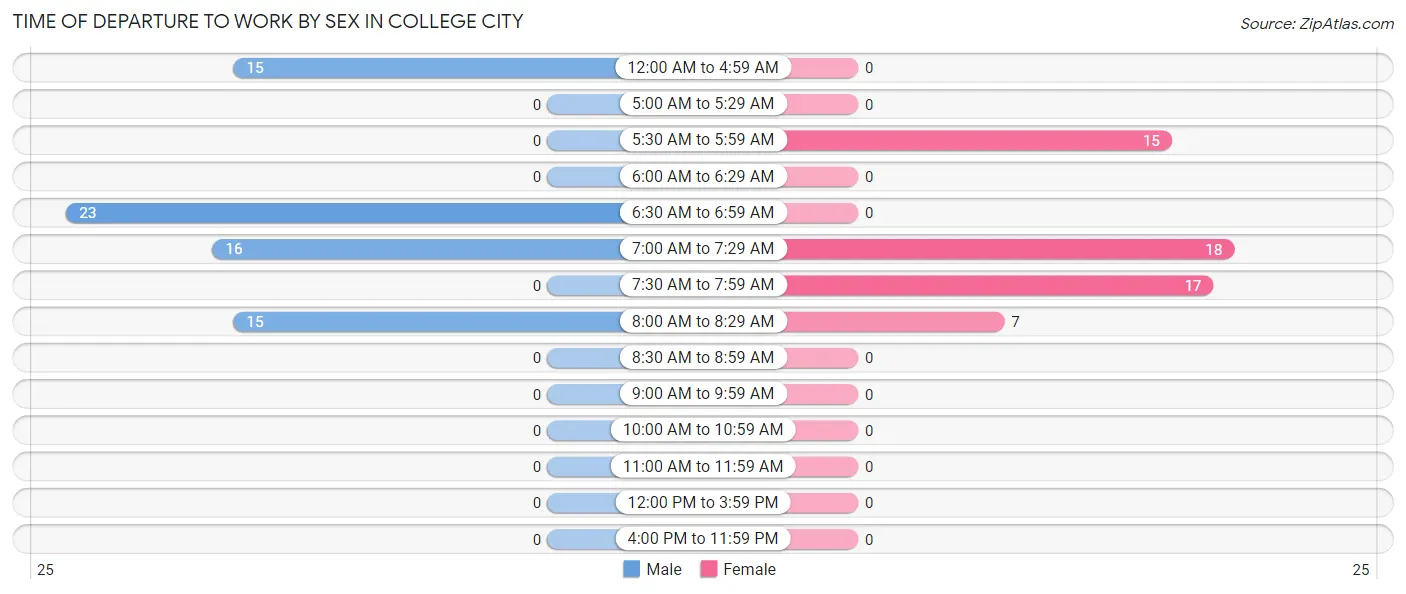
| Time of Departure | Male | Female |
| 12:00 AM to 4:59 AM | 15 (21.7%) | 0 (0.0%) |
| 5:00 AM to 5:29 AM | 0 (0.0%) | 0 (0.0%) |
| 5:30 AM to 5:59 AM | 0 (0.0%) | 15 (26.3%) |
| 6:00 AM to 6:29 AM | 0 (0.0%) | 0 (0.0%) |
| 6:30 AM to 6:59 AM | 23 (33.3%) | 0 (0.0%) |
| 7:00 AM to 7:29 AM | 16 (23.2%) | 18 (31.6%) |
| 7:30 AM to 7:59 AM | 0 (0.0%) | 17 (29.8%) |
| 8:00 AM to 8:29 AM | 15 (21.7%) | 7 (12.3%) |
| 8:30 AM to 8:59 AM | 0 (0.0%) | 0 (0.0%) |
| 9:00 AM to 9:59 AM | 0 (0.0%) | 0 (0.0%) |
| 10:00 AM to 10:59 AM | 0 (0.0%) | 0 (0.0%) |
| 11:00 AM to 11:59 AM | 0 (0.0%) | 0 (0.0%) |
| 12:00 PM to 3:59 PM | 0 (0.0%) | 0 (0.0%) |
| 4:00 PM to 11:59 PM | 0 (0.0%) | 0 (0.0%) |
| Total | 69 (100.0%) | 57 (100.0%) |
Housing Occupancy in College City
Occupancy by Ownership in College City
Of the total 112 dwellings in College City, owner-occupied units account for 75 (67.0%), while renter-occupied units make up 37 (33.0%).
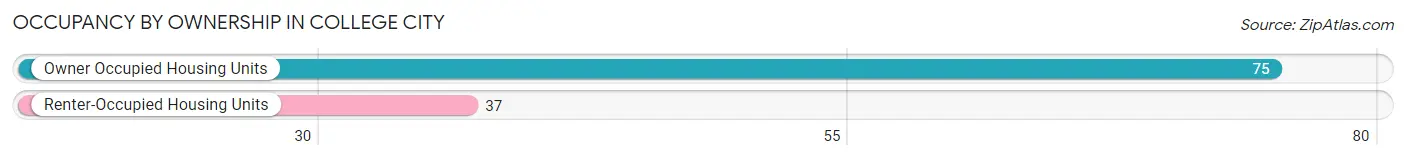
| Occupancy | # Housing Units | % Housing Units |
| Owner Occupied Housing Units | 75 | 67.0% |
| Renter-Occupied Housing Units | 37 | 33.0% |
| Total Occupied Housing Units | 112 | 100.0% |
Occupancy by Household Size in College City
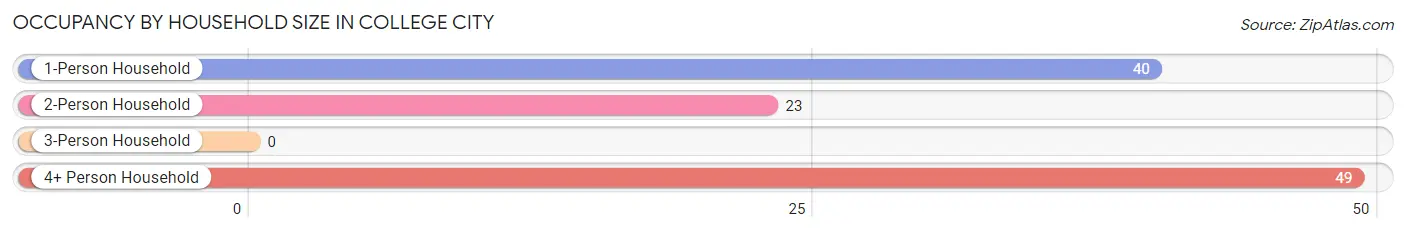
| Household Size | # Housing Units | % Housing Units |
| 1-Person Household | 40 | 35.7% |
| 2-Person Household | 23 | 20.5% |
| 3-Person Household | 0 | 0.0% |
| 4+ Person Household | 49 | 43.8% |
| Total Housing Units | 112 | 100.0% |
Occupancy by Ownership by Household Size in College City
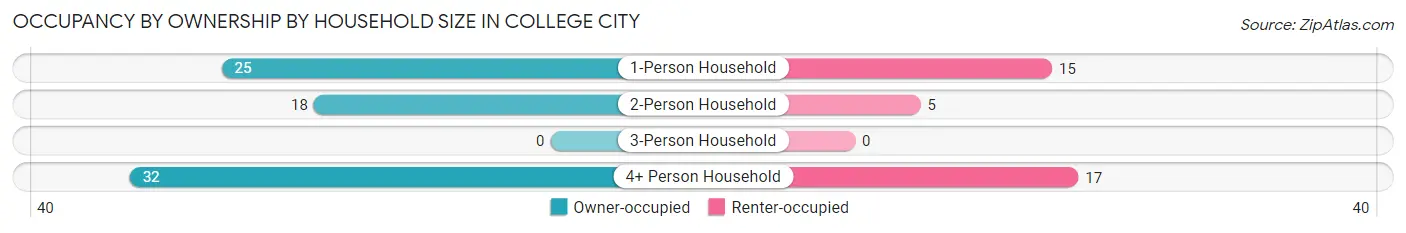
| Household Size | Owner-occupied | Renter-occupied |
| 1-Person Household | 25 (62.5%) | 15 (37.5%) |
| 2-Person Household | 18 (78.3%) | 5 (21.7%) |
| 3-Person Household | 0 (0.0%) | 0 (0.0%) |
| 4+ Person Household | 32 (65.3%) | 17 (34.7%) |
| Total Housing Units | 75 (67.0%) | 37 (33.0%) |
Occupancy by Educational Attainment in College City
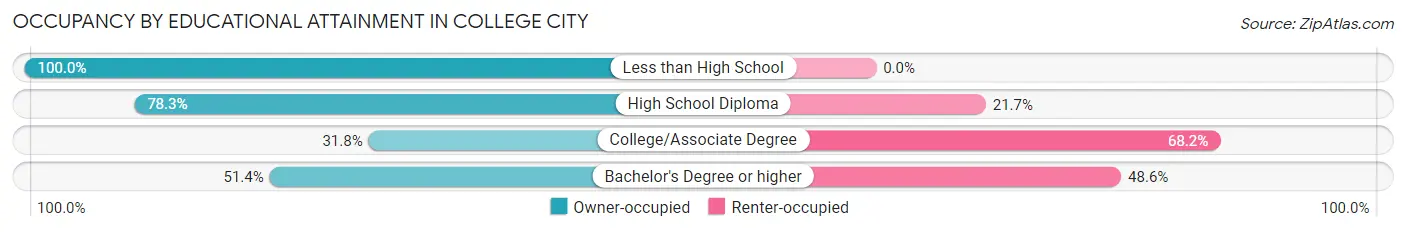
| Household Size | Owner-occupied | Renter-occupied |
| Less than High School | 32 (100.0%) | 0 (0.0%) |
| High School Diploma | 18 (78.3%) | 5 (21.7%) |
| College/Associate Degree | 7 (31.8%) | 15 (68.2%) |
| Bachelor's Degree or higher | 18 (51.4%) | 17 (48.6%) |
Occupancy by Age of Householder in College City
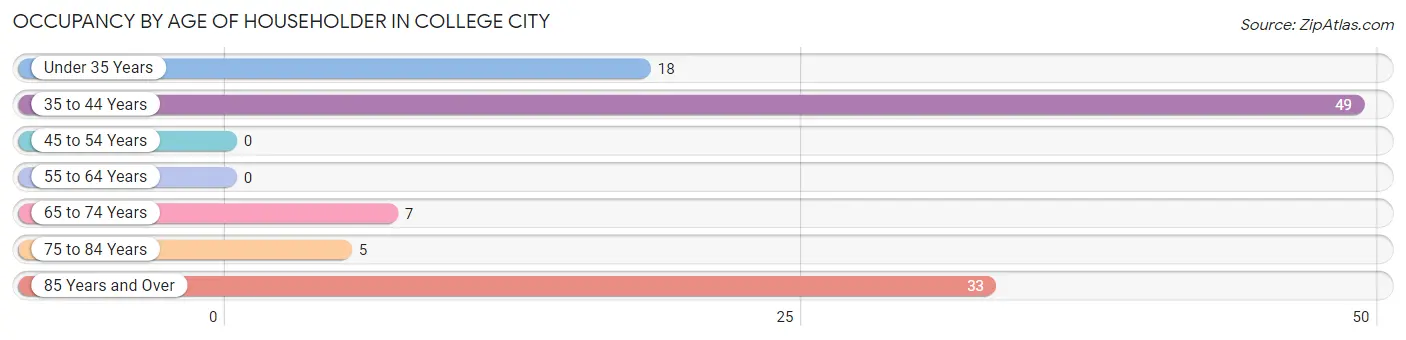
| Age Bracket | # Households | % Households |
| Under 35 Years | 18 | 16.1% |
| 35 to 44 Years | 49 | 43.8% |
| 45 to 54 Years | 0 | 0.0% |
| 55 to 64 Years | 0 | 0.0% |
| 65 to 74 Years | 7 | 6.2% |
| 75 to 84 Years | 5 | 4.5% |
| 85 Years and Over | 33 | 29.5% |
| Total | 112 | 100.0% |
Housing Finances in College City
Median Income by Occupancy in College City
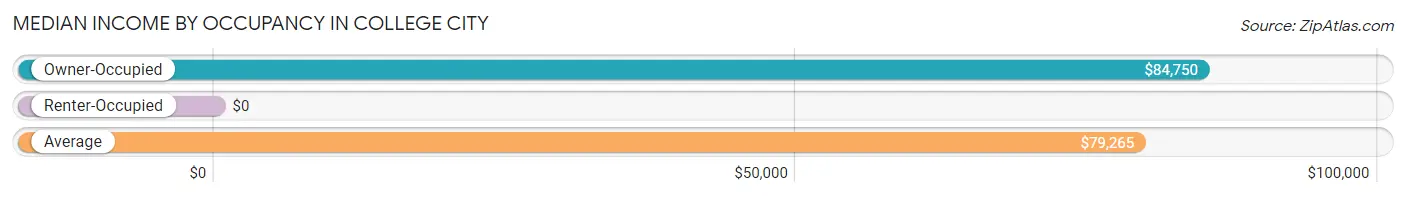
| Occupancy Type | # Households | Median Income |
| Owner-Occupied | 75 (67.0%) | $84,750 |
| Renter-Occupied | 37 (33.0%) | $0 |
| Average | 112 (100.0%) | $79,265 |
Occupancy by Householder Income Bracket in College City
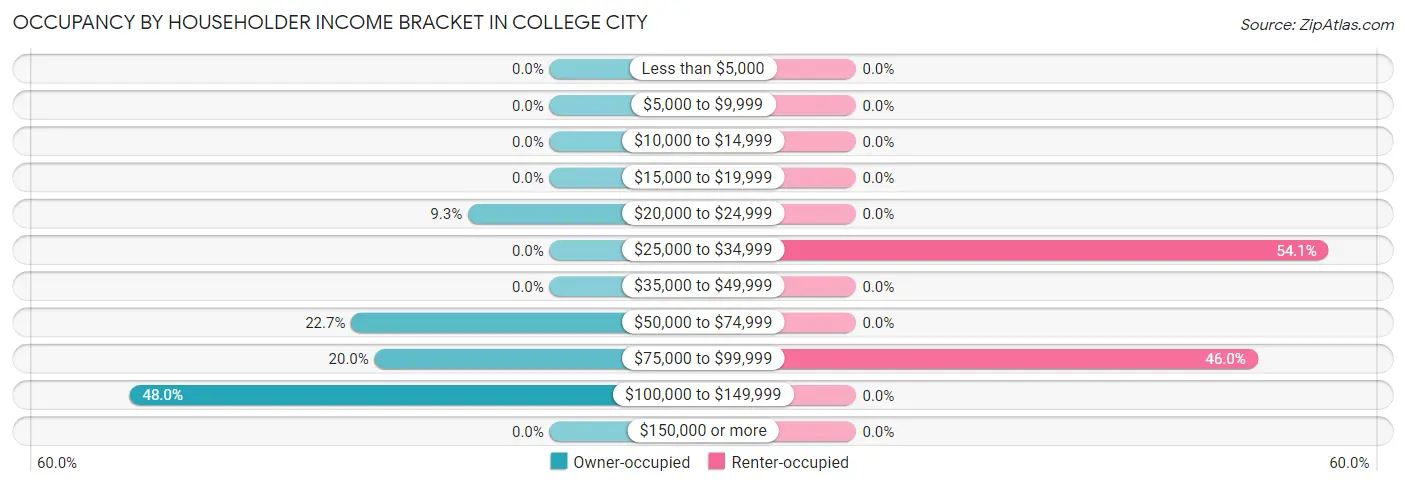
| Income Bracket | Owner-occupied | Renter-occupied |
| Less than $5,000 | 0 (0.0%) | 0 (0.0%) |
| $5,000 to $9,999 | 0 (0.0%) | 0 (0.0%) |
| $10,000 to $14,999 | 0 (0.0%) | 0 (0.0%) |
| $15,000 to $19,999 | 0 (0.0%) | 0 (0.0%) |
| $20,000 to $24,999 | 7 (9.3%) | 0 (0.0%) |
| $25,000 to $34,999 | 0 (0.0%) | 20 (54.0%) |
| $35,000 to $49,999 | 0 (0.0%) | 0 (0.0%) |
| $50,000 to $74,999 | 17 (22.7%) | 0 (0.0%) |
| $75,000 to $99,999 | 15 (20.0%) | 17 (46.0%) |
| $100,000 to $149,999 | 36 (48.0%) | 0 (0.0%) |
| $150,000 or more | 0 (0.0%) | 0 (0.0%) |
| Total | 75 (100.0%) | 37 (100.0%) |
Monthly Housing Cost Tiers in College City
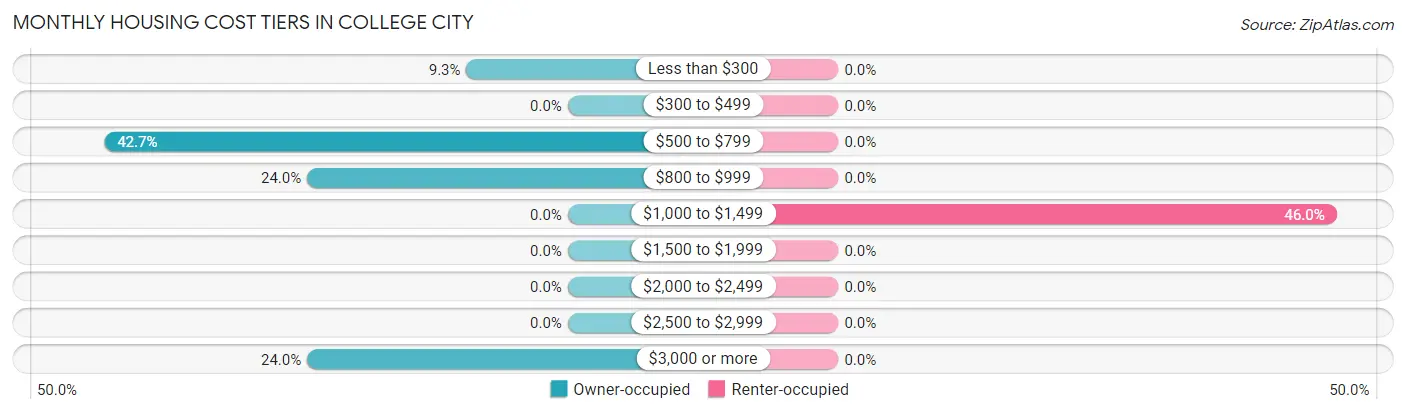
| Monthly Cost | Owner-occupied | Renter-occupied |
| Less than $300 | 7 (9.3%) | 0 (0.0%) |
| $300 to $499 | 0 (0.0%) | 0 (0.0%) |
| $500 to $799 | 32 (42.7%) | 0 (0.0%) |
| $800 to $999 | 18 (24.0%) | 0 (0.0%) |
| $1,000 to $1,499 | 0 (0.0%) | 17 (46.0%) |
| $1,500 to $1,999 | 0 (0.0%) | 0 (0.0%) |
| $2,000 to $2,499 | 0 (0.0%) | 0 (0.0%) |
| $2,500 to $2,999 | 0 (0.0%) | 0 (0.0%) |
| $3,000 or more | 18 (24.0%) | 0 (0.0%) |
| Total | 75 (100.0%) | 37 (100.0%) |
Physical Housing Characteristics in College City
Housing Structures in College City
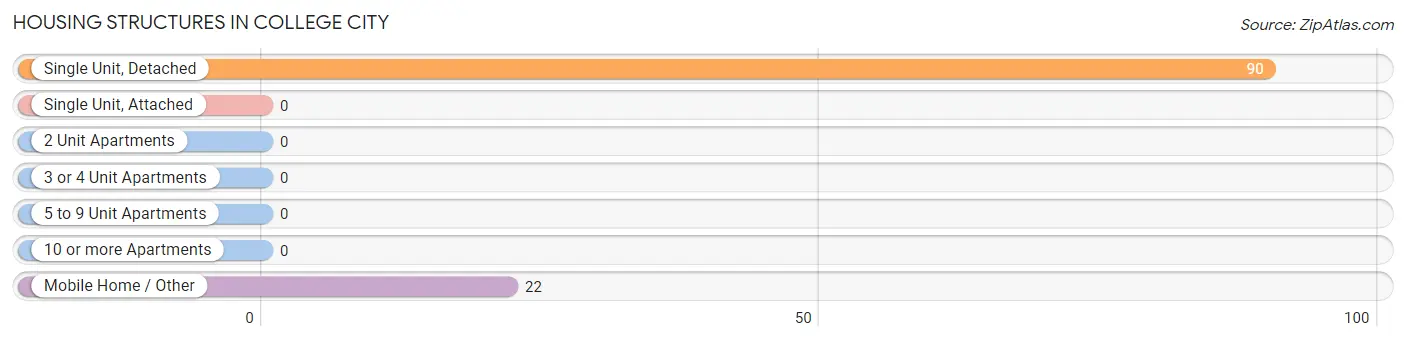
| Structure Type | # Housing Units | % Housing Units |
| Single Unit, Detached | 90 | 80.4% |
| Single Unit, Attached | 0 | 0.0% |
| 2 Unit Apartments | 0 | 0.0% |
| 3 or 4 Unit Apartments | 0 | 0.0% |
| 5 to 9 Unit Apartments | 0 | 0.0% |
| 10 or more Apartments | 0 | 0.0% |
| Mobile Home / Other | 22 | 19.6% |
| Total | 112 | 100.0% |
Housing Structures by Occupancy in College City
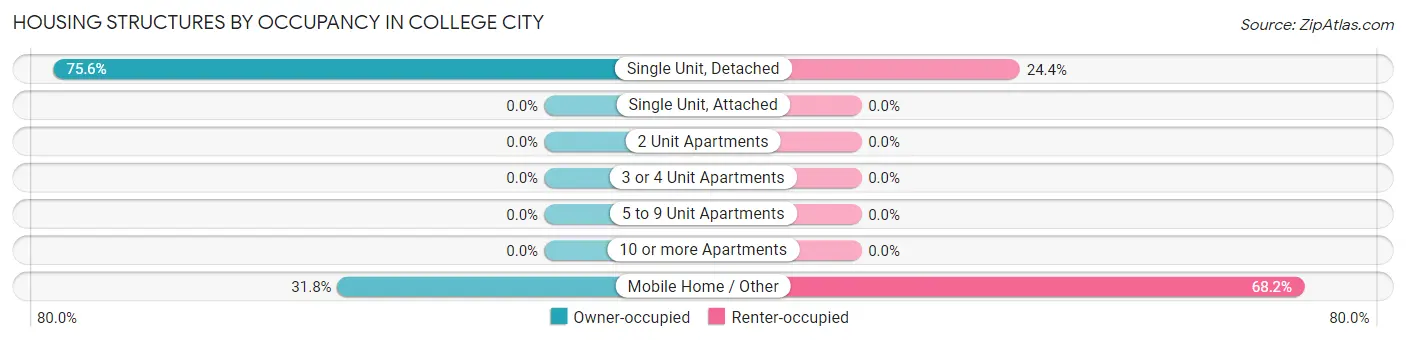
| Structure Type | Owner-occupied | Renter-occupied |
| Single Unit, Detached | 68 (75.6%) | 22 (24.4%) |
| Single Unit, Attached | 0 (0.0%) | 0 (0.0%) |
| 2 Unit Apartments | 0 (0.0%) | 0 (0.0%) |
| 3 or 4 Unit Apartments | 0 (0.0%) | 0 (0.0%) |
| 5 to 9 Unit Apartments | 0 (0.0%) | 0 (0.0%) |
| 10 or more Apartments | 0 (0.0%) | 0 (0.0%) |
| Mobile Home / Other | 7 (31.8%) | 15 (68.2%) |
| Total | 75 (67.0%) | 37 (33.0%) |
Housing Structures by Number of Rooms in College City
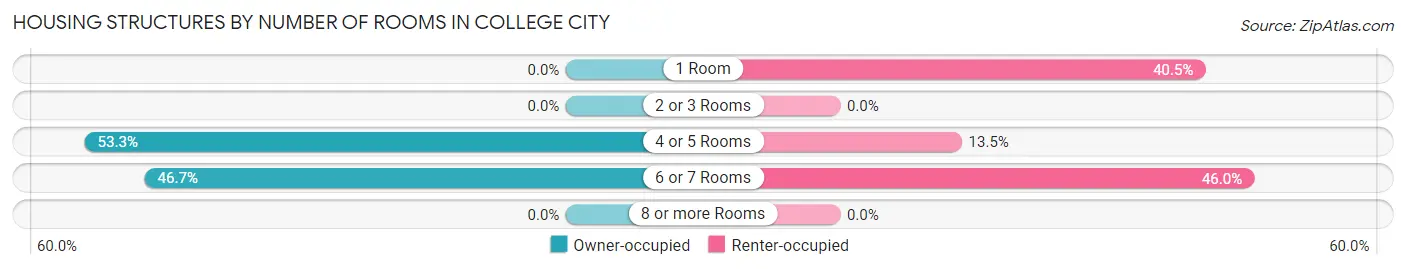
| Number of Rooms | Owner-occupied | Renter-occupied |
| 1 Room | 0 (0.0%) | 15 (40.5%) |
| 2 or 3 Rooms | 0 (0.0%) | 0 (0.0%) |
| 4 or 5 Rooms | 40 (53.3%) | 5 (13.5%) |
| 6 or 7 Rooms | 35 (46.7%) | 17 (46.0%) |
| 8 or more Rooms | 0 (0.0%) | 0 (0.0%) |
| Total | 75 (100.0%) | 37 (100.0%) |
Housing Structure by Heating Type in College City
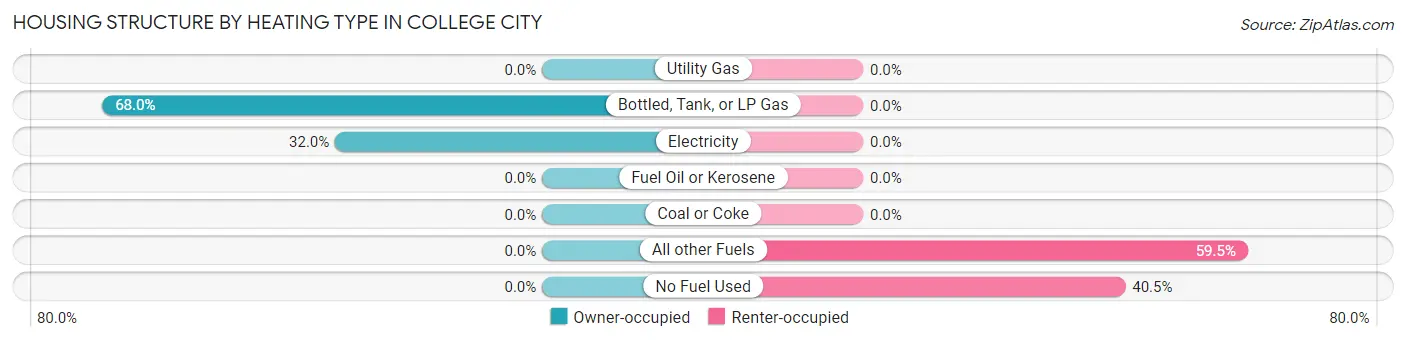
| Heating Type | Owner-occupied | Renter-occupied |
| Utility Gas | 0 (0.0%) | 0 (0.0%) |
| Bottled, Tank, or LP Gas | 51 (68.0%) | 0 (0.0%) |
| Electricity | 24 (32.0%) | 0 (0.0%) |
| Fuel Oil or Kerosene | 0 (0.0%) | 0 (0.0%) |
| Coal or Coke | 0 (0.0%) | 0 (0.0%) |
| All other Fuels | 0 (0.0%) | 22 (59.5%) |
| No Fuel Used | 0 (0.0%) | 15 (40.5%) |
| Total | 75 (100.0%) | 37 (100.0%) |
Household Vehicle Usage in College City
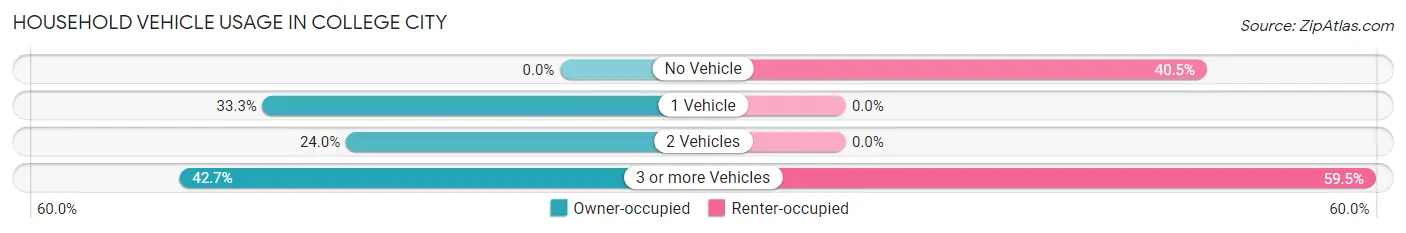
| Vehicles per Household | Owner-occupied | Renter-occupied |
| No Vehicle | 0 (0.0%) | 15 (40.5%) |
| 1 Vehicle | 25 (33.3%) | 0 (0.0%) |
| 2 Vehicles | 18 (24.0%) | 0 (0.0%) |
| 3 or more Vehicles | 32 (42.7%) | 22 (59.5%) |
| Total | 75 (100.0%) | 37 (100.0%) |
Real Estate & Mortgages in College City
Real Estate and Mortgage Overview in College City
| Characteristic | Without Mortgage | With Mortgage |
| Housing Units | 57 | 18 |
| Median Property Value | - | - |
| Median Household Income | $83,250 | $0 |
| Monthly Housing Costs | $567 | $18 |
| Real Estate Taxes | $1,681 | $0 |
Property Value by Mortgage Status in College City
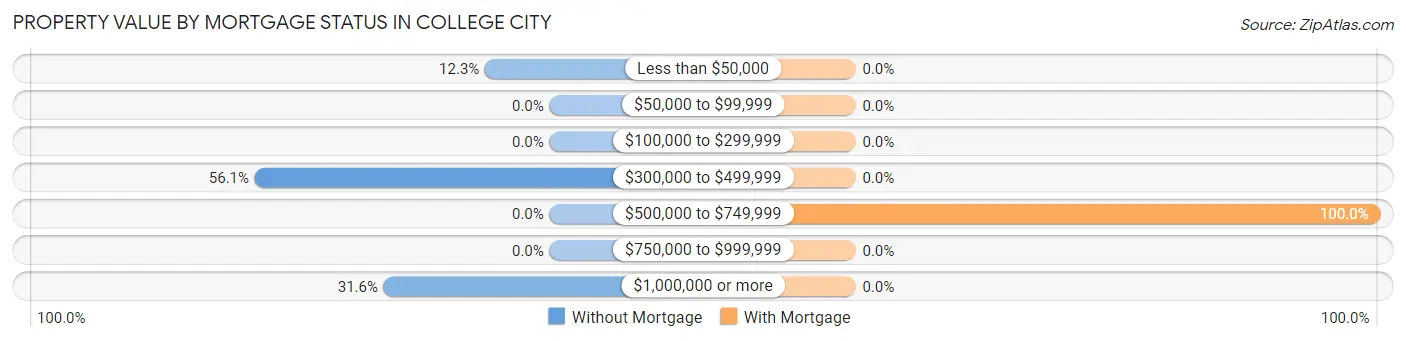
| Property Value | Without Mortgage | With Mortgage |
| Less than $50,000 | 7 (12.3%) | 0 (0.0%) |
| $50,000 to $99,999 | 0 (0.0%) | 0 (0.0%) |
| $100,000 to $299,999 | 0 (0.0%) | 0 (0.0%) |
| $300,000 to $499,999 | 32 (56.1%) | 0 (0.0%) |
| $500,000 to $749,999 | 0 (0.0%) | 18 (100.0%) |
| $750,000 to $999,999 | 0 (0.0%) | 0 (0.0%) |
| $1,000,000 or more | 18 (31.6%) | 0 (0.0%) |
| Total | 57 (100.0%) | 18 (100.0%) |
Household Income by Mortgage Status in College City
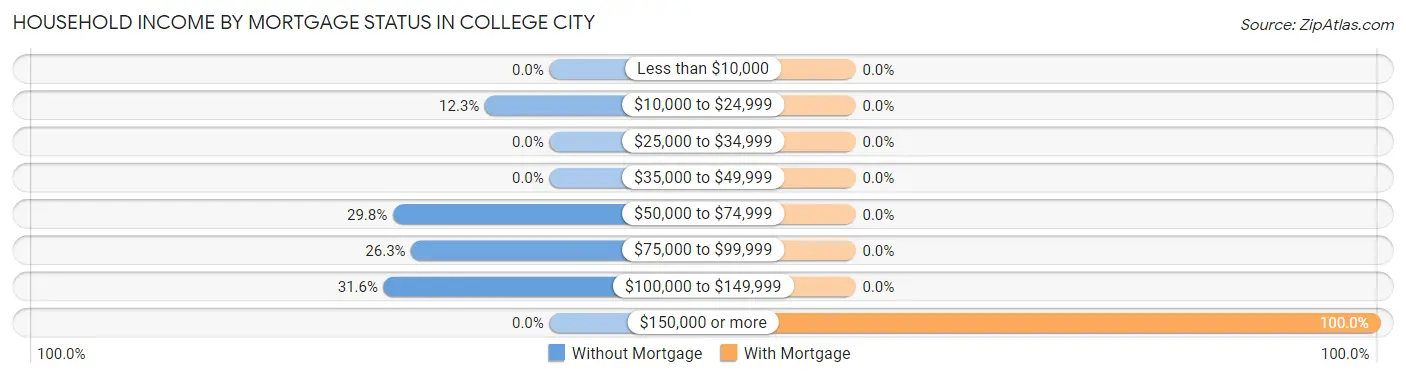
| Household Income | Without Mortgage | With Mortgage |
| Less than $10,000 | 0 (0.0%) | 0 (0.0%) |
| $10,000 to $24,999 | 7 (12.3%) | 0 (0.0%) |
| $25,000 to $34,999 | 0 (0.0%) | 0 (0.0%) |
| $35,000 to $49,999 | 0 (0.0%) | 0 (0.0%) |
| $50,000 to $74,999 | 17 (29.8%) | 0 (0.0%) |
| $75,000 to $99,999 | 15 (26.3%) | 0 (0.0%) |
| $100,000 to $149,999 | 18 (31.6%) | 0 (0.0%) |
| $150,000 or more | 0 (0.0%) | 18 (100.0%) |
| Total | 57 (100.0%) | 18 (100.0%) |
Property Value to Household Income Ratio in College City
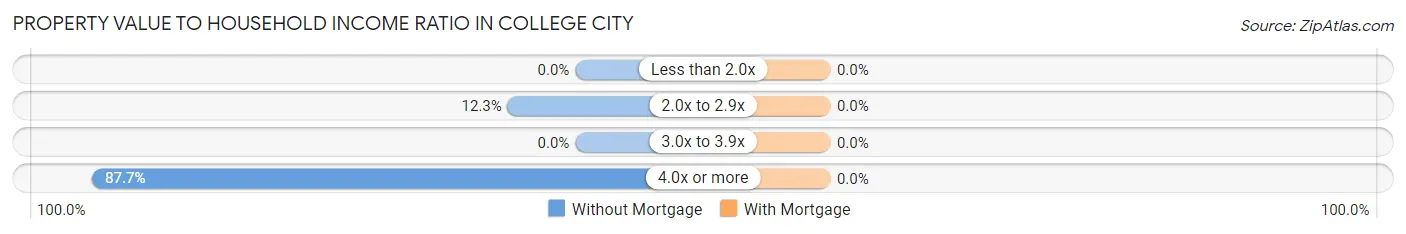
| Value-to-Income Ratio | Without Mortgage | With Mortgage |
| Less than 2.0x | 0 (0.0%) | 0 (0.0%) |
| 2.0x to 2.9x | 7 (12.3%) | 0 (0.0%) |
| 3.0x to 3.9x | 0 (0.0%) | 0 (0.0%) |
| 4.0x or more | 50 (87.7%) | 0 (0.0%) |
| Total | 57 (100.0%) | 18 (100.0%) |
Real Estate Taxes by Mortgage Status in College City
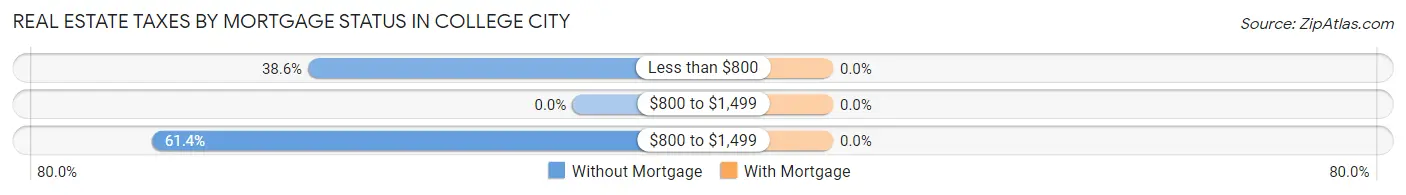
| Property Taxes | Without Mortgage | With Mortgage |
| Less than $800 | 22 (38.6%) | 0 (0.0%) |
| $800 to $1,499 | 0 (0.0%) | 0 (0.0%) |
| $800 to $1,499 | 35 (61.4%) | 0 (0.0%) |
| Total | 57 (100.0%) | 18 (100.0%) |
Health & Disability in College City
Health Insurance Coverage by Age in College City
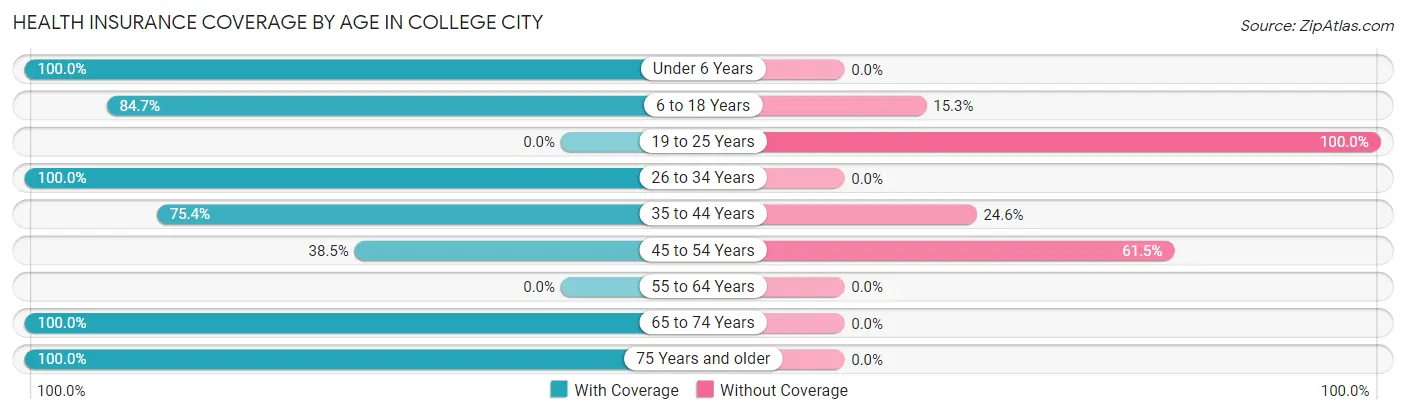
| Age Bracket | With Coverage | Without Coverage |
| Under 6 Years | 40 (100.0%) | 0 (0.0%) |
| 6 to 18 Years | 72 (84.7%) | 13 (15.3%) |
| 19 to 25 Years | 0 (0.0%) | 23 (100.0%) |
| 26 to 34 Years | 34 (100.0%) | 0 (0.0%) |
| 35 to 44 Years | 52 (75.4%) | 17 (24.6%) |
| 45 to 54 Years | 15 (38.5%) | 24 (61.5%) |
| 55 to 64 Years | 0 (0.0%) | 0 (0.0%) |
| 65 to 74 Years | 15 (100.0%) | 0 (0.0%) |
| 75 Years and older | 38 (100.0%) | 0 (0.0%) |
| Total | 266 (77.5%) | 77 (22.5%) |
Health Insurance Coverage by Citizenship Status in College City
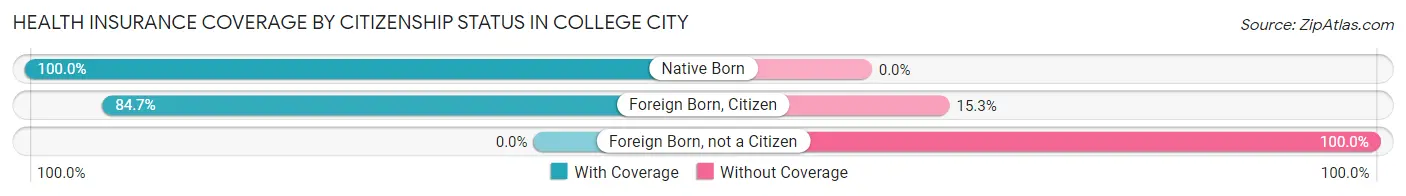
| Citizenship Status | With Coverage | Without Coverage |
| Native Born | 40 (100.0%) | 0 (0.0%) |
| Foreign Born, Citizen | 72 (84.7%) | 13 (15.3%) |
| Foreign Born, not a Citizen | 0 (0.0%) | 23 (100.0%) |
Health Insurance Coverage by Household Income in College City

| Household Income | With Coverage | Without Coverage |
| Under $25,000 | 7 (100.0%) | 0 (0.0%) |
| $25,000 to $49,999 | 28 (100.0%) | 0 (0.0%) |
| $50,000 to $74,999 | 0 (0.0%) | 77 (100.0%) |
| $75,000 to $99,999 | 179 (100.0%) | 0 (0.0%) |
| $100,000 and over | 52 (100.0%) | 0 (0.0%) |
Public vs Private Health Insurance Coverage by Age in College City
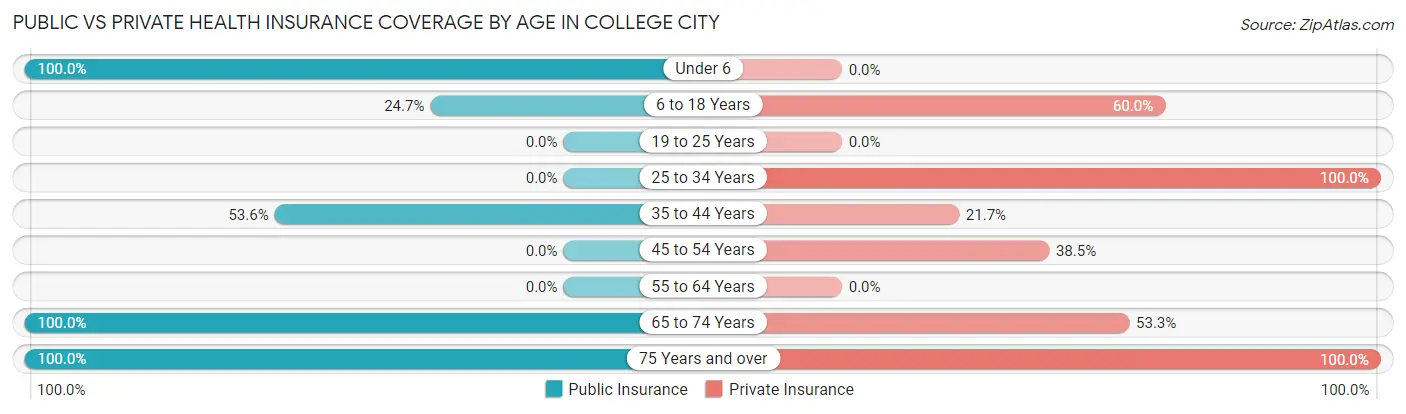
| Age Bracket | Public Insurance | Private Insurance |
| Under 6 | 40 (100.0%) | 0 (0.0%) |
| 6 to 18 Years | 21 (24.7%) | 51 (60.0%) |
| 19 to 25 Years | 0 (0.0%) | 0 (0.0%) |
| 25 to 34 Years | 0 (0.0%) | 34 (100.0%) |
| 35 to 44 Years | 37 (53.6%) | 15 (21.7%) |
| 45 to 54 Years | 0 (0.0%) | 15 (38.5%) |
| 55 to 64 Years | 0 (0.0%) | 0 (0.0%) |
| 65 to 74 Years | 15 (100.0%) | 8 (53.3%) |
| 75 Years and over | 38 (100.0%) | 38 (100.0%) |
| Total | 151 (44.0%) | 161 (46.9%) |
Disability Status by Sex by Age in College City
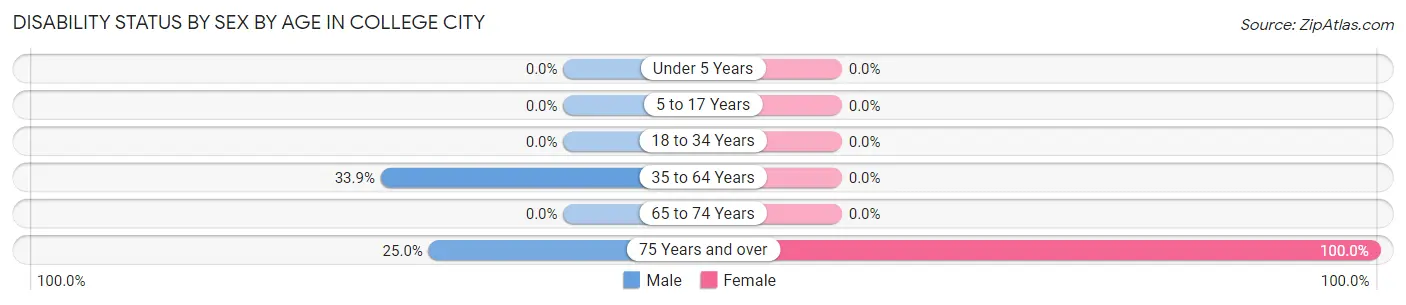
| Age Bracket | Male | Female |
| Under 5 Years | 0 (0.0%) | 0 (0.0%) |
| 5 to 17 Years | 0 (0.0%) | 0 (0.0%) |
| 18 to 34 Years | 0 (0.0%) | 0 (0.0%) |
| 35 to 64 Years | 20 (33.9%) | 0 (0.0%) |
| 65 to 74 Years | 0 (0.0%) | 0 (0.0%) |
| 75 Years and over | 5 (25.0%) | 18 (100.0%) |
Disability Class by Sex by Age in College City
Disability Class: Hearing Difficulty
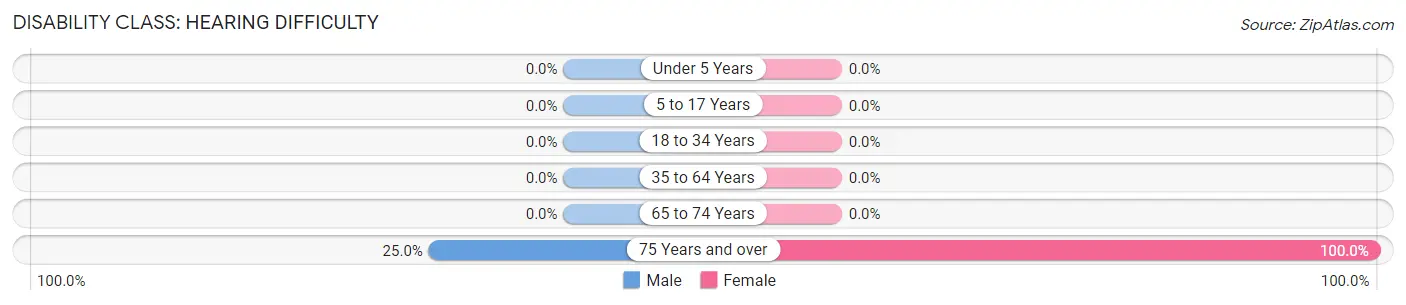
| Age Bracket | Male | Female |
| Under 5 Years | 0 (0.0%) | 0 (0.0%) |
| 5 to 17 Years | 0 (0.0%) | 0 (0.0%) |
| 18 to 34 Years | 0 (0.0%) | 0 (0.0%) |
| 35 to 64 Years | 0 (0.0%) | 0 (0.0%) |
| 65 to 74 Years | 0 (0.0%) | 0 (0.0%) |
| 75 Years and over | 5 (25.0%) | 18 (100.0%) |
Disability Class: Vision Difficulty
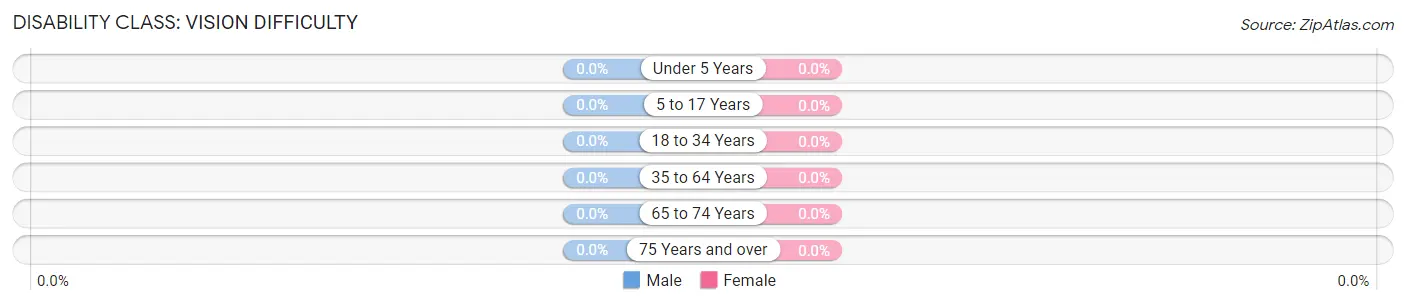
| Age Bracket | Male | Female |
| Under 5 Years | 0 (0.0%) | 0 (0.0%) |
| 5 to 17 Years | 0 (0.0%) | 0 (0.0%) |
| 18 to 34 Years | 0 (0.0%) | 0 (0.0%) |
| 35 to 64 Years | 0 (0.0%) | 0 (0.0%) |
| 65 to 74 Years | 0 (0.0%) | 0 (0.0%) |
| 75 Years and over | 0 (0.0%) | 0 (0.0%) |
Disability Class: Cognitive Difficulty
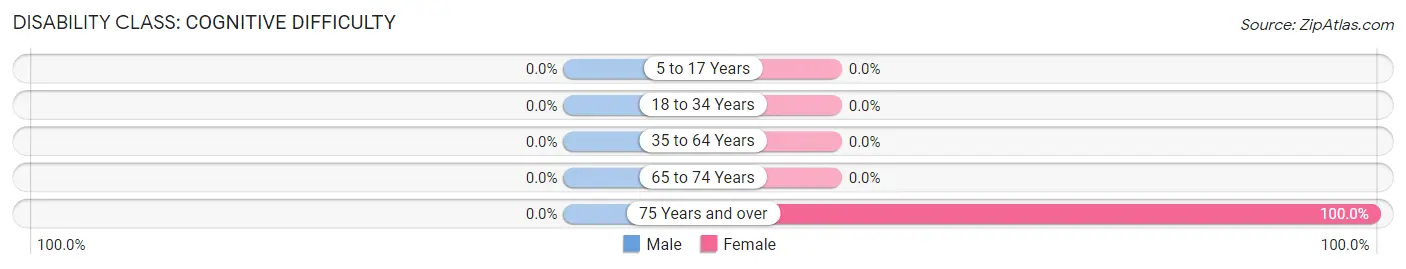
| Age Bracket | Male | Female |
| 5 to 17 Years | 0 (0.0%) | 0 (0.0%) |
| 18 to 34 Years | 0 (0.0%) | 0 (0.0%) |
| 35 to 64 Years | 0 (0.0%) | 0 (0.0%) |
| 65 to 74 Years | 0 (0.0%) | 0 (0.0%) |
| 75 Years and over | 0 (0.0%) | 18 (100.0%) |
Disability Class: Ambulatory Difficulty
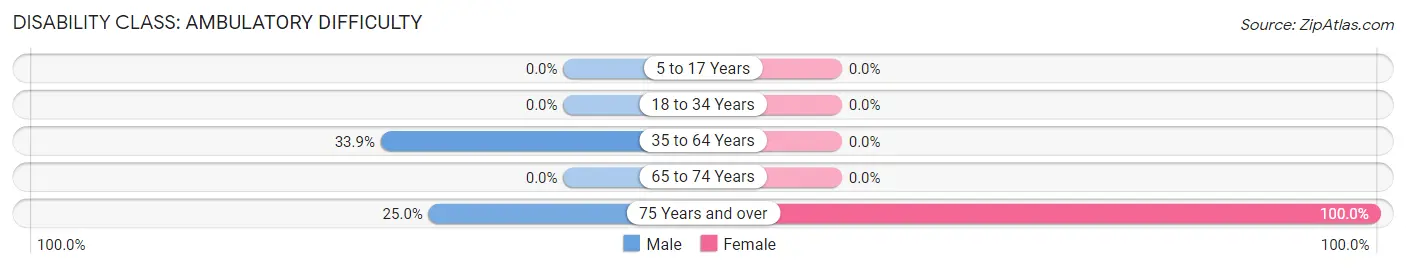
| Age Bracket | Male | Female |
| 5 to 17 Years | 0 (0.0%) | 0 (0.0%) |
| 18 to 34 Years | 0 (0.0%) | 0 (0.0%) |
| 35 to 64 Years | 20 (33.9%) | 0 (0.0%) |
| 65 to 74 Years | 0 (0.0%) | 0 (0.0%) |
| 75 Years and over | 5 (25.0%) | 18 (100.0%) |
Disability Class: Self-Care Difficulty
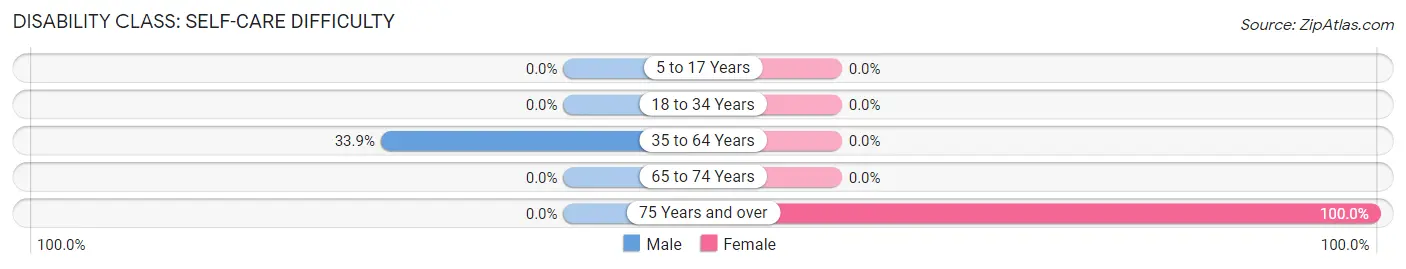
| Age Bracket | Male | Female |
| 5 to 17 Years | 0 (0.0%) | 0 (0.0%) |
| 18 to 34 Years | 0 (0.0%) | 0 (0.0%) |
| 35 to 64 Years | 20 (33.9%) | 0 (0.0%) |
| 65 to 74 Years | 0 (0.0%) | 0 (0.0%) |
| 75 Years and over | 0 (0.0%) | 18 (100.0%) |
Technology Access in College City
Computing Device Access in College City
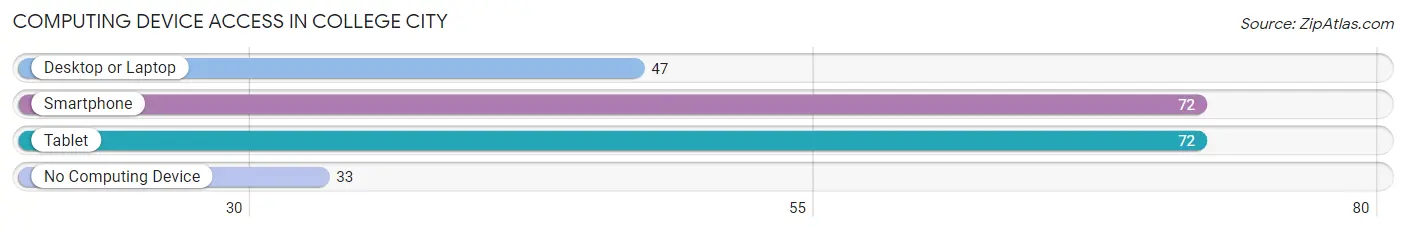
| Device Type | # Households | % Households |
| Desktop or Laptop | 47 | 42.0% |
| Smartphone | 72 | 64.3% |
| Tablet | 72 | 64.3% |
| No Computing Device | 33 | 29.5% |
| Total | 112 | 100.0% |
Internet Access in College City
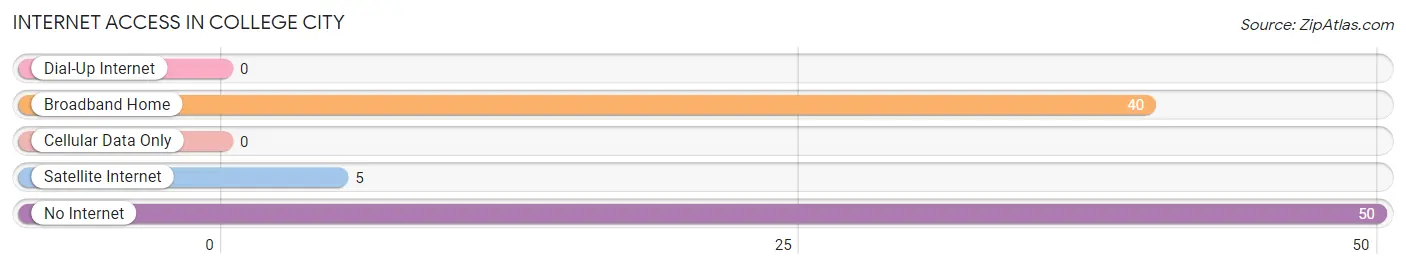
| Internet Type | # Households | % Households |
| Dial-Up Internet | 0 | 0.0% |
| Broadband Home | 40 | 35.7% |
| Cellular Data Only | 0 | 0.0% |
| Satellite Internet | 5 | 4.5% |
| No Internet | 50 | 44.6% |
| Total | 112 | 100.0% |
College City Summary
City of College City CA
History
The city of College City, California is located in the Central Valley of California, approximately 30 miles east of the state capital of Sacramento. The city was founded in 1872 by a group of settlers who were looking to establish a college town. The city was named after the college that was established in the area, College of the Pacific. The college was founded by a group of local businessmen who wanted to provide educational opportunities to the local population.
The city of College City has a rich history that dates back to the early days of the Gold Rush. The city was a popular destination for miners and prospectors who were looking to strike it rich. The city was also a popular destination for those looking to escape the harsh conditions of the gold fields. The city was also a popular destination for those looking to escape the harsh conditions of the gold fields.
The city of College City has a long history of being a center of education. The College of the Pacific was the first college in the area and was established in 1872. The college was the first to offer a four-year degree program in the area. The college was also the first to offer a degree in engineering.
The city of College City has a long history of being a center of industry. The city was home to a number of factories and mills that produced a variety of products. The city was also home to a number of lumber mills that produced lumber for the local population. The city was also home to a number of canneries that produced canned goods for the local population.
The city of College City has a long history of being a center of culture. The city was home to a number of theaters and music venues that provided entertainment for the local population. The city was also home to a number of museums and galleries that provided educational opportunities for the local population.
Geography
The city of College City is located in the Central Valley of California, approximately 30 miles east of the state capital of Sacramento. The city is situated on the banks of the Sacramento River and is surrounded by rolling hills and farmland. The city is located in a temperate climate zone and experiences mild winters and hot summers.
The city of College City is located in a region of California known as the Central Valley. The Central Valley is a large agricultural region that is home to a variety of crops and livestock. The city is located in a region of California known as the Central Valley. The Central Valley is a large agricultural region that is home to a variety of crops and livestock.
Economy
The city of College City has a strong economy that is based on agriculture, manufacturing, and tourism. The city is home to a number of agricultural businesses that produce a variety of crops and livestock. The city is also home to a number of manufacturing businesses that produce a variety of products. The city is also home to a number of tourism businesses that provide a variety of services to visitors.
The city of College City is home to a number of educational institutions that provide educational opportunities to the local population. The city is home to the College of the Pacific, which is a four-year university that offers a variety of degree programs. The city is also home to a number of community colleges that provide educational opportunities to the local population.
Demographics
The city of College City has a population of approximately 10,000 people. The city has a diverse population that is made up of a variety of ethnic and racial backgrounds. The city has a large Hispanic population that makes up approximately 40% of the population. The city also has a large Asian population that makes up approximately 20% of the population. The city also has a large African American population that makes up approximately 10% of the population. The city also has a large white population that makes up approximately 30% of the population.
Conclusion
The city of College City, California is a vibrant and diverse city that has a rich history and a strong economy. The city is home to a number of educational institutions that provide educational opportunities to the local population. The city is also home to a number of agricultural businesses that produce a variety of crops and livestock. The city is also home to a number of manufacturing businesses that produce a variety of products. The city is also home to a number of tourism businesses that provide a variety of services to visitors. The city has a diverse population that is made up of a variety of ethnic and racial backgrounds.
Common Questions
What is Per Capita Income in College City?
Per Capita income in College City is $26,507.
What is the Median Family Income in College City?
Median Family Income in College City is $79,559.
What is the Median Household income in College City?
Median Household Income in College City is $79,265.
What is Inequality or Gini Index in College City?
Inequality or Gini Index in College City is 0.26.
What is the Total Population of College City?
Total Population of College City is 343.
What is the Total Male Population of College City?
Total Male Population of College City is 152.
What is the Total Female Population of College City?
Total Female Population of College City is 191.
What is the Ratio of Males per 100 Females in College City?
There are 79.58 Males per 100 Females in College City.
What is the Ratio of Females per 100 Males in College City?
There are 125.66 Females per 100 Males in College City.
What is the Median Population Age in College City?
Median Population Age in College City is 30.3 Years.
What is the Average Family Size in College City
Average Family Size in College City is 4.2 People.
What is the Average Household Size in College City
Average Household Size in College City is 3.1 People.
How Large is the Labor Force in College City?
There are 126 People in the Labor Forcein in College City.
What is the Percentage of People in the Labor Force in College City?
51.6% of People are in the Labor Force in College City.