Cities with the Highest Percentage of Population Employed in Education Instruction & Library in California
RELATED REPORTS & OPTIONS
Education Instruction & Library
California
Compare Cities
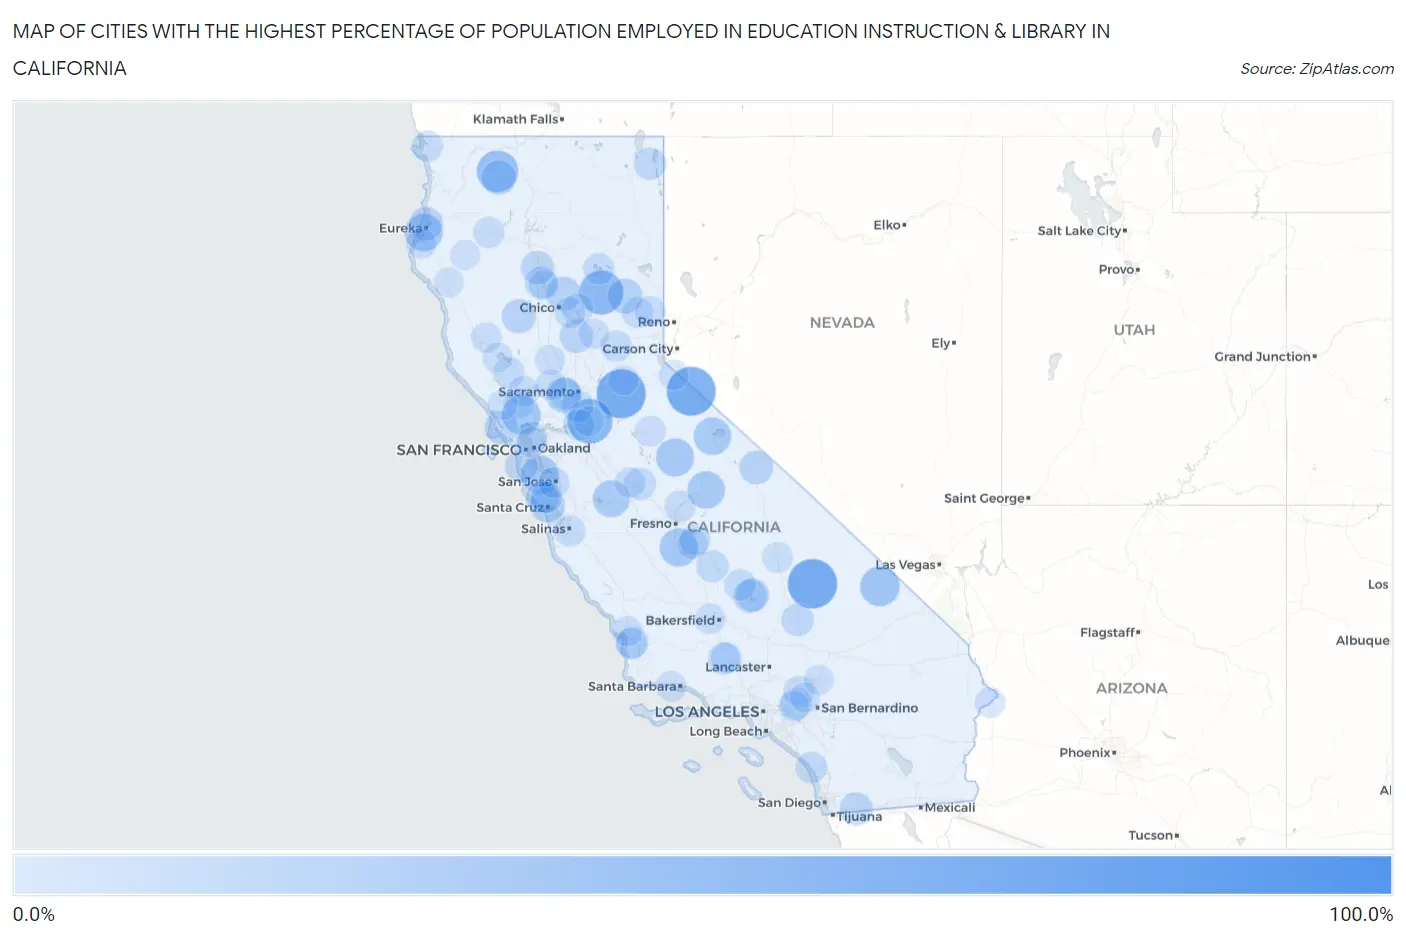
Map of Cities with the Highest Percentage of Population Employed in Education Instruction & Library in California
0.0%
100.0%
Cities with the Highest Percentage of Population Employed in Education Instruction & Library in California
| City | % Employed | vs State | vs National | |
| 1. | Foresta | 100.0% | 5.5%(+94.5)#1 | 6.2%(+93.8)#4 |
| 2. | Strawberry Cdp Tuolumne County | 100.0% | 5.5%(+94.5)#2 | 6.2%(+93.8)#7 |
| 3. | Homewood Canyon | 71.0% | 5.5%(+65.4)#3 | 6.2%(+64.8)#30 |
| 4. | River Pines | 69.9% | 5.5%(+64.3)#4 | 6.2%(+63.7)#32 |
| 5. | Coleville | 69.0% | 5.5%(+63.5)#5 | 6.2%(+62.9)#35 |
| 6. | Acampo | 56.6% | 5.5%(+51.0)#6 | 6.2%(+50.4)#62 |
| 7. | Meadow Valley | 55.1% | 5.5%(+49.5)#7 | 6.2%(+48.9)#69 |
| 8. | Greenview | 46.7% | 5.5%(+41.1)#8 | 6.2%(+40.5)#117 |
| 9. | Camp Pendleton Mainside | 41.4% | 5.5%(+35.8)#9 | 6.2%(+35.2)#162 |
| 10. | Tecopa | 40.9% | 5.5%(+35.4)#10 | 6.2%(+34.7)#166 |
| 11. | Temelec | 38.2% | 5.5%(+32.7)#11 | 6.2%(+32.0)#186 |
| 12. | Hardwick | 37.2% | 5.5%(+31.6)#12 | 6.2%(+31.0)#205 |
| 13. | Stanford | 36.7% | 5.5%(+31.1)#13 | 6.2%(+30.5)#213 |
| 14. | El Portal | 36.5% | 5.5%(+30.9)#14 | 6.2%(+30.3)#217 |
| 15. | Fields Landing | 35.6% | 5.5%(+30.0)#15 | 6.2%(+29.4)#231 |
| 16. | Lee Vining | 35.5% | 5.5%(+30.0)#16 | 6.2%(+29.3)#233 |
| 17. | University Of California-Santa Barbara | 35.0% | 5.5%(+29.5)#17 | 6.2%(+28.9)#243 |
| 18. | Big Creek | 34.8% | 5.5%(+29.2)#18 | 6.2%(+28.6)#248 |
| 19. | Volta | 33.1% | 5.5%(+27.6)#19 | 6.2%(+26.9)#273 |
| 20. | University Of California Davis | 28.5% | 5.5%(+22.9)#20 | 6.2%(+22.3)#379 |
| 21. | Cromberg | 27.7% | 5.5%(+22.1)#21 | 6.2%(+21.5)#395 |
| 22. | Paradise Park | 27.5% | 5.5%(+21.9)#22 | 6.2%(+21.3)#401 |
| 23. | Mountain Meadows | 27.2% | 5.5%(+21.7)#23 | 6.2%(+21.0)#416 |
| 24. | Etna | 26.3% | 5.5%(+20.7)#24 | 6.2%(+20.1)#455 |
| 25. | Cohasset | 25.7% | 5.5%(+20.1)#25 | 6.2%(+19.5)#475 |
| 26. | Pepperdine University | 25.1% | 5.5%(+19.5)#26 | 6.2%(+18.9)#492 |
| 27. | Elk Creek | 25.0% | 5.5%(+19.5)#27 | 6.2%(+18.8)#502 |
| 28. | Chalfant | 24.0% | 5.5%(+18.5)#28 | 6.2%(+17.9)#545 |
| 29. | Manila | 23.3% | 5.5%(+17.8)#29 | 6.2%(+17.2)#585 |
| 30. | Honcut | 22.9% | 5.5%(+17.4)#30 | 6.2%(+16.7)#621 |
| 31. | Inverness | 22.7% | 5.5%(+17.1)#31 | 6.2%(+16.5)#637 |
| 32. | Wofford Heights | 22.5% | 5.5%(+17.0)#32 | 6.2%(+16.4)#644 |
| 33. | Kernville | 22.4% | 5.5%(+16.9)#33 | 6.2%(+16.3)#655 |
| 34. | Bend | 22.1% | 5.5%(+16.5)#34 | 6.2%(+15.9)#676 |
| 35. | Brookdale | 22.0% | 5.5%(+16.5)#35 | 6.2%(+15.9)#683 |
| 36. | Potrero | 21.9% | 5.5%(+16.4)#36 | 6.2%(+15.7)#696 |
| 37. | Montara | 20.6% | 5.5%(+15.1)#37 | 6.2%(+14.5)#790 |
| 38. | Johannesburg | 20.6% | 5.5%(+15.0)#38 | 6.2%(+14.4)#794 |
| 39. | Gerber | 20.5% | 5.5%(+15.0)#39 | 6.2%(+14.4)#796 |
| 40. | Lake City | 20.0% | 5.5%(+14.5)#40 | 6.2%(+13.8)#855 |
| 41. | Bear Creek | 19.4% | 5.5%(+13.9)#41 | 6.2%(+13.3)#915 |
| 42. | Frazier Park | 19.3% | 5.5%(+13.7)#42 | 6.2%(+13.1)#937 |
| 43. | Plainview | 19.1% | 5.5%(+13.6)#43 | 6.2%(+12.9)#947 |
| 44. | Hood | 19.1% | 5.5%(+13.5)#44 | 6.2%(+12.9)#953 |
| 45. | Davis | 19.0% | 5.5%(+13.4)#45 | 6.2%(+12.8)#971 |
| 46. | Blacklake | 18.8% | 5.5%(+13.2)#46 | 6.2%(+12.6)#989 |
| 47. | Camp Pendleton South | 18.3% | 5.5%(+12.7)#47 | 6.2%(+12.1)#1,052 |
| 48. | Modjeska | 17.7% | 5.5%(+12.2)#48 | 6.2%(+11.5)#1,130 |
| 49. | East Richmond Heights | 17.6% | 5.5%(+12.0)#49 | 6.2%(+11.4)#1,150 |
| 50. | Pine Flat | 17.5% | 5.5%(+12.0)#50 | 6.2%(+11.3)#1,160 |
| 51. | Cobb | 17.5% | 5.5%(+11.9)#51 | 6.2%(+11.3)#1,163 |
| 52. | San Antonio Heights | 17.4% | 5.5%(+11.9)#52 | 6.2%(+11.3)#1,166 |
| 53. | Petaluma Center | 17.3% | 5.5%(+11.8)#53 | 6.2%(+11.1)#1,186 |
| 54. | Dutch Flat | 17.3% | 5.5%(+11.8)#54 | 6.2%(+11.1)#1,187 |
| 55. | Terminous | 17.2% | 5.5%(+11.6)#55 | 6.2%(+11.0)#1,217 |
| 56. | Lake Almanor Country Club | 17.1% | 5.5%(+11.5)#56 | 6.2%(+10.9)#1,233 |
| 57. | Lompico | 16.8% | 5.5%(+11.3)#57 | 6.2%(+10.7)#1,283 |
| 58. | Sonoma State University | 16.6% | 5.5%(+11.1)#58 | 6.2%(+10.5)#1,340 |
| 59. | Junction City | 16.6% | 5.5%(+11.1)#59 | 6.2%(+10.5)#1,341 |
| 60. | Yankee Hill | 16.4% | 5.5%(+10.8)#60 | 6.2%(+10.2)#1,387 |
| 61. | Woodlands | 16.3% | 5.5%(+10.8)#61 | 6.2%(+10.2)#1,392 |
| 62. | Butte Valley | 16.2% | 5.5%(+10.7)#62 | 6.2%(+10.0)#1,418 |
| 63. | Angwin | 16.0% | 5.5%(+10.5)#63 | 6.2%(+9.85)#1,455 |
| 64. | Fruitdale | 16.0% | 5.5%(+10.5)#64 | 6.2%(+9.84)#1,457 |
| 65. | Friant | 15.9% | 5.5%(+10.4)#65 | 6.2%(+9.75)#1,480 |
| 66. | Delft Colony | 15.9% | 5.5%(+10.3)#66 | 6.2%(+9.69)#1,499 |
| 67. | Spreckels | 15.9% | 5.5%(+10.3)#67 | 6.2%(+9.69)#1,502 |
| 68. | Fort Dick | 15.9% | 5.5%(+10.3)#68 | 6.2%(+9.67)#1,506 |
| 69. | Olde Stockdale | 15.8% | 5.5%(+10.3)#69 | 6.2%(+9.65)#1,510 |
| 70. | Calpine | 15.6% | 5.5%(+10.1)#70 | 6.2%(+9.44)#1,554 |
| 71. | Traver | 15.6% | 5.5%(+10.0)#71 | 6.2%(+9.39)#1,567 |
| 72. | Wrightwood | 15.4% | 5.5%(+9.89)#72 | 6.2%(+9.25)#1,605 |
| 73. | Madison | 15.4% | 5.5%(+9.84)#73 | 6.2%(+9.20)#1,614 |
| 74. | Claremont | 15.4% | 5.5%(+9.82)#74 | 6.2%(+9.19)#1,627 |
| 75. | Lebec | 15.2% | 5.5%(+9.60)#75 | 6.2%(+8.97)#1,676 |
| 76. | Olancha | 15.1% | 5.5%(+9.57)#76 | 6.2%(+8.93)#1,687 |
| 77. | Isla Vista | 14.9% | 5.5%(+9.31)#77 | 6.2%(+8.67)#1,748 |
| 78. | Twain Harte | 14.8% | 5.5%(+9.27)#78 | 6.2%(+8.63)#1,758 |
| 79. | Loyalton | 14.8% | 5.5%(+9.21)#79 | 6.2%(+8.57)#1,775 |
| 80. | Potter Valley | 14.5% | 5.5%(+8.98)#80 | 6.2%(+8.35)#1,829 |
| 81. | Mcswain | 14.5% | 5.5%(+8.97)#81 | 6.2%(+8.33)#1,834 |
| 82. | Dobbins | 14.4% | 5.5%(+8.89)#82 | 6.2%(+8.25)#1,861 |
| 83. | Bluewater | 14.3% | 5.5%(+8.74)#83 | 6.2%(+8.10)#1,916 |
| 84. | Rosedale | 14.2% | 5.5%(+8.69)#84 | 6.2%(+8.06)#1,951 |
| 85. | Kenwood | 14.1% | 5.5%(+8.58)#85 | 6.2%(+7.94)#1,991 |
| 86. | Ferndale | 14.1% | 5.5%(+8.55)#86 | 6.2%(+7.91)#2,001 |
| 87. | Los Ranchos | 14.0% | 5.5%(+8.50)#87 | 6.2%(+7.86)#2,017 |
| 88. | Albany | 13.9% | 5.5%(+8.31)#88 | 6.2%(+7.68)#2,073 |
| 89. | Sebastopol | 13.8% | 5.5%(+8.26)#89 | 6.2%(+7.62)#2,097 |
| 90. | Lytle Creek | 13.6% | 5.5%(+8.03)#90 | 6.2%(+7.39)#2,193 |
| 91. | College City | 13.5% | 5.5%(+7.94)#91 | 6.2%(+7.31)#2,219 |
| 92. | Mad River | 13.4% | 5.5%(+7.89)#92 | 6.2%(+7.25)#2,243 |
| 93. | Benbow | 13.4% | 5.5%(+7.89)#93 | 6.2%(+7.25)#2,246 |
| 94. | Bonadelle Ranchos | 13.4% | 5.5%(+7.80)#94 | 6.2%(+7.17)#2,277 |
| 95. | Los Molinos | 13.3% | 5.5%(+7.79)#95 | 6.2%(+7.15)#2,284 |
| 96. | Mesa Vista | 13.3% | 5.5%(+7.79)#96 | 6.2%(+7.15)#2,293 |
| 97. | Spring Valley Lake | 13.2% | 5.5%(+7.66)#97 | 6.2%(+7.03)#2,335 |
| 98. | Lakeport | 13.2% | 5.5%(+7.64)#98 | 6.2%(+7.01)#2,347 |
| 99. | Camino | 13.1% | 5.5%(+7.58)#99 | 6.2%(+6.95)#2,367 |
| 100. | Woodbridge | 13.1% | 5.5%(+7.53)#100 | 6.2%(+6.90)#2,381 |
Common Questions
What are the Top 10 Cities with the Highest Percentage of Population Employed in Education Instruction & Library in California?
Top 10 Cities with the Highest Percentage of Population Employed in Education Instruction & Library in California are:
#1
71.0%
#2
69.9%
#3
69.0%
#4
56.6%
#5
55.1%
#6
46.7%
#7
40.9%
#8
38.2%
#9
37.2%
#10
36.7%
What city has the Highest Percentage of Population Employed in Education Instruction & Library in California?
Homewood Canyon has the Highest Percentage of Population Employed in Education Instruction & Library in California with 71.0%.
What is the Percentage of Population Employed in Education Instruction & Library in the State of California?
Percentage of Population Employed in Education Instruction & Library in California is 5.5%.
What is the Percentage of Population Employed in Education Instruction & Library in the United States?
Percentage of Population Employed in Education Instruction & Library in the United States is 6.2%.