Zip Codes with the Highest Percentage of Population Employed in Installation, Maintenance & Repair in Visalia, CA
RELATED REPORTS & OPTIONS
Installation, Maintenance & Repair
Visalia
Compare Zip Codes
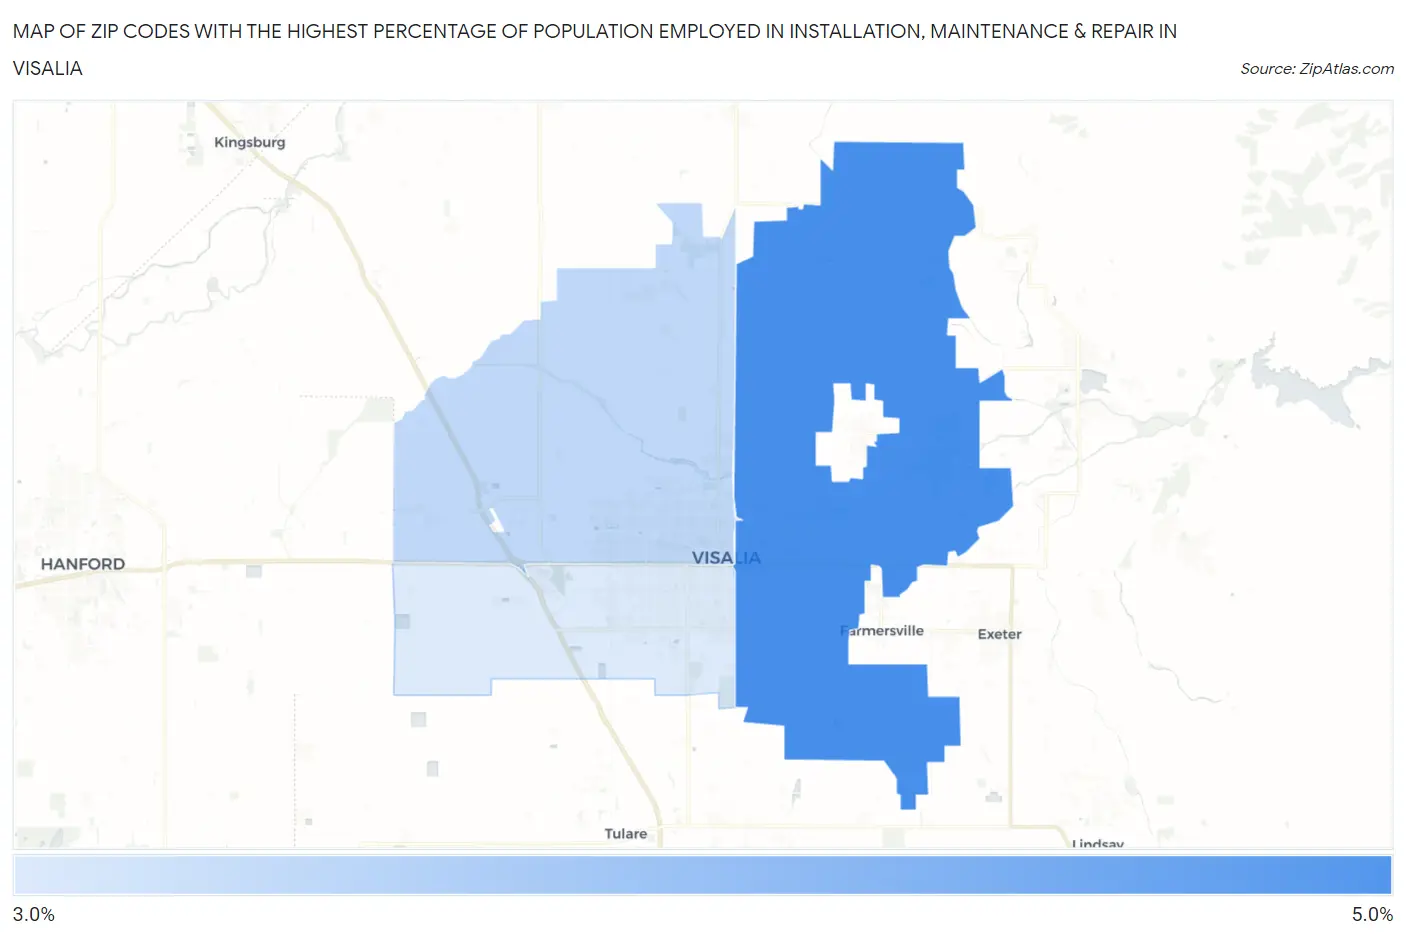
Map of Zip Codes with the Highest Percentage of Population Employed in Installation, Maintenance & Repair in Visalia
3.0%
4.0%
Zip Codes with the Highest Percentage of Population Employed in Installation, Maintenance & Repair in Visalia, CA
| Zip Code | % Employed | vs State | vs National | |
| 1. | 93292 | 4.0% | 2.6%(+1.46)#327 | 3.1%(+0.947)#12,287 |
| 2. | 93291 | 3.2% | 2.6%(+0.667)#524 | 3.1%(+0.156)#15,914 |
| 3. | 93277 | 3.0% | 2.6%(+0.468)#589 | 3.1%(-0.043)#16,871 |
1
Common Questions
What are the Top Zip Codes with the Highest Percentage of Population Employed in Installation, Maintenance & Repair in Visalia, CA?
Top Zip Codes with the Highest Percentage of Population Employed in Installation, Maintenance & Repair in Visalia, CA are:
What zip code has the Highest Percentage of Population Employed in Installation, Maintenance & Repair in Visalia, CA?
93292 has the Highest Percentage of Population Employed in Installation, Maintenance & Repair in Visalia, CA with 4.0%.
What is the Percentage of Population Employed in Installation, Maintenance & Repair in Visalia, CA?
Percentage of Population Employed in Installation, Maintenance & Repair in Visalia is 3.4%.
What is the Percentage of Population Employed in Installation, Maintenance & Repair in California?
Percentage of Population Employed in Installation, Maintenance & Repair in California is 2.6%.
What is the Percentage of Population Employed in Installation, Maintenance & Repair in the United States?
Percentage of Population Employed in Installation, Maintenance & Repair in the United States is 3.1%.