Cities with the Highest Percentage of Population Employed in Management in California
RELATED REPORTS & OPTIONS
Management
California
Compare Cities
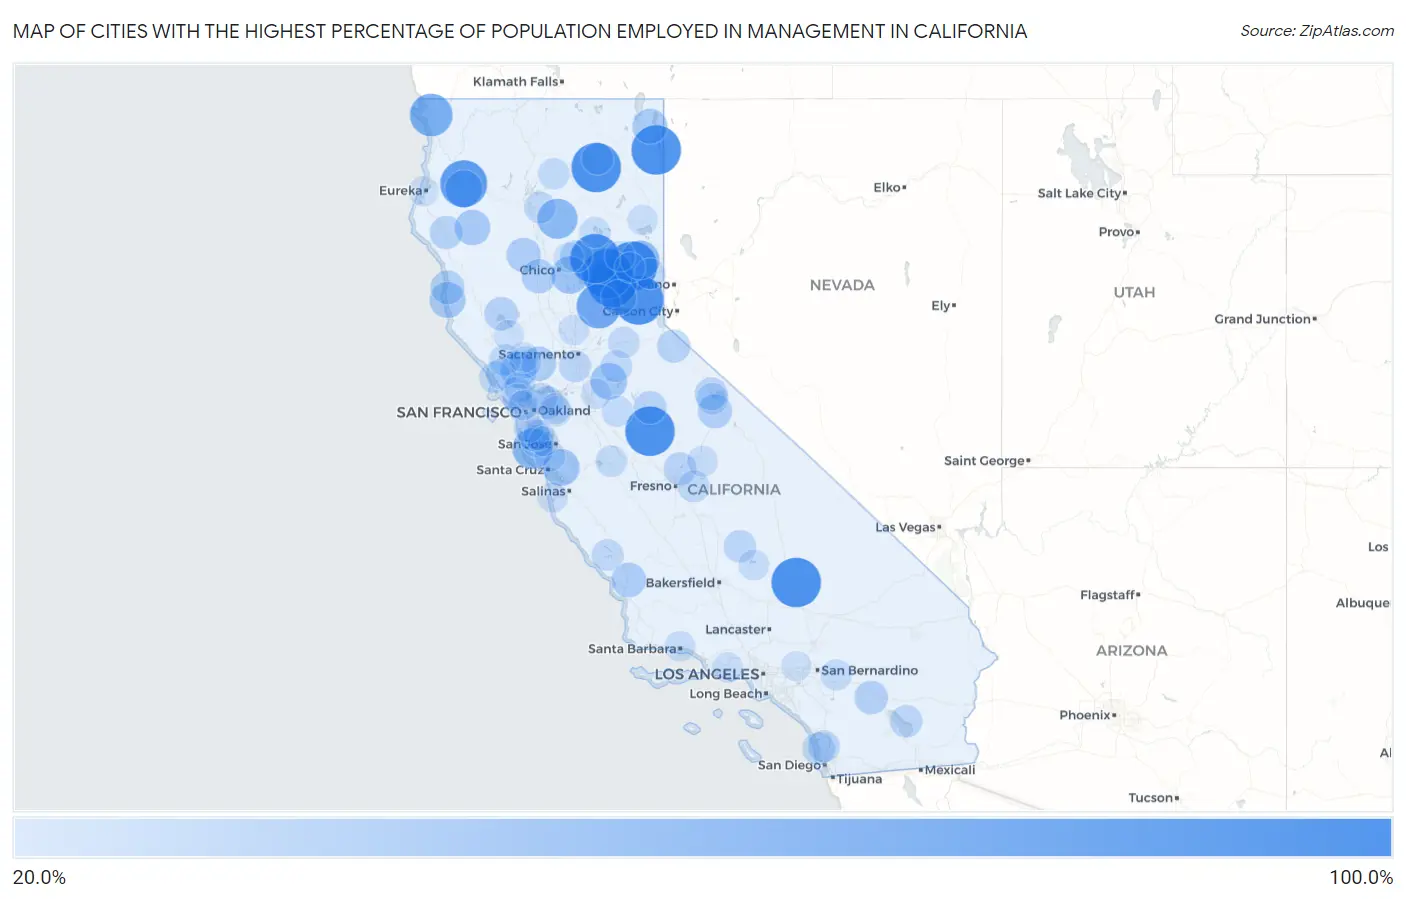
Map of Cities with the Highest Percentage of Population Employed in Management in California
0.0%
100.0%
Cities with the Highest Percentage of Population Employed in Management in California
| City | % Employed | vs State | vs National | |
| 1. | Mabie | 100.0% | 11.2%(+88.8)#1 | 11.0%(+89.0)#6 |
| 2. | Post Mountain | 100.0% | 11.2%(+88.8)#2 | 11.0%(+89.0)#15 |
| 3. | Kingvale | 100.0% | 11.2%(+88.8)#3 | 11.0%(+89.0)#17 |
| 4. | Goodyears Bar | 100.0% | 11.2%(+88.8)#5 | 11.0%(+89.0)#24 |
| 5. | Randsburg | 100.0% | 11.2%(+88.8)#6 | 11.0%(+89.0)#25 |
| 6. | Hornitos | 100.0% | 11.2%(+88.8)#7 | 11.0%(+89.0)#32 |
| 7. | La Porte | 100.0% | 11.2%(+88.8)#8 | 11.0%(+89.0)#33 |
| 8. | Nubieber | 100.0% | 11.2%(+88.8)#9 | 11.0%(+89.0)#39 |
| 9. | Tancred | 100.0% | 11.2%(+88.8)#10 | 11.0%(+89.0)#40 |
| 10. | Bucks Lake | 100.0% | 11.2%(+88.8)#11 | 11.0%(+89.0)#52 |
| 11. | Eagleville | 100.0% | 11.2%(+88.8)#12 | 11.0%(+89.0)#58 |
| 12. | Trinity Village | 89.8% | 11.2%(+78.6)#13 | 11.0%(+78.8)#78 |
| 13. | Choctaw Valley | 82.8% | 11.2%(+71.6)#14 | 11.0%(+71.7)#84 |
| 14. | Rough And Ready | 79.4% | 11.2%(+68.2)#15 | 11.0%(+68.4)#88 |
| 15. | Yosemite West | 78.6% | 11.2%(+67.4)#16 | 11.0%(+67.6)#90 |
| 16. | Hiouchi | 73.5% | 11.2%(+62.3)#17 | 11.0%(+62.4)#100 |
| 17. | Loma Mar | 64.1% | 11.2%(+52.9)#18 | 11.0%(+53.1)#129 |
| 18. | Manton | 63.6% | 11.2%(+52.4)#19 | 11.0%(+52.6)#131 |
| 19. | Beckwourth | 59.9% | 11.2%(+48.7)#20 | 11.0%(+48.9)#152 |
| 20. | Williams Canyon | 55.6% | 11.2%(+44.4)#21 | 11.0%(+44.5)#184 |
| 21. | Butte Valley | 54.1% | 11.2%(+42.9)#22 | 11.0%(+43.0)#198 |
| 22. | Burnt Ranch | 53.2% | 11.2%(+42.1)#23 | 11.0%(+42.2)#207 |
| 23. | Corralitos | 51.4% | 11.2%(+40.2)#24 | 11.0%(+40.3)#220 |
| 24. | Olde Stockdale | 51.2% | 11.2%(+40.1)#25 | 11.0%(+40.2)#222 |
| 25. | Wallace | 50.8% | 11.2%(+39.6)#26 | 11.0%(+39.8)#227 |
| 26. | Glen Ellen | 48.5% | 11.2%(+37.3)#27 | 11.0%(+37.5)#273 |
| 27. | Mendocino | 47.6% | 11.2%(+36.4)#28 | 11.0%(+36.5)#287 |
| 28. | Ruth | 46.4% | 11.2%(+35.2)#29 | 11.0%(+35.4)#305 |
| 29. | Washington | 46.1% | 11.2%(+34.9)#30 | 11.0%(+35.0)#311 |
| 30. | Lake City | 45.0% | 11.2%(+33.8)#31 | 11.0%(+34.0)#330 |
| 31. | Garden Farms | 43.2% | 11.2%(+32.0)#32 | 11.0%(+32.1)#360 |
| 32. | Moskowite Corner | 42.9% | 11.2%(+31.7)#33 | 11.0%(+31.8)#366 |
| 33. | Flournoy | 42.9% | 11.2%(+31.7)#34 | 11.0%(+31.8)#367 |
| 34. | Artois | 41.7% | 11.2%(+30.5)#35 | 11.0%(+30.6)#394 |
| 35. | Jovista | 41.7% | 11.2%(+30.5)#36 | 11.0%(+30.6)#397 |
| 36. | June Lake | 41.2% | 11.2%(+30.0)#37 | 11.0%(+30.2)#408 |
| 37. | Bear Valley Cdp Mariposa County | 41.0% | 11.2%(+29.8)#38 | 11.0%(+30.0)#413 |
| 38. | Cleone | 40.5% | 11.2%(+29.3)#39 | 11.0%(+29.5)#423 |
| 39. | Nice | 39.6% | 11.2%(+28.4)#40 | 11.0%(+28.6)#449 |
| 40. | Indian Wells | 39.5% | 11.2%(+28.3)#41 | 11.0%(+28.5)#452 |
| 41. | Miranda | 38.5% | 11.2%(+27.3)#42 | 11.0%(+27.4)#476 |
| 42. | Groveland | 37.6% | 11.2%(+26.4)#43 | 11.0%(+26.6)#496 |
| 43. | Markleeville | 37.5% | 11.2%(+26.3)#44 | 11.0%(+26.5)#500 |
| 44. | Mono City | 36.9% | 11.2%(+25.7)#45 | 11.0%(+25.9)#524 |
| 45. | Friant | 36.3% | 11.2%(+25.1)#46 | 11.0%(+25.2)#552 |
| 46. | Del Mar | 36.2% | 11.2%(+25.0)#47 | 11.0%(+25.2)#556 |
| 47. | California Hot Springs | 35.7% | 11.2%(+24.5)#48 | 11.0%(+24.7)#582 |
| 48. | Portola Valley | 35.5% | 11.2%(+24.4)#49 | 11.0%(+24.5)#589 |
| 49. | Bombay Beach | 35.0% | 11.2%(+23.8)#50 | 11.0%(+24.0)#610 |
| 50. | Emerald Lake Hills | 34.8% | 11.2%(+23.6)#51 | 11.0%(+23.8)#616 |
| 51. | Shell Ridge | 34.6% | 11.2%(+23.4)#52 | 11.0%(+23.6)#631 |
| 52. | Stirling City | 34.5% | 11.2%(+23.3)#53 | 11.0%(+23.4)#638 |
| 53. | Fairbanks Ranch | 33.9% | 11.2%(+22.7)#54 | 11.0%(+22.8)#655 |
| 54. | Clarksburg | 33.8% | 11.2%(+22.6)#55 | 11.0%(+22.8)#656 |
| 55. | Minkler | 33.6% | 11.2%(+22.4)#56 | 11.0%(+22.6)#665 |
| 56. | Dillon Beach | 33.3% | 11.2%(+22.1)#57 | 11.0%(+22.3)#672 |
| 57. | Oak Shores | 33.3% | 11.2%(+22.1)#58 | 11.0%(+22.3)#677 |
| 58. | Rutherford | 33.3% | 11.2%(+22.1)#59 | 11.0%(+22.3)#678 |
| 59. | Lookout | 33.3% | 11.2%(+22.1)#60 | 11.0%(+22.3)#688 |
| 60. | Amador City | 33.1% | 11.2%(+21.9)#61 | 11.0%(+22.1)#711 |
| 61. | Millville | 32.9% | 11.2%(+21.8)#62 | 11.0%(+21.9)#715 |
| 62. | Lee Vining | 32.9% | 11.2%(+21.7)#63 | 11.0%(+21.9)#717 |
| 63. | Alhambra Valley | 32.9% | 11.2%(+21.7)#64 | 11.0%(+21.9)#718 |
| 64. | Fulton | 32.7% | 11.2%(+21.6)#65 | 11.0%(+21.7)#732 |
| 65. | Bear Valley Cdp Alpine County | 32.6% | 11.2%(+21.4)#66 | 11.0%(+21.6)#739 |
| 66. | Volta | 32.4% | 11.2%(+21.2)#67 | 11.0%(+21.4)#746 |
| 67. | Camino | 32.2% | 11.2%(+21.0)#68 | 11.0%(+21.1)#761 |
| 68. | Big Bend | 31.8% | 11.2%(+20.6)#69 | 11.0%(+20.8)#779 |
| 69. | Bloomfield | 31.7% | 11.2%(+20.5)#70 | 11.0%(+20.6)#792 |
| 70. | Lucas Valley Marinwood | 31.0% | 11.2%(+19.8)#71 | 11.0%(+20.0)#829 |
| 71. | Baywood Park | 30.9% | 11.2%(+19.8)#72 | 11.0%(+19.9)#835 |
| 72. | Oak Glen | 30.9% | 11.2%(+19.7)#73 | 11.0%(+19.9)#836 |
| 73. | Black Point Green Point | 30.6% | 11.2%(+19.4)#74 | 11.0%(+19.6)#856 |
| 74. | East Oakdale | 30.4% | 11.2%(+19.2)#75 | 11.0%(+19.4)#874 |
| 75. | Lake Almanor West | 30.3% | 11.2%(+19.1)#76 | 11.0%(+19.2)#884 |
| 76. | Camino Tassajara | 29.7% | 11.2%(+18.6)#77 | 11.0%(+18.7)#919 |
| 77. | Blackhawk | 29.6% | 11.2%(+18.4)#78 | 11.0%(+18.6)#924 |
| 78. | Squirrel Mountain Valley | 29.6% | 11.2%(+18.4)#79 | 11.0%(+18.6)#928 |
| 79. | Shaver Lake | 29.5% | 11.2%(+18.4)#80 | 11.0%(+18.5)#929 |
| 80. | Loyalton | 29.5% | 11.2%(+18.3)#81 | 11.0%(+18.5)#934 |
| 81. | Lexington Hills | 29.3% | 11.2%(+18.1)#82 | 11.0%(+18.3)#956 |
| 82. | Mission Canyon | 29.3% | 11.2%(+18.1)#83 | 11.0%(+18.3)#957 |
| 83. | Lake Sherwood | 28.8% | 11.2%(+17.6)#84 | 11.0%(+17.8)#996 |
| 84. | Nicolaus | 28.6% | 11.2%(+17.4)#85 | 11.0%(+17.6)#1,016 |
| 85. | St Helena | 28.5% | 11.2%(+17.3)#86 | 11.0%(+17.5)#1,036 |
| 86. | Waterloo | 28.4% | 11.2%(+17.3)#87 | 11.0%(+17.4)#1,037 |
| 87. | Sausalito | 28.4% | 11.2%(+17.2)#88 | 11.0%(+17.4)#1,046 |
| 88. | Litchfield | 28.4% | 11.2%(+17.2)#89 | 11.0%(+17.3)#1,050 |
| 89. | Greenhorn | 28.3% | 11.2%(+17.1)#90 | 11.0%(+17.3)#1,054 |
| 90. | Atherton | 28.3% | 11.2%(+17.1)#91 | 11.0%(+17.3)#1,056 |
| 91. | Del Monte Forest | 28.1% | 11.2%(+17.0)#92 | 11.0%(+17.1)#1,075 |
| 92. | Clio | 27.8% | 11.2%(+16.6)#93 | 11.0%(+16.8)#1,113 |
| 93. | Hillsborough | 27.7% | 11.2%(+16.6)#94 | 11.0%(+16.7)#1,117 |
| 94. | Ross | 27.7% | 11.2%(+16.5)#95 | 11.0%(+16.7)#1,119 |
| 95. | Cobb | 27.5% | 11.2%(+16.3)#96 | 11.0%(+16.5)#1,139 |
| 96. | Forest Ranch | 27.4% | 11.2%(+16.2)#97 | 11.0%(+16.4)#1,149 |
| 97. | San Antonio Heights | 27.4% | 11.2%(+16.2)#98 | 11.0%(+16.3)#1,150 |
| 98. | Tiburon | 27.2% | 11.2%(+16.0)#99 | 11.0%(+16.2)#1,165 |
| 99. | Fairhaven | 27.1% | 11.2%(+16.0)#100 | 11.0%(+16.1)#1,176 |
| 100. | Los Altos | 27.1% | 11.2%(+15.9)#101 | 11.0%(+16.1)#1,184 |
Common Questions
What are the Top 10 Cities with the Highest Percentage of Population Employed in Management in California?
Top 10 Cities with the Highest Percentage of Population Employed in Management in California are:
#1
100.0%
#2
100.0%
#3
100.0%
#4
100.0%
#5
100.0%
#6
100.0%
#7
100.0%
#8
100.0%
#9
100.0%
#10
89.8%
What city has the Highest Percentage of Population Employed in Management in California?
Mabie has the Highest Percentage of Population Employed in Management in California with 100.0%.
What is the Percentage of Population Employed in Management in the State of California?
Percentage of Population Employed in Management in California is 11.2%.
What is the Percentage of Population Employed in Management in the United States?
Percentage of Population Employed in Management in the United States is 11.0%.