Cities with the Highest Percentage of Nicaraguan Population in California
RELATED REPORTS & OPTIONS
Nicaraguan
California
Compare Cities
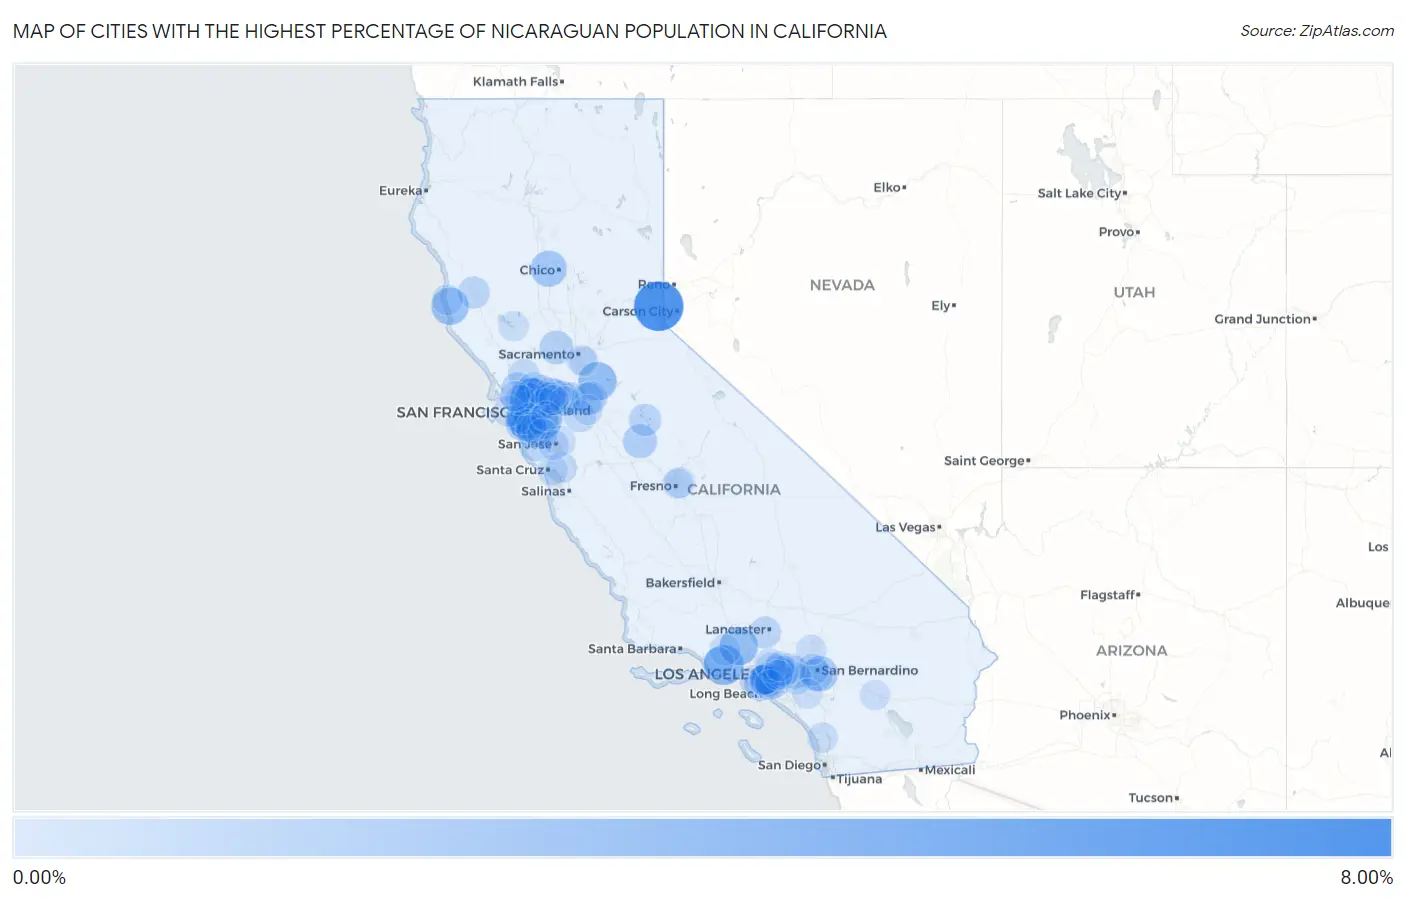
Map of Cities with the Highest Percentage of Nicaraguan Population in California
0.00%
8.00%
Cities with the Highest Percentage of Nicaraguan Population in California
| City | Nicaraguan | vs State | vs National | |
| 1. | Carnelian Bay | 7.68% | 0.29%(+7.39)#1 | 0.13%(+7.54)#21 |
| 2. | Rollingwood | 5.11% | 0.29%(+4.82)#2 | 0.13%(+4.98)#46 |
| 3. | Casa Conejo | 4.17% | 0.29%(+3.88)#3 | 0.13%(+4.03)#53 |
| 4. | Dogtown | 3.57% | 0.29%(+3.28)#4 | 0.13%(+3.44)#73 |
| 5. | Val Verde | 3.52% | 0.29%(+3.23)#5 | 0.13%(+3.39)#74 |
| 6. | Cherryland | 3.27% | 0.29%(+2.98)#6 | 0.13%(+3.14)#79 |
| 7. | Albion | 3.15% | 0.29%(+2.86)#7 | 0.13%(+3.02)#80 |
| 8. | Orange Blossom | 3.03% | 0.29%(+2.74)#8 | 0.13%(+2.89)#85 |
| 9. | Hamilton City | 2.69% | 0.29%(+2.40)#9 | 0.13%(+2.56)#97 |
| 10. | Colma | 2.69% | 0.29%(+2.40)#10 | 0.13%(+2.56)#98 |
| 11. | Reliez Valley | 2.66% | 0.29%(+2.38)#11 | 0.13%(+2.53)#102 |
| 12. | Daly City | 2.49% | 0.29%(+2.20)#12 | 0.13%(+2.36)#111 |
| 13. | Loma Linda | 2.48% | 0.29%(+2.19)#13 | 0.13%(+2.35)#112 |
| 14. | South San Francisco | 2.34% | 0.29%(+2.05)#14 | 0.13%(+2.20)#124 |
| 15. | San Pablo | 1.95% | 0.29%(+1.66)#15 | 0.13%(+1.81)#149 |
| 16. | University Of California Merced | 1.95% | 0.29%(+1.66)#16 | 0.13%(+1.81)#150 |
| 17. | Pacifica | 1.88% | 0.29%(+1.59)#17 | 0.13%(+1.74)#159 |
| 18. | Antioch | 1.83% | 0.29%(+1.55)#18 | 0.13%(+1.70)#163 |
| 19. | San Bruno | 1.83% | 0.29%(+1.54)#19 | 0.13%(+1.69)#164 |
| 20. | Monument Hills | 1.80% | 0.29%(+1.51)#20 | 0.13%(+1.66)#166 |
| 21. | North Richmond | 1.77% | 0.29%(+1.48)#21 | 0.13%(+1.63)#169 |
| 22. | Pinole | 1.71% | 0.29%(+1.42)#22 | 0.13%(+1.58)#175 |
| 23. | Cudahy | 1.65% | 0.29%(+1.36)#23 | 0.13%(+1.52)#182 |
| 24. | El Sobrante Cdp Contra Costa County | 1.62% | 0.29%(+1.33)#24 | 0.13%(+1.49)#187 |
| 25. | Montclair | 1.56% | 0.29%(+1.27)#25 | 0.13%(+1.43)#196 |
| 26. | Belmont | 1.53% | 0.29%(+1.25)#26 | 0.13%(+1.40)#198 |
| 27. | Lennox | 1.53% | 0.29%(+1.24)#27 | 0.13%(+1.39)#200 |
| 28. | Knightsen | 1.52% | 0.29%(+1.23)#28 | 0.13%(+1.39)#201 |
| 29. | Novato | 1.48% | 0.29%(+1.19)#29 | 0.13%(+1.35)#207 |
| 30. | Brisbane | 1.45% | 0.29%(+1.16)#30 | 0.13%(+1.32)#213 |
| 31. | Country Club | 1.41% | 0.29%(+1.13)#31 | 0.13%(+1.28)#223 |
| 32. | La Honda | 1.41% | 0.29%(+1.12)#32 | 0.13%(+1.27)#224 |
| 33. | Lake Don Pedro | 1.40% | 0.29%(+1.11)#33 | 0.13%(+1.27)#226 |
| 34. | August | 1.38% | 0.29%(+1.09)#34 | 0.13%(+1.24)#238 |
| 35. | Grand Terrace | 1.37% | 0.29%(+1.08)#35 | 0.13%(+1.23)#240 |
| 36. | West Athens | 1.33% | 0.29%(+1.04)#36 | 0.13%(+1.19)#248 |
| 37. | Bay Point | 1.32% | 0.29%(+1.03)#37 | 0.13%(+1.18)#253 |
| 38. | Millbrae | 1.28% | 0.29%(+0.994)#38 | 0.13%(+1.15)#257 |
| 39. | Quartz Hill | 1.27% | 0.29%(+0.979)#39 | 0.13%(+1.14)#260 |
| 40. | Willits | 1.27% | 0.29%(+0.979)#40 | 0.13%(+1.13)#261 |
| 41. | South Gate | 1.23% | 0.29%(+0.944)#41 | 0.13%(+1.10)#264 |
| 42. | Tracy | 1.19% | 0.29%(+0.904)#42 | 0.13%(+1.06)#269 |
| 43. | Irwindale | 1.19% | 0.29%(+0.902)#43 | 0.13%(+1.06)#270 |
| 44. | Sonoma | 1.17% | 0.29%(+0.879)#44 | 0.13%(+1.03)#276 |
| 45. | Rialto | 1.16% | 0.29%(+0.876)#45 | 0.13%(+1.03)#277 |
| 46. | Santa Fe Springs | 1.16% | 0.29%(+0.868)#46 | 0.13%(+1.02)#278 |
| 47. | Bell | 1.15% | 0.29%(+0.858)#47 | 0.13%(+1.01)#279 |
| 48. | Pittsburg | 1.13% | 0.29%(+0.841)#48 | 0.13%(+0.997)#287 |
| 49. | Bell Gardens | 1.11% | 0.29%(+0.821)#49 | 0.13%(+0.977)#294 |
| 50. | Chino | 1.08% | 0.29%(+0.794)#50 | 0.13%(+0.950)#303 |
| 51. | Walnut Park | 1.01% | 0.29%(+0.716)#51 | 0.13%(+0.872)#313 |
| 52. | La Verne | 0.99% | 0.29%(+0.697)#52 | 0.13%(+0.853)#320 |
| 53. | Fillmore | 0.98% | 0.29%(+0.695)#53 | 0.13%(+0.851)#322 |
| 54. | Redwood City | 0.97% | 0.29%(+0.682)#54 | 0.13%(+0.838)#327 |
| 55. | Huntington Park | 0.95% | 0.29%(+0.664)#55 | 0.13%(+0.820)#332 |
| 56. | Hayward | 0.94% | 0.29%(+0.654)#56 | 0.13%(+0.810)#336 |
| 57. | Old Stine | 0.94% | 0.29%(+0.652)#57 | 0.13%(+0.808)#337 |
| 58. | Broadmoor | 0.91% | 0.29%(+0.616)#58 | 0.13%(+0.772)#351 |
| 59. | Vallejo | 0.90% | 0.29%(+0.613)#59 | 0.13%(+0.769)#354 |
| 60. | Baldwin Park | 0.90% | 0.29%(+0.610)#60 | 0.13%(+0.766)#355 |
| 61. | Richmond | 0.90% | 0.29%(+0.609)#61 | 0.13%(+0.765)#356 |
| 62. | Hercules | 0.90% | 0.29%(+0.609)#62 | 0.13%(+0.765)#357 |
| 63. | Saranap | 0.90% | 0.29%(+0.607)#63 | 0.13%(+0.763)#358 |
| 64. | San Lorenzo | 0.89% | 0.29%(+0.605)#64 | 0.13%(+0.761)#359 |
| 65. | Corralitos | 0.88% | 0.29%(+0.593)#65 | 0.13%(+0.749)#368 |
| 66. | San Francisco | 0.87% | 0.29%(+0.579)#66 | 0.13%(+0.735)#372 |
| 67. | Downey | 0.86% | 0.29%(+0.573)#67 | 0.13%(+0.729)#377 |
| 68. | Alum Rock | 0.85% | 0.29%(+0.564)#68 | 0.13%(+0.720)#378 |
| 69. | West Covina | 0.83% | 0.29%(+0.539)#69 | 0.13%(+0.695)#390 |
| 70. | Mendocino | 0.82% | 0.29%(+0.531)#70 | 0.13%(+0.687)#395 |
| 71. | San Mateo | 0.81% | 0.29%(+0.524)#71 | 0.13%(+0.680)#399 |
| 72. | Maywood | 0.79% | 0.29%(+0.502)#72 | 0.13%(+0.658)#407 |
| 73. | Altadena | 0.76% | 0.29%(+0.474)#73 | 0.13%(+0.630)#416 |
| 74. | East Palo Alto | 0.76% | 0.29%(+0.469)#74 | 0.13%(+0.626)#418 |
| 75. | Larkspur | 0.74% | 0.29%(+0.451)#75 | 0.13%(+0.607)#425 |
| 76. | Lake San Marcos | 0.74% | 0.29%(+0.446)#76 | 0.13%(+0.602)#426 |
| 77. | Concord | 0.73% | 0.29%(+0.444)#77 | 0.13%(+0.600)#428 |
| 78. | Benicia | 0.73% | 0.29%(+0.443)#78 | 0.13%(+0.599)#429 |
| 79. | Capitola | 0.73% | 0.29%(+0.436)#79 | 0.13%(+0.592)#434 |
| 80. | Tarpey Village | 0.72% | 0.29%(+0.431)#80 | 0.13%(+0.587)#437 |
| 81. | Fairfax | 0.71% | 0.29%(+0.424)#81 | 0.13%(+0.580)#439 |
| 82. | Covina | 0.71% | 0.29%(+0.420)#82 | 0.13%(+0.577)#441 |
| 83. | Oak Hills | 0.69% | 0.29%(+0.400)#83 | 0.13%(+0.556)#452 |
| 84. | Burbank | 0.69% | 0.29%(+0.398)#84 | 0.13%(+0.555)#454 |
| 85. | San Pasqual | 0.67% | 0.29%(+0.383)#85 | 0.13%(+0.539)#462 |
| 86. | Florence Graham | 0.65% | 0.29%(+0.365)#86 | 0.13%(+0.521)#475 |
| 87. | Brentwood | 0.65% | 0.29%(+0.362)#87 | 0.13%(+0.518)#477 |
| 88. | Bellflower | 0.65% | 0.29%(+0.360)#88 | 0.13%(+0.516)#478 |
| 89. | Mayfair | 0.65% | 0.29%(+0.359)#89 | 0.13%(+0.515)#479 |
| 90. | Camarillo | 0.64% | 0.29%(+0.355)#90 | 0.13%(+0.511)#481 |
| 91. | Clearlake | 0.64% | 0.29%(+0.355)#91 | 0.13%(+0.511)#482 |
| 92. | Bermuda Dunes | 0.64% | 0.29%(+0.354)#92 | 0.13%(+0.510)#484 |
| 93. | Temescal Valley | 0.63% | 0.29%(+0.341)#93 | 0.13%(+0.497)#493 |
| 94. | Lathrop | 0.63% | 0.29%(+0.338)#94 | 0.13%(+0.494)#497 |
| 95. | Castro Valley | 0.61% | 0.29%(+0.317)#95 | 0.13%(+0.473)#507 |
| 96. | Clayton | 0.60% | 0.29%(+0.307)#96 | 0.13%(+0.463)#514 |
| 97. | Parkway | 0.59% | 0.29%(+0.302)#97 | 0.13%(+0.458)#518 |
| 98. | Florin | 0.58% | 0.29%(+0.289)#98 | 0.13%(+0.445)#522 |
| 99. | Duarte | 0.58% | 0.29%(+0.287)#99 | 0.13%(+0.443)#524 |
| 100. | Avocado Heights | 0.57% | 0.29%(+0.282)#100 | 0.13%(+0.438)#529 |
Common Questions
What are the Top 10 Cities with the Highest Percentage of Nicaraguan Population in California?
Top 10 Cities with the Highest Percentage of Nicaraguan Population in California are:
#1
7.68%
#2
5.11%
#3
4.17%
#4
3.57%
#5
3.52%
#6
3.27%
#7
3.15%
#8
2.69%
#9
2.69%
#10
2.66%
What city has the Highest Percentage of Nicaraguan Population in California?
Carnelian Bay has the Highest Percentage of Nicaraguan Population in California with 7.68%.
What is the Percentage of Nicaraguan Population in the State of California?
Percentage of Nicaraguan Population in California is 0.29%.
What is the Percentage of Nicaraguan Population in the United States?
Percentage of Nicaraguan Population in the United States is 0.13%.