Cities with the Highest Percentage of Black / African American Population in California
RELATED REPORTS & OPTIONS
Black / African American
California
Compare Cities
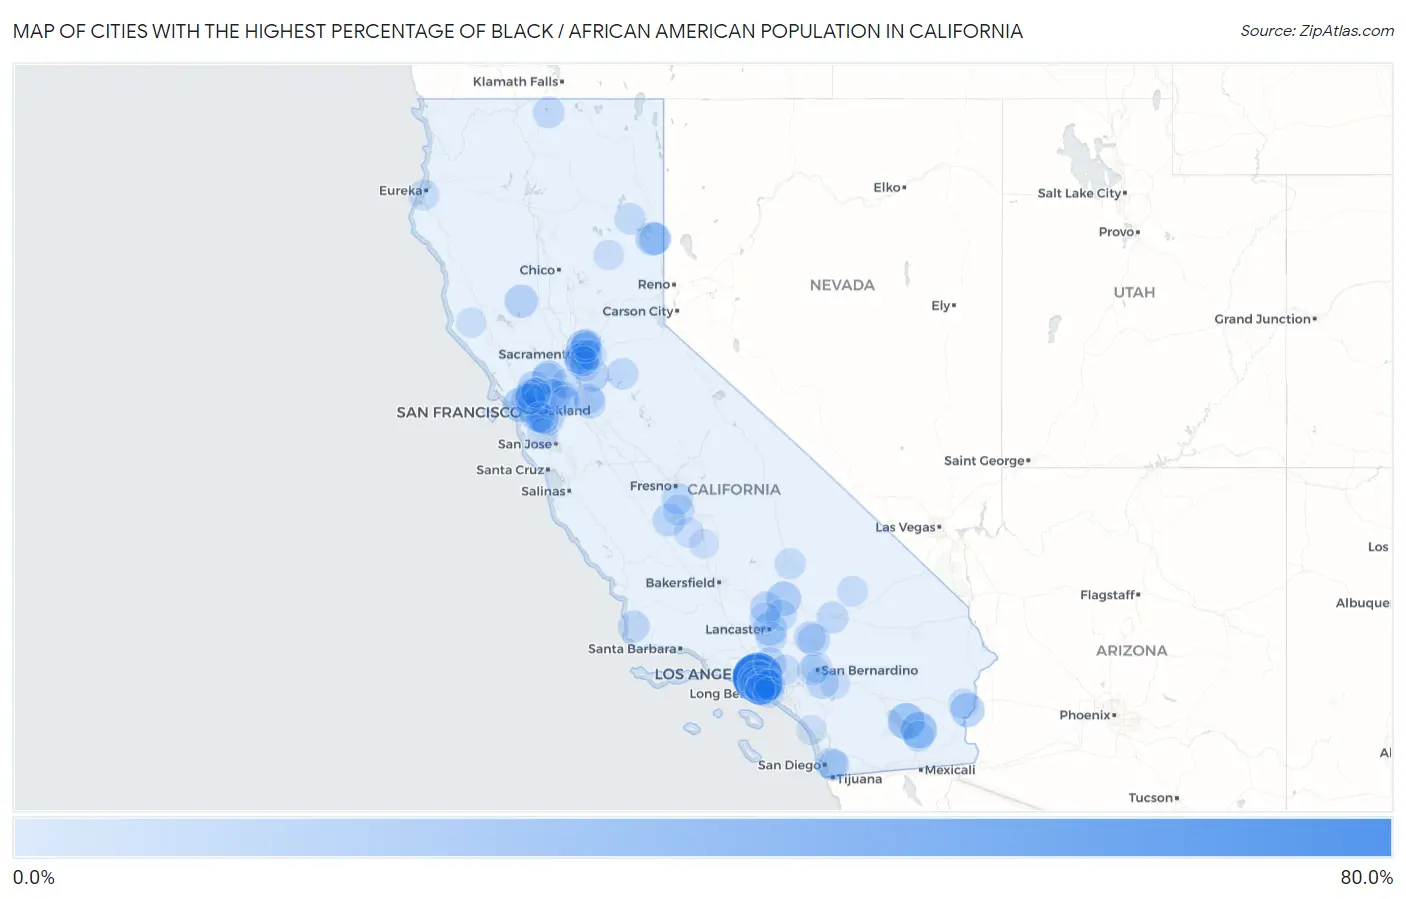
Map of Cities with the Highest Percentage of Black / African American Population in California
0.0%
80.0%
Cities with the Highest Percentage of Black / African American Population in California
| City | Black / African American | vs State | vs National | |
| 1. | View Park Windsor Hills | 73.7% | 5.6%(+68.1)#1 | 12.5%(+61.3)#536 |
| 2. | Ladera Heights | 64.2% | 5.6%(+58.6)#2 | 12.5%(+51.8)#762 |
| 3. | West Athens | 55.4% | 5.6%(+49.8)#3 | 12.5%(+42.9)#1,052 |
| 4. | West Rancho Dominguez | 41.5% | 5.6%(+35.9)#4 | 12.5%(+29.1)#1,655 |
| 5. | Inglewood | 39.5% | 5.6%(+33.9)#5 | 12.5%(+27.1)#1,771 |
| 6. | Westmont | 36.4% | 5.6%(+30.8)#6 | 12.5%(+24.0)#1,944 |
| 7. | Salyer | 36.0% | 5.6%(+30.4)#7 | 12.5%(+23.5)#1,975 |
| 8. | Bombay Beach | 30.2% | 5.6%(+24.6)#8 | 12.5%(+17.7)#2,350 |
| 9. | Niland | 29.6% | 5.6%(+24.0)#9 | 12.5%(+17.1)#2,393 |
| 10. | Hawthorne | 26.1% | 5.6%(+20.5)#10 | 12.5%(+13.6)#2,647 |
| 11. | Mcclellan Park | 25.5% | 5.6%(+19.9)#11 | 12.5%(+13.0)#2,713 |
| 12. | Compton | 25.4% | 5.6%(+19.8)#12 | 12.5%(+13.0)#2,719 |
| 13. | Marin City | 24.0% | 5.6%(+18.4)#13 | 12.5%(+11.6)#2,852 |
| 14. | California City | 23.8% | 5.6%(+18.2)#14 | 12.5%(+11.3)#2,869 |
| 15. | Ripley | 22.8% | 5.6%(+17.2)#15 | 12.5%(+10.3)#2,991 |
| 16. | Carson | 22.5% | 5.6%(+16.9)#16 | 12.5%(+9.99)#3,024 |
| 17. | Suisun City | 22.1% | 5.6%(+16.5)#17 | 12.5%(+9.58)#3,070 |
| 18. | Oakland | 21.8% | 5.6%(+16.2)#18 | 12.5%(+9.32)#3,095 |
| 19. | Patton Village | 21.5% | 5.6%(+15.9)#19 | 12.5%(+8.99)#3,130 |
| 20. | Lancaster | 21.2% | 5.6%(+15.6)#20 | 12.5%(+8.70)#3,167 |
| 21. | Lodoga | 19.9% | 5.6%(+14.3)#21 | 12.5%(+7.43)#3,323 |
| 22. | Gardena | 19.8% | 5.6%(+14.2)#22 | 12.5%(+7.34)#3,331 |
| 23. | Fruitridge Pocket | 19.8% | 5.6%(+14.2)#23 | 12.5%(+7.33)#3,334 |
| 24. | Hercules | 19.5% | 5.6%(+13.9)#24 | 12.5%(+7.05)#3,358 |
| 25. | Antioch | 19.5% | 5.6%(+13.9)#25 | 12.5%(+7.05)#3,360 |
| 26. | Parkway | 19.0% | 5.6%(+13.4)#26 | 12.5%(+6.53)#3,423 |
| 27. | Herald | 18.9% | 5.6%(+13.3)#27 | 12.5%(+6.39)#3,444 |
| 28. | Willowbrook | 18.5% | 5.6%(+12.9)#28 | 12.5%(+6.07)#3,499 |
| 29. | Vallejo | 18.3% | 5.6%(+12.7)#29 | 12.5%(+5.87)#3,526 |
| 30. | Richmond | 18.3% | 5.6%(+12.7)#30 | 12.5%(+5.83)#3,537 |
| 31. | Fairview | 18.3% | 5.6%(+12.7)#31 | 12.5%(+5.82)#3,539 |
| 32. | Altadena | 18.2% | 5.6%(+12.6)#32 | 12.5%(+5.76)#3,548 |
| 33. | North Richmond | 18.2% | 5.6%(+12.6)#33 | 12.5%(+5.74)#3,552 |
| 34. | Herlong | 17.7% | 5.6%(+12.1)#34 | 12.5%(+5.19)#3,622 |
| 35. | Emeryville | 17.7% | 5.6%(+12.1)#35 | 12.5%(+5.19)#3,623 |
| 36. | Moreno Valley | 17.6% | 5.6%(+12.0)#36 | 12.5%(+5.12)#3,633 |
| 37. | Lemoore Station | 17.5% | 5.6%(+11.9)#37 | 12.5%(+4.99)#3,652 |
| 38. | Victorville | 17.2% | 5.6%(+11.6)#38 | 12.5%(+4.70)#3,699 |
| 39. | Mojave | 16.6% | 5.6%(+11.0)#39 | 12.5%(+4.14)#3,797 |
| 40. | Ashland | 16.1% | 5.6%(+10.5)#40 | 12.5%(+3.60)#3,899 |
| 41. | Taft Mosswood | 15.5% | 5.6%(+9.90)#41 | 12.5%(+3.03)#3,997 |
| 42. | Lemon Grove | 15.5% | 5.6%(+9.89)#42 | 12.5%(+3.01)#4,000 |
| 43. | Barstow | 15.3% | 5.6%(+9.74)#43 | 12.5%(+2.87)#4,030 |
| 44. | Fairfield | 15.3% | 5.6%(+9.70)#44 | 12.5%(+2.83)#4,033 |
| 45. | Rosemont | 15.3% | 5.6%(+9.70)#45 | 12.5%(+2.83)#4,034 |
| 46. | Adelanto | 15.3% | 5.6%(+9.68)#46 | 12.5%(+2.81)#4,043 |
| 47. | Pittsburg | 15.2% | 5.6%(+9.58)#47 | 12.5%(+2.71)#4,060 |
| 48. | Vandenberg Afb | 15.2% | 5.6%(+9.56)#48 | 12.5%(+2.69)#4,066 |
| 49. | Monmouth | 14.9% | 5.6%(+9.25)#49 | 12.5%(+2.38)#4,133 |
| 50. | Macdoel | 14.7% | 5.6%(+9.09)#50 | 12.5%(+2.22)#4,164 |
| 51. | Mokelumne Hill | 14.6% | 5.6%(+9.01)#51 | 12.5%(+2.13)#4,184 |
| 52. | Hardwick | 14.4% | 5.6%(+8.78)#52 | 12.5%(+1.90)#4,226 |
| 53. | Rodeo | 14.2% | 5.6%(+8.62)#53 | 12.5%(+1.75)#4,258 |
| 54. | Susanville | 13.7% | 5.6%(+8.11)#54 | 12.5%(+1.24)#4,352 |
| 55. | La Presa | 13.6% | 5.6%(+8.05)#55 | 12.5%(+1.18)#4,365 |
| 56. | East Rancho Dominguez | 13.3% | 5.6%(+7.74)#56 | 12.5%(+0.871)#4,434 |
| 57. | Edwards Afb | 13.2% | 5.6%(+7.62)#57 | 12.5%(+0.744)#4,467 |
| 58. | Spring Valley Cdp San Diego County | 13.0% | 5.6%(+7.45)#58 | 12.5%(+0.571)#4,508 |
| 59. | East Palo Alto | 13.0% | 5.6%(+7.36)#59 | 12.5%(+0.487)#4,522 |
| 60. | China Lake Acres | 12.9% | 5.6%(+7.32)#60 | 12.5%(+0.444)#4,533 |
| 61. | Alhambra Valley | 12.6% | 5.6%(+7.05)#61 | 12.5%(+0.180)#4,588 |
| 62. | Calipatria | 12.6% | 5.6%(+7.03)#62 | 12.5%(+0.161)#4,591 |
| 63. | Sacramento | 12.6% | 5.6%(+7.00)#63 | 12.5%(+0.131)#4,602 |
| 64. | Foothill Farms | 12.6% | 5.6%(+7.00)#64 | 12.5%(+0.130)#4,603 |
| 65. | San Bernardino | 12.3% | 5.6%(+6.75)#65 | 12.5%(-0.122)#4,666 |
| 66. | Palmdale | 12.3% | 5.6%(+6.66)#66 | 12.5%(-0.216)#4,695 |
| 67. | Bellflower | 12.2% | 5.6%(+6.64)#67 | 12.5%(-0.234)#4,700 |
| 68. | Rialto | 12.2% | 5.6%(+6.58)#68 | 12.5%(-0.292)#4,719 |
| 69. | Fort Irwin | 12.1% | 5.6%(+6.51)#69 | 12.5%(-0.359)#4,737 |
| 70. | Fields Landing | 12.1% | 5.6%(+6.49)#70 | 12.5%(-0.388)#4,748 |
| 71. | Long Beach | 12.0% | 5.6%(+6.44)#71 | 12.5%(-0.438)#4,753 |
| 72. | Pinole | 11.8% | 5.6%(+6.23)#72 | 12.5%(-0.642)#4,793 |
| 73. | Blythe | 11.8% | 5.6%(+6.21)#73 | 12.5%(-0.659)#4,796 |
| 74. | Stockton | 11.6% | 5.6%(+6.05)#74 | 12.5%(-0.828)#4,839 |
| 75. | Cherryland | 11.6% | 5.6%(+6.04)#75 | 12.5%(-0.837)#4,843 |
| 76. | San Pablo | 11.5% | 5.6%(+5.87)#76 | 12.5%(-1.01)#4,885 |
| 77. | Charter Oak | 11.4% | 5.6%(+5.83)#77 | 12.5%(-1.04)#4,894 |
| 78. | Rosamond | 11.4% | 5.6%(+5.77)#78 | 12.5%(-1.11)#4,911 |
| 79. | Camp Pendleton Mainside | 11.3% | 5.6%(+5.73)#79 | 12.5%(-1.15)#4,920 |
| 80. | El Centro Naval Air Facility | 11.3% | 5.6%(+5.72)#80 | 12.5%(-1.15)#4,923 |
| 81. | Rio Vista | 11.3% | 5.6%(+5.68)#81 | 12.5%(-1.19)#4,934 |
| 82. | La Riviera | 11.3% | 5.6%(+5.65)#82 | 12.5%(-1.22)#4,944 |
| 83. | Elk Grove | 11.2% | 5.6%(+5.65)#83 | 12.5%(-1.22)#4,945 |
| 84. | Lemon Hill | 11.2% | 5.6%(+5.64)#84 | 12.5%(-1.23)#4,950 |
| 85. | Benton Park | 11.1% | 5.6%(+5.54)#85 | 12.5%(-1.33)#4,975 |
| 86. | Quincy | 11.0% | 5.6%(+5.37)#86 | 12.5%(-1.51)#5,024 |
| 87. | Rancho Cordova | 10.9% | 5.6%(+5.30)#87 | 12.5%(-1.57)#5,046 |
| 88. | Bay Point | 10.5% | 5.6%(+4.90)#88 | 12.5%(-1.97)#5,155 |
| 89. | Antelope | 10.4% | 5.6%(+4.80)#89 | 12.5%(-2.07)#5,184 |
| 90. | San Leandro | 10.4% | 5.6%(+4.80)#90 | 12.5%(-2.08)#5,185 |
| 91. | Corcoran | 10.3% | 5.6%(+4.75)#91 | 12.5%(-2.12)#5,207 |
| 92. | West Carson | 10.3% | 5.6%(+4.74)#92 | 12.5%(-2.14)#5,212 |
| 93. | Beaumont | 10.2% | 5.6%(+4.65)#93 | 12.5%(-2.22)#5,242 |
| 94. | Florin | 10.2% | 5.6%(+4.62)#94 | 12.5%(-2.25)#5,250 |
| 95. | Brentwood | 10.2% | 5.6%(+4.61)#95 | 12.5%(-2.26)#5,255 |
| 96. | Crockett | 10.2% | 5.6%(+4.56)#96 | 12.5%(-2.31)#5,269 |
| 97. | Camp Pendleton South | 9.9% | 5.6%(+4.34)#97 | 12.5%(-2.53)#5,345 |
| 98. | North Highlands | 9.9% | 5.6%(+4.31)#98 | 12.5%(-2.56)#5,355 |
| 99. | Boonville | 9.8% | 5.6%(+4.25)#99 | 12.5%(-2.62)#5,368 |
| 100. | Teviston | 9.6% | 5.6%(+4.04)#100 | 12.5%(-2.84)#5,434 |
Common Questions
What are the Top 10 Cities with the Highest Percentage of Black / African American Population in California?
Top 10 Cities with the Highest Percentage of Black / African American Population in California are:
#1
73.7%
#2
64.2%
#3
55.4%
#4
41.5%
#5
39.5%
#6
36.4%
#7
30.2%
#8
29.6%
#9
26.1%
#10
25.5%
What city has the Highest Percentage of Black / African American Population in California?
View Park Windsor Hills has the Highest Percentage of Black / African American Population in California with 73.7%.
What is the Percentage of Black / African American Population in the State of California?
Percentage of Black / African American Population in California is 5.6%.
What is the Percentage of Black / African American Population in the United States?
Percentage of Black / African American Population in the United States is 12.5%.