Zip Codes with the Highest Percentage of Population Employed in Installation, Maintenance & Repair in Grass Valley, CA
RELATED REPORTS & OPTIONS
Installation, Maintenance & Repair
Grass Valley
Compare Zip Codes
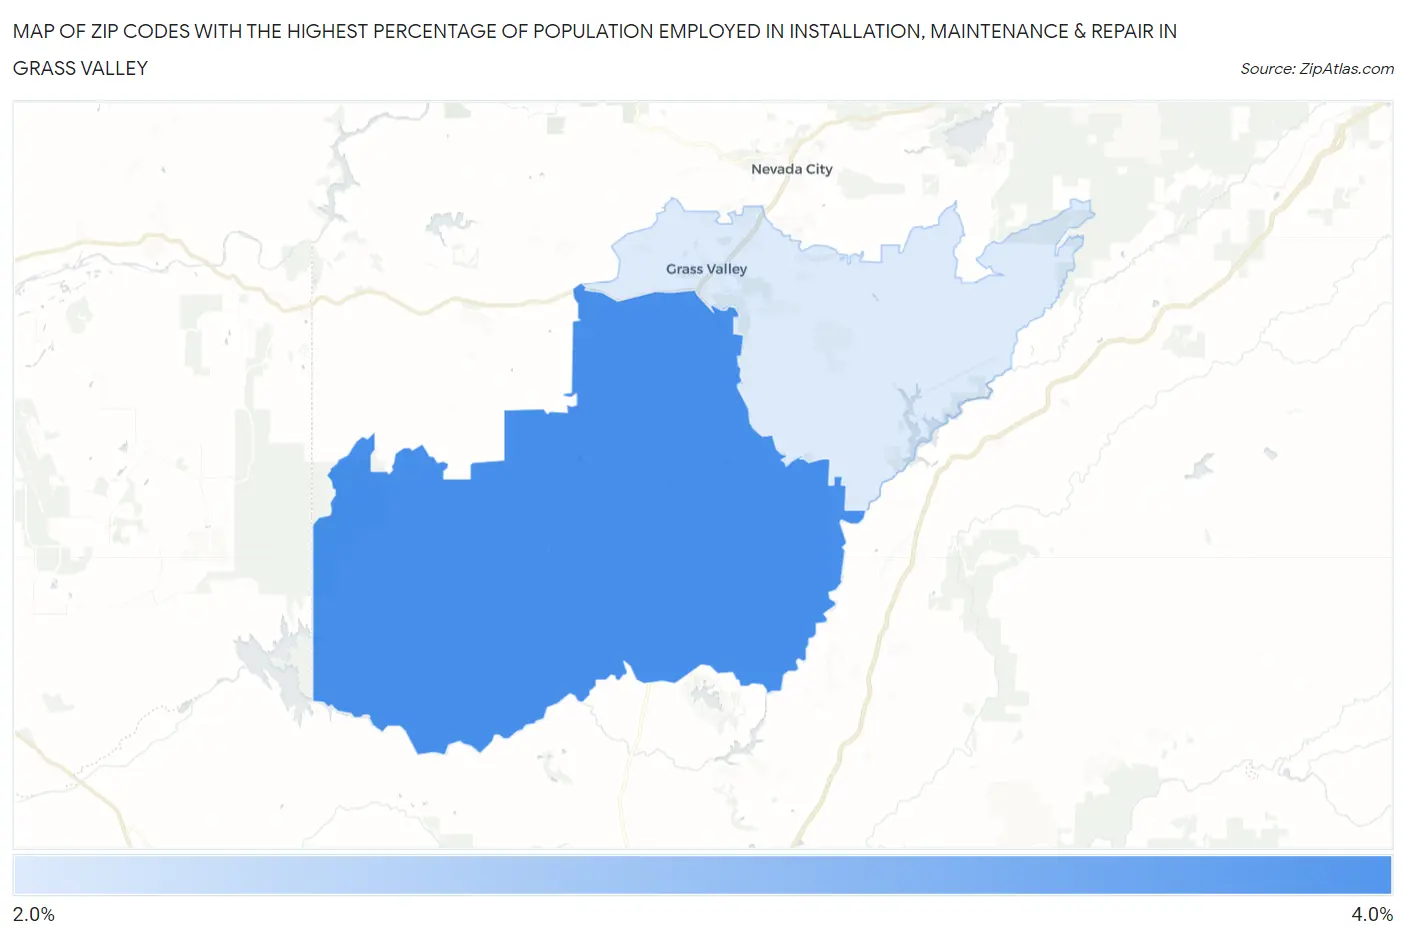
Map of Zip Codes with the Highest Percentage of Population Employed in Installation, Maintenance & Repair in Grass Valley
2.8%
3.6%
Zip Codes with the Highest Percentage of Population Employed in Installation, Maintenance & Repair in Grass Valley, CA
| Zip Code | % Employed | vs State | vs National | |
| 1. | 95949 | 3.6% | 2.6%(+1.03)#431 | 3.1%(+0.523)#14,192 |
| 2. | 95945 | 2.8% | 2.6%(+0.238)#669 | 3.1%(-0.274)#18,047 |
1
Common Questions
What are the Top Zip Codes with the Highest Percentage of Population Employed in Installation, Maintenance & Repair in Grass Valley, CA?
Top Zip Codes with the Highest Percentage of Population Employed in Installation, Maintenance & Repair in Grass Valley, CA are:
What zip code has the Highest Percentage of Population Employed in Installation, Maintenance & Repair in Grass Valley, CA?
95949 has the Highest Percentage of Population Employed in Installation, Maintenance & Repair in Grass Valley, CA with 3.6%.
What is the Percentage of Population Employed in Installation, Maintenance & Repair in Grass Valley, CA?
Percentage of Population Employed in Installation, Maintenance & Repair in Grass Valley is 1.3%.
What is the Percentage of Population Employed in Installation, Maintenance & Repair in California?
Percentage of Population Employed in Installation, Maintenance & Repair in California is 2.6%.
What is the Percentage of Population Employed in Installation, Maintenance & Repair in the United States?
Percentage of Population Employed in Installation, Maintenance & Repair in the United States is 3.1%.