Cities with the Highest Percentage of Mexican American Indian Population in California
RELATED REPORTS & OPTIONS
Mexican American Indian
California
Compare Cities
Map of Cities with the Highest Percentage of Mexican American Indian Population in California
0.00%
60.00%
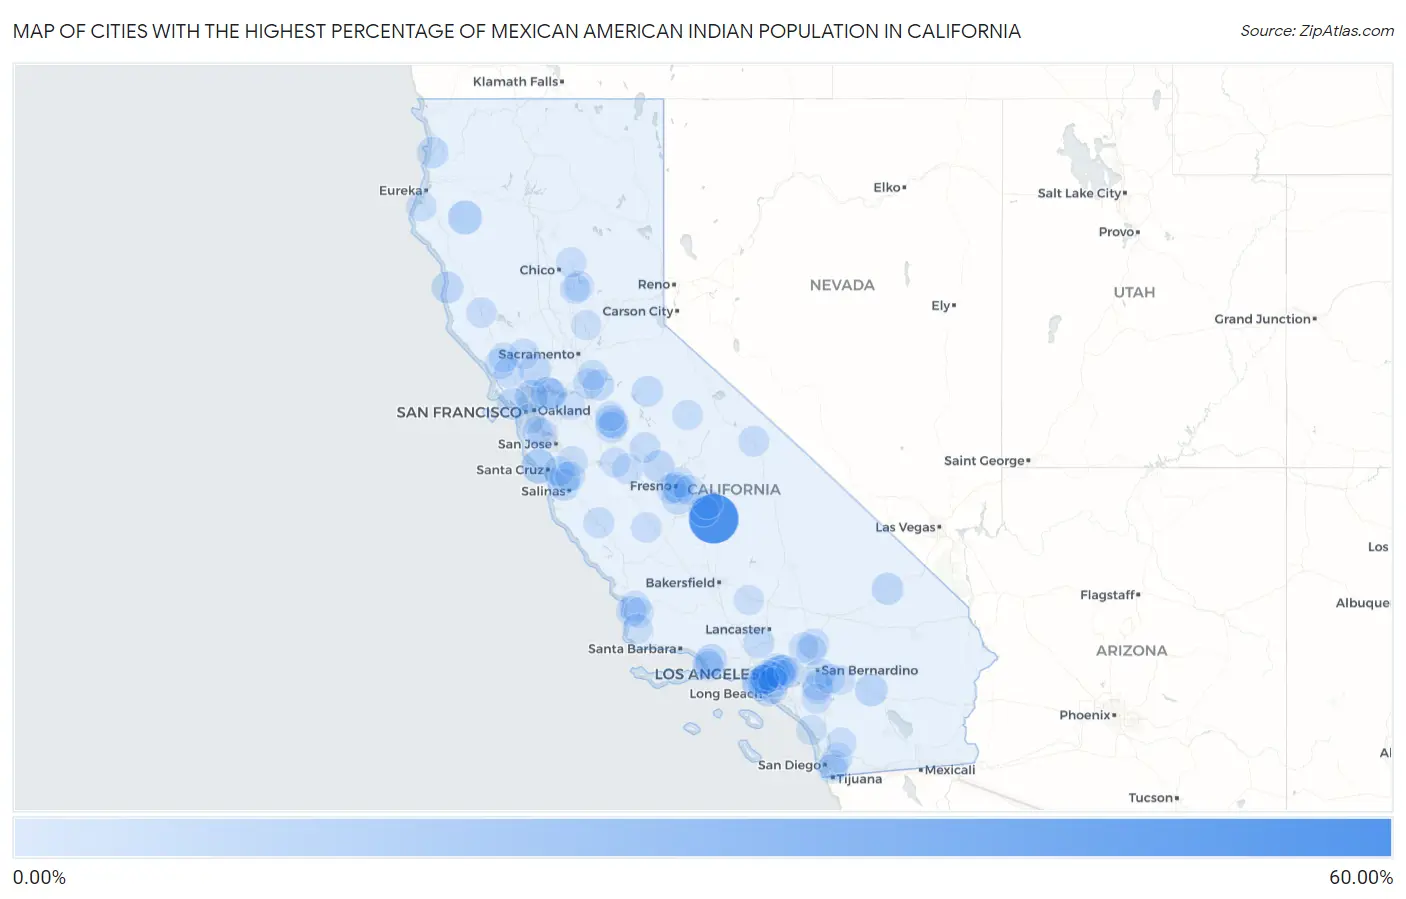
Cities with the Highest Percentage of Mexican American Indian Population in California
| City | Mexican American Indian | vs State | vs National | |
| 1. | Tooleville | 50.98% | 0.49%(+50.5)#1 | 0.16%(+50.8)#1 |
| 2. | San Miguel Cdp San Luis Obispo County | 12.48% | 0.49%(+12.0)#2 | 0.16%(+12.3)#11 |
| 3. | Davenport | 12.15% | 0.49%(+11.7)#3 | 0.16%(+12.0)#12 |
| 4. | Mad River | 10.56% | 0.49%(+10.1)#4 | 0.16%(+10.4)#18 |
| 5. | Clyde | 9.71% | 0.49%(+9.22)#5 | 0.16%(+9.55)#23 |
| 6. | Montalvin Manor | 8.06% | 0.49%(+7.58)#6 | 0.16%(+7.91)#32 |
| 7. | Thousand Palms | 7.12% | 0.49%(+6.64)#7 | 0.16%(+6.97)#38 |
| 8. | Baker | 5.79% | 0.49%(+5.30)#8 | 0.16%(+5.63)#54 |
| 9. | Silverado Resort | 5.53% | 0.49%(+5.05)#9 | 0.16%(+5.38)#57 |
| 10. | Empire | 5.31% | 0.49%(+4.83)#10 | 0.16%(+5.16)#59 |
| 11. | El Rio | 5.25% | 0.49%(+4.77)#11 | 0.16%(+5.09)#61 |
| 12. | Cleone | 5.17% | 0.49%(+4.68)#12 | 0.16%(+5.01)#63 |
| 13. | Madera Acres | 5.16% | 0.49%(+4.67)#13 | 0.16%(+5.00)#64 |
| 14. | Commerce | 5.14% | 0.49%(+4.66)#14 | 0.16%(+4.99)#65 |
| 15. | Stinson Beach | 5.12% | 0.49%(+4.64)#15 | 0.16%(+4.97)#66 |
| 16. | Monmouth | 4.95% | 0.49%(+4.47)#16 | 0.16%(+4.79)#70 |
| 17. | Castroville | 4.83% | 0.49%(+4.35)#17 | 0.16%(+4.68)#73 |
| 18. | Orick | 4.22% | 0.49%(+3.74)#18 | 0.16%(+4.06)#86 |
| 19. | Agua Dulce | 4.11% | 0.49%(+3.63)#19 | 0.16%(+3.96)#90 |
| 20. | Cedar Ridge | 3.94% | 0.49%(+3.45)#20 | 0.16%(+3.78)#99 |
| 21. | Keyes | 3.69% | 0.49%(+3.20)#21 | 0.16%(+3.53)#107 |
| 22. | Las Lomas | 3.60% | 0.49%(+3.11)#22 | 0.16%(+3.44)#111 |
| 23. | Lockeford | 3.47% | 0.49%(+2.98)#23 | 0.16%(+3.31)#117 |
| 24. | Baldwin Park | 3.31% | 0.49%(+2.82)#24 | 0.16%(+3.15)#123 |
| 25. | Planada | 3.03% | 0.49%(+2.55)#25 | 0.16%(+2.88)#136 |
| 26. | Bishop | 2.97% | 0.49%(+2.49)#26 | 0.16%(+2.82)#140 |
| 27. | Woodbridge | 2.95% | 0.49%(+2.46)#27 | 0.16%(+2.79)#141 |
| 28. | King City | 2.90% | 0.49%(+2.42)#28 | 0.16%(+2.75)#145 |
| 29. | Calwa | 2.90% | 0.49%(+2.41)#29 | 0.16%(+2.74)#147 |
| 30. | Mayflower Village | 2.88% | 0.49%(+2.39)#30 | 0.16%(+2.72)#148 |
| 31. | Nipomo | 2.80% | 0.49%(+2.31)#31 | 0.16%(+2.64)#153 |
| 32. | Graton | 2.75% | 0.49%(+2.27)#32 | 0.16%(+2.60)#156 |
| 33. | Mead Valley | 2.68% | 0.49%(+2.19)#33 | 0.16%(+2.52)#161 |
| 34. | Citrus | 2.67% | 0.49%(+2.18)#34 | 0.16%(+2.51)#163 |
| 35. | Loma Linda | 2.48% | 0.49%(+2.00)#35 | 0.16%(+2.33)#181 |
| 36. | Walnut Park | 2.43% | 0.49%(+1.95)#36 | 0.16%(+2.27)#185 |
| 37. | March Arb | 2.38% | 0.49%(+1.90)#37 | 0.16%(+2.23)#191 |
| 38. | Port Hueneme | 2.37% | 0.49%(+1.89)#38 | 0.16%(+2.21)#195 |
| 39. | Patterson Tract | 2.37% | 0.49%(+1.89)#39 | 0.16%(+2.21)#196 |
| 40. | Dos Palos | 2.29% | 0.49%(+1.81)#40 | 0.16%(+2.14)#205 |
| 41. | Vincent | 2.29% | 0.49%(+1.81)#41 | 0.16%(+2.14)#206 |
| 42. | Oxnard | 2.28% | 0.49%(+1.79)#42 | 0.16%(+2.12)#209 |
| 43. | Hughson | 2.27% | 0.49%(+1.79)#43 | 0.16%(+2.12)#210 |
| 44. | Malaga | 2.26% | 0.49%(+1.77)#44 | 0.16%(+2.10)#212 |
| 45. | Oroville East | 2.23% | 0.49%(+1.74)#45 | 0.16%(+2.07)#215 |
| 46. | East Palo Alto | 2.20% | 0.49%(+1.72)#46 | 0.16%(+2.05)#217 |
| 47. | South Oroville | 2.18% | 0.49%(+1.70)#47 | 0.16%(+2.03)#218 |
| 48. | Angwin | 2.16% | 0.49%(+1.68)#48 | 0.16%(+2.00)#222 |
| 49. | Mountain View Acres | 2.11% | 0.49%(+1.63)#49 | 0.16%(+1.96)#230 |
| 50. | Signal Hill | 1.97% | 0.49%(+1.48)#50 | 0.16%(+1.81)#247 |
| 51. | Guadalupe | 1.96% | 0.49%(+1.47)#51 | 0.16%(+1.80)#248 |
| 52. | Hawaiian Gardens | 1.92% | 0.49%(+1.43)#52 | 0.16%(+1.76)#251 |
| 53. | Oak Hills | 1.90% | 0.49%(+1.42)#53 | 0.16%(+1.74)#255 |
| 54. | Pico Rivera | 1.86% | 0.49%(+1.37)#54 | 0.16%(+1.70)#263 |
| 55. | Cotati | 1.86% | 0.49%(+1.37)#55 | 0.16%(+1.70)#265 |
| 56. | Ukiah | 1.84% | 0.49%(+1.35)#56 | 0.16%(+1.68)#270 |
| 57. | Coalinga | 1.84% | 0.49%(+1.35)#57 | 0.16%(+1.68)#271 |
| 58. | Aptos Hills Larkin Valley | 1.83% | 0.49%(+1.35)#58 | 0.16%(+1.68)#272 |
| 59. | West Park | 1.83% | 0.49%(+1.34)#59 | 0.16%(+1.67)#274 |
| 60. | Bay Point | 1.80% | 0.49%(+1.31)#60 | 0.16%(+1.64)#278 |
| 61. | Magalia | 1.78% | 0.49%(+1.30)#61 | 0.16%(+1.63)#280 |
| 62. | Lennox | 1.78% | 0.49%(+1.30)#62 | 0.16%(+1.63)#281 |
| 63. | Hawthorne | 1.73% | 0.49%(+1.25)#63 | 0.16%(+1.58)#289 |
| 64. | Yosemite Valley | 1.73% | 0.49%(+1.24)#64 | 0.16%(+1.57)#291 |
| 65. | Ferndale | 1.72% | 0.49%(+1.24)#65 | 0.16%(+1.56)#293 |
| 66. | Herald | 1.71% | 0.49%(+1.23)#66 | 0.16%(+1.56)#295 |
| 67. | Seville | 1.70% | 0.49%(+1.22)#67 | 0.16%(+1.55)#298 |
| 68. | West Rancho Dominguez | 1.67% | 0.49%(+1.19)#68 | 0.16%(+1.51)#306 |
| 69. | Maywood | 1.67% | 0.49%(+1.18)#69 | 0.16%(+1.51)#308 |
| 70. | Montebello | 1.66% | 0.49%(+1.17)#70 | 0.16%(+1.50)#311 |
| 71. | San Martin | 1.65% | 0.49%(+1.17)#71 | 0.16%(+1.50)#312 |
| 72. | Sheridan | 1.65% | 0.49%(+1.16)#72 | 0.16%(+1.49)#315 |
| 73. | El Monte | 1.63% | 0.49%(+1.15)#73 | 0.16%(+1.47)#318 |
| 74. | Santa Maria | 1.61% | 0.49%(+1.12)#74 | 0.16%(+1.45)#323 |
| 75. | Banning | 1.58% | 0.49%(+1.10)#75 | 0.16%(+1.43)#327 |
| 76. | Los Banos | 1.58% | 0.49%(+1.09)#76 | 0.16%(+1.42)#328 |
| 77. | Huntington Park | 1.58% | 0.49%(+1.09)#77 | 0.16%(+1.42)#329 |
| 78. | Phelan | 1.58% | 0.49%(+1.09)#78 | 0.16%(+1.42)#330 |
| 79. | Tarpey Village | 1.58% | 0.49%(+1.09)#79 | 0.16%(+1.42)#331 |
| 80. | East Los Angeles | 1.56% | 0.49%(+1.08)#80 | 0.16%(+1.41)#335 |
| 81. | Aromas | 1.53% | 0.49%(+1.05)#81 | 0.16%(+1.37)#342 |
| 82. | Vandenberg Village | 1.52% | 0.49%(+1.04)#82 | 0.16%(+1.37)#345 |
| 83. | Valinda | 1.50% | 0.49%(+1.02)#83 | 0.16%(+1.35)#349 |
| 84. | La Presa | 1.47% | 0.49%(+0.988)#84 | 0.16%(+1.32)#359 |
| 85. | Byron | 1.46% | 0.49%(+0.975)#85 | 0.16%(+1.30)#362 |
| 86. | Bostonia | 1.45% | 0.49%(+0.969)#86 | 0.16%(+1.30)#365 |
| 87. | Santa Fe Springs | 1.45% | 0.49%(+0.964)#87 | 0.16%(+1.29)#367 |
| 88. | Lake Elsinore | 1.43% | 0.49%(+0.949)#88 | 0.16%(+1.28)#373 |
| 89. | Camp Pendleton South | 1.43% | 0.49%(+0.943)#89 | 0.16%(+1.27)#376 |
| 90. | Pomona | 1.42% | 0.49%(+0.937)#90 | 0.16%(+1.27)#379 |
| 91. | Brisbane | 1.41% | 0.49%(+0.924)#91 | 0.16%(+1.25)#383 |
| 92. | Florence Graham | 1.37% | 0.49%(+0.890)#92 | 0.16%(+1.22)#391 |
| 93. | Redwood City | 1.36% | 0.49%(+0.874)#93 | 0.16%(+1.20)#401 |
| 94. | Riverbank | 1.34% | 0.49%(+0.858)#94 | 0.16%(+1.19)#406 |
| 95. | Windsor | 1.34% | 0.49%(+0.852)#95 | 0.16%(+1.18)#408 |
| 96. | Sanger | 1.33% | 0.49%(+0.844)#96 | 0.16%(+1.17)#411 |
| 97. | Bonita | 1.33% | 0.49%(+0.844)#97 | 0.16%(+1.17)#413 |
| 98. | Tehachapi | 1.27% | 0.49%(+0.783)#98 | 0.16%(+1.11)#431 |
| 99. | Ramona | 1.24% | 0.49%(+0.758)#99 | 0.16%(+1.09)#436 |
| 100. | Calimesa | 1.23% | 0.49%(+0.750)#100 | 0.16%(+1.08)#440 |
Common Questions
What are the Top 10 Cities with the Highest Percentage of Mexican American Indian Population in California?
Top 10 Cities with the Highest Percentage of Mexican American Indian Population in California are:
#1
50.98%
#2
12.15%
#3
10.56%
#4
9.71%
#5
8.06%
#6
7.12%
#7
5.79%
#8
5.53%
#9
5.31%
#10
5.25%
What city has the Highest Percentage of Mexican American Indian Population in California?
Tooleville has the Highest Percentage of Mexican American Indian Population in California with 50.98%.
What is the Percentage of Mexican American Indian Population in the State of California?
Percentage of Mexican American Indian Population in California is 0.49%.
What is the Percentage of Mexican American Indian Population in the United States?
Percentage of Mexican American Indian Population in the United States is 0.16%.