Cities with the Highest Percentage of Population with a Degree in Education in California
RELATED REPORTS & OPTIONS
Education
California
Compare Cities
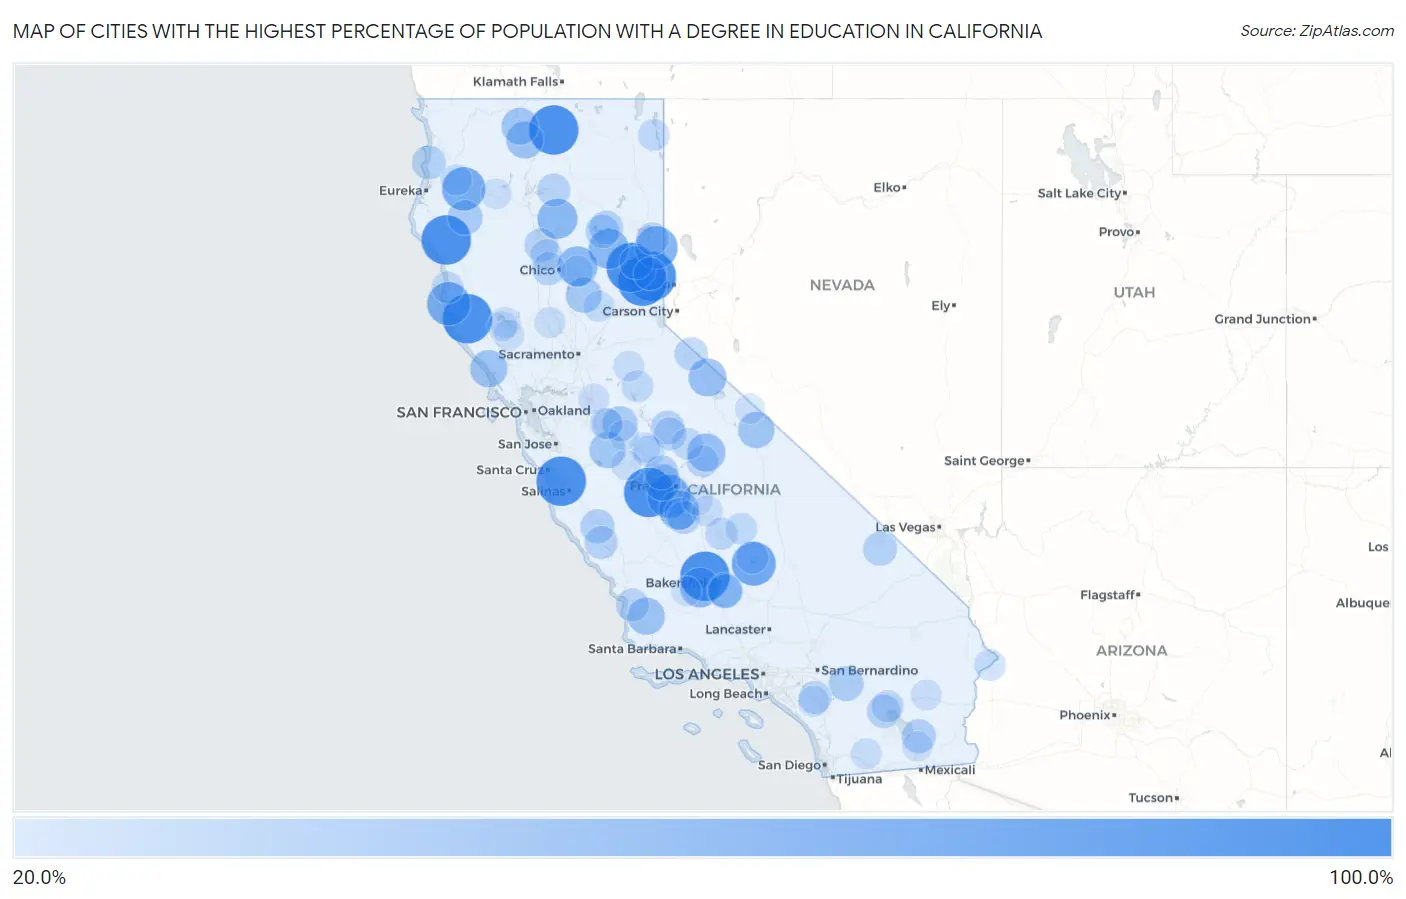
Map of Cities with the Highest Percentage of Population with a Degree in Education in California
0.0%
100.0%
Cities with the Highest Percentage of Population with a Degree in Education in California
| City | % Graduates | vs State | vs National | |
| 1. | Redway | 100.0% | 5.8%(+94.2)#1 | 11.1%(+88.9)#11 |
| 2. | Tranquillity | 100.0% | 5.8%(+94.2)#2 | 11.1%(+88.9)#19 |
| 3. | Sierra Brooks | 100.0% | 5.8%(+94.2)#3 | 11.1%(+88.9)#48 |
| 4. | Edison | 100.0% | 5.8%(+94.2)#4 | 11.1%(+88.9)#50 |
| 5. | Mexican Colony | 100.0% | 5.8%(+94.2)#5 | 11.1%(+88.9)#95 |
| 6. | Sierraville | 100.0% | 5.8%(+94.2)#6 | 11.1%(+88.9)#130 |
| 7. | C Road | 100.0% | 5.8%(+94.2)#7 | 11.1%(+88.9)#276 |
| 8. | Tennant | 100.0% | 5.8%(+94.2)#8 | 11.1%(+88.9)#297 |
| 9. | Philo | 100.0% | 5.8%(+94.2)#9 | 11.1%(+88.9)#350 |
| 10. | Moss Landing | 100.0% | 5.8%(+94.2)#10 | 11.1%(+88.9)#430 |
| 11. | Mountain Mesa | 77.4% | 5.8%(+71.6)#11 | 11.1%(+66.4)#581 |
| 12. | Burnt Ranch | 74.4% | 5.8%(+68.6)#12 | 11.1%(+63.4)#651 |
| 13. | Little River | 74.4% | 5.8%(+68.6)#13 | 11.1%(+63.4)#652 |
| 14. | Raisin City | 73.3% | 5.8%(+67.5)#14 | 11.1%(+62.3)#669 |
| 15. | Doyle | 71.9% | 5.8%(+66.1)#15 | 11.1%(+60.9)#692 |
| 16. | Johnson Park | 69.6% | 5.8%(+63.8)#16 | 11.1%(+58.5)#756 |
| 17. | Rexland Acres | 63.6% | 5.8%(+57.8)#17 | 11.1%(+52.6)#933 |
| 18. | Keddie | 62.1% | 5.8%(+56.3)#18 | 11.1%(+51.0)#990 |
| 19. | Manton | 61.1% | 5.8%(+55.3)#19 | 11.1%(+50.1)#1,020 |
| 20. | Concow | 60.9% | 5.8%(+55.1)#20 | 11.1%(+49.8)#1,034 |
| 21. | Hardwick | 60.0% | 5.8%(+54.2)#21 | 11.1%(+48.9)#1,082 |
| 22. | Tupman | 60.0% | 5.8%(+54.2)#22 | 11.1%(+48.9)#1,087 |
| 23. | Knights Ferry | 53.8% | 5.8%(+48.1)#23 | 11.1%(+42.8)#1,399 |
| 24. | Big Creek | 53.3% | 5.8%(+47.5)#24 | 11.1%(+42.3)#1,439 |
| 25. | Bridgeport | 52.9% | 5.8%(+47.2)#25 | 11.1%(+41.9)#1,452 |
| 26. | Carmet | 50.0% | 5.8%(+44.2)#26 | 11.1%(+38.9)#1,764 |
| 27. | Garey | 50.0% | 5.8%(+44.2)#27 | 11.1%(+38.9)#1,774 |
| 28. | Edgewood | 50.0% | 5.8%(+44.2)#28 | 11.1%(+38.9)#1,777 |
| 29. | Ono | 50.0% | 5.8%(+44.2)#29 | 11.1%(+38.9)#1,791 |
| 30. | Grenada | 48.8% | 5.8%(+43.0)#30 | 11.1%(+37.7)#1,844 |
| 31. | Biola | 47.1% | 5.8%(+41.3)#31 | 11.1%(+36.0)#1,975 |
| 32. | Chalfant | 47.1% | 5.8%(+41.3)#32 | 11.1%(+36.0)#1,976 |
| 33. | Franklin Cdp Sacramento County | 46.2% | 5.8%(+40.4)#33 | 11.1%(+35.1)#2,088 |
| 34. | Gustine | 45.9% | 5.8%(+40.1)#34 | 11.1%(+34.8)#2,103 |
| 35. | Bangor | 44.2% | 5.8%(+38.4)#35 | 11.1%(+33.2)#2,308 |
| 36. | Foresta | 44.2% | 5.8%(+38.4)#36 | 11.1%(+33.1)#2,318 |
| 37. | Hickman | 41.7% | 5.8%(+35.9)#37 | 11.1%(+30.6)#2,648 |
| 38. | Lamont | 41.3% | 5.8%(+35.5)#38 | 11.1%(+30.2)#2,717 |
| 39. | Mad River | 41.1% | 5.8%(+35.3)#39 | 11.1%(+30.0)#2,745 |
| 40. | Cabazon | 40.4% | 5.8%(+34.6)#40 | 11.1%(+29.3)#2,840 |
| 41. | Calipatria | 37.9% | 5.8%(+32.1)#41 | 11.1%(+26.8)#3,312 |
| 42. | Parkwood | 37.7% | 5.8%(+31.9)#42 | 11.1%(+26.6)#3,350 |
| 43. | Weedpatch | 37.5% | 5.8%(+31.7)#43 | 11.1%(+26.4)#3,368 |
| 44. | Pine Canyon | 37.4% | 5.8%(+31.6)#44 | 11.1%(+26.3)#3,436 |
| 45. | Tecopa | 36.8% | 5.8%(+31.1)#45 | 11.1%(+25.8)#3,540 |
| 46. | Big Lagoon | 36.8% | 5.8%(+31.1)#46 | 11.1%(+25.8)#3,543 |
| 47. | Westwood | 36.1% | 5.8%(+30.3)#47 | 11.1%(+25.1)#3,694 |
| 48. | Portola | 35.8% | 5.8%(+30.1)#48 | 11.1%(+24.8)#3,753 |
| 49. | East Shore | 35.8% | 5.8%(+30.1)#49 | 11.1%(+24.8)#3,756 |
| 50. | Amador Pines | 35.8% | 5.8%(+30.0)#50 | 11.1%(+24.8)#3,760 |
| 51. | Oasis | 35.7% | 5.8%(+29.9)#51 | 11.1%(+24.7)#3,769 |
| 52. | Gerber | 35.3% | 5.8%(+29.6)#52 | 11.1%(+24.3)#3,885 |
| 53. | Midpines | 35.3% | 5.8%(+29.5)#53 | 11.1%(+24.2)#3,907 |
| 54. | Coleville | 34.1% | 5.8%(+28.3)#54 | 11.1%(+23.0)#4,186 |
| 55. | Lockwood | 34.0% | 5.8%(+28.2)#55 | 11.1%(+22.9)#4,211 |
| 56. | Blacklake | 33.9% | 5.8%(+28.1)#56 | 11.1%(+22.8)#4,239 |
| 57. | Hamilton City | 33.3% | 5.8%(+27.5)#57 | 11.1%(+22.3)#4,335 |
| 58. | Home Garden | 33.3% | 5.8%(+27.5)#58 | 11.1%(+22.3)#4,338 |
| 59. | Round Mountain | 33.3% | 5.8%(+27.5)#59 | 11.1%(+22.3)#4,536 |
| 60. | Yosemite West | 33.3% | 5.8%(+27.5)#60 | 11.1%(+22.3)#4,593 |
| 61. | Loyalton | 33.1% | 5.8%(+27.3)#61 | 11.1%(+22.1)#4,612 |
| 62. | Patton Village | 32.6% | 5.8%(+26.8)#62 | 11.1%(+21.5)#4,729 |
| 63. | Warm Springs | 32.1% | 5.8%(+26.3)#63 | 11.1%(+21.0)#4,858 |
| 64. | Bootjack | 32.0% | 5.8%(+26.2)#64 | 11.1%(+20.9)#4,889 |
| 65. | Kernville | 30.9% | 5.8%(+25.1)#65 | 11.1%(+19.8)#5,273 |
| 66. | Rouse | 29.8% | 5.8%(+24.0)#66 | 11.1%(+18.7)#5,633 |
| 67. | East Porterville | 29.7% | 5.8%(+23.9)#67 | 11.1%(+18.6)#5,662 |
| 68. | Mecca | 29.4% | 5.8%(+23.6)#68 | 11.1%(+18.4)#5,761 |
| 69. | Shaver Lake | 29.4% | 5.8%(+23.6)#69 | 11.1%(+18.3)#5,800 |
| 70. | Vina | 29.3% | 5.8%(+23.5)#70 | 11.1%(+18.2)#5,833 |
| 71. | Cleone | 29.1% | 5.8%(+23.3)#71 | 11.1%(+18.1)#5,917 |
| 72. | Cedarville | 28.7% | 5.8%(+22.9)#72 | 11.1%(+17.6)#6,070 |
| 73. | Grangeville | 28.4% | 5.8%(+22.6)#73 | 11.1%(+17.4)#6,225 |
| 74. | Murphys | 28.2% | 5.8%(+22.4)#74 | 11.1%(+17.2)#6,291 |
| 75. | Bass Lake | 28.1% | 5.8%(+22.4)#75 | 11.1%(+17.1)#6,321 |
| 76. | Pierpoint | 28.1% | 5.8%(+22.3)#76 | 11.1%(+17.1)#6,335 |
| 77. | Le Grand | 27.9% | 5.8%(+22.1)#77 | 11.1%(+16.8)#6,419 |
| 78. | Willow Creek | 27.3% | 5.8%(+21.5)#78 | 11.1%(+16.2)#6,649 |
| 79. | Yankee Hill | 27.3% | 5.8%(+21.5)#79 | 11.1%(+16.2)#6,668 |
| 80. | Bluewater | 26.9% | 5.8%(+21.1)#80 | 11.1%(+15.9)#6,844 |
| 81. | Lakeland Village | 25.6% | 5.8%(+19.8)#81 | 11.1%(+14.5)#7,414 |
| 82. | Rough And Ready | 25.6% | 5.8%(+19.8)#82 | 11.1%(+14.5)#7,416 |
| 83. | Red Corral | 25.4% | 5.8%(+19.7)#83 | 11.1%(+14.4)#7,480 |
| 84. | Soda Bay | 25.1% | 5.8%(+19.3)#84 | 11.1%(+14.0)#7,620 |
| 85. | Ivanhoe | 25.0% | 5.8%(+19.2)#85 | 11.1%(+13.9)#7,638 |
| 86. | College City | 25.0% | 5.8%(+19.2)#86 | 11.1%(+13.9)#7,743 |
| 87. | Mount Laguna | 25.0% | 5.8%(+19.2)#87 | 11.1%(+13.9)#7,832 |
| 88. | Cobb | 24.5% | 5.8%(+18.7)#88 | 11.1%(+13.5)#8,045 |
| 89. | Weaverville | 24.0% | 5.8%(+18.2)#89 | 11.1%(+12.9)#8,268 |
| 90. | Desert Center | 24.0% | 5.8%(+18.2)#90 | 11.1%(+12.9)#8,292 |
| 91. | Garden Acres | 24.0% | 5.8%(+18.2)#91 | 11.1%(+12.9)#8,299 |
| 92. | Dinuba | 23.8% | 5.8%(+18.0)#92 | 11.1%(+12.7)#8,394 |
| 93. | Bystrom | 23.6% | 5.8%(+17.8)#93 | 11.1%(+12.6)#8,476 |
| 94. | Planada | 23.4% | 5.8%(+17.6)#94 | 11.1%(+12.3)#8,634 |
| 95. | Dos Palos Y | 23.1% | 5.8%(+17.3)#95 | 11.1%(+12.0)#8,812 |
| 96. | Brawley | 22.9% | 5.8%(+17.1)#96 | 11.1%(+11.9)#8,899 |
| 97. | Ballico | 22.7% | 5.8%(+16.9)#97 | 11.1%(+11.7)#9,001 |
| 98. | Benton | 22.4% | 5.8%(+16.7)#98 | 11.1%(+11.4)#9,167 |
| 99. | Kelseyville | 22.3% | 5.8%(+16.5)#99 | 11.1%(+11.2)#9,255 |
| 100. | Derby Acres | 22.2% | 5.8%(+16.4)#100 | 11.1%(+11.2)#9,298 |
Common Questions
What are the Top 10 Cities with the Highest Percentage of Population with a Degree in Education in California?
Top 10 Cities with the Highest Percentage of Population with a Degree in Education in California are:
#1
100.0%
#2
100.0%
#3
100.0%
#4
100.0%
#5
100.0%
#6
100.0%
#7
100.0%
#8
100.0%
#9
100.0%
#10
77.4%
What city has the Highest Percentage of Population with a Degree in Education in California?
Redway has the Highest Percentage of Population with a Degree in Education in California with 100.0%.
What is the Percentage of Population with a Degree in Education in the State of California?
Percentage of Population with a Degree in Education in California is 5.8%.
What is the Percentage of Population with a Degree in Education in the United States?
Percentage of Population with a Degree in Education in the United States is 11.1%.