Loma Rica, CA Map & Demographics
Loma Rica Map
Loma Rica Overview
$40,774
PER CAPITA INCOME
$98,971
AVG FAMILY INCOME
$93,782
AVG HOUSEHOLD INCOME
68.2%
WAGE / INCOME GAP [ % ]
31.8¢/ $1
WAGE / INCOME GAP [ $ ]
0.40
INEQUALITY / GINI INDEX
2,605
TOTAL POPULATION
1,205
MALE POPULATION
1,400
FEMALE POPULATION
86.07
MALES / 100 FEMALES
116.18
FEMALES / 100 MALES
52.4
MEDIAN AGE
2.8
AVG FAMILY SIZE
2.4
AVG HOUSEHOLD SIZE
1,020
LABOR FORCE [ PEOPLE ]
46.6%
PERCENT IN LABOR FORCE
4.8%
UNEMPLOYMENT RATE
Loma Rica Area Codes
Income in Loma Rica
Income Overview in Loma Rica
Per Capita Income in Loma Rica is $40,774, while median incomes of families and households are $98,971 and $93,782 respectively.
| Characteristic | Number | Measure |
| Per Capita Income | 2,605 | $40,774 |
| Median Family Income | 748 | $98,971 |
| Mean Family Income | 748 | $118,794 |
| Median Household Income | 1,077 | $93,782 |
| Mean Household Income | 1,077 | $98,497 |
| Income Deficit | 748 | $0 |
| Wage / Income Gap (%) | 2,605 | 68.15% |
| Wage / Income Gap ($) | 2,605 | 31.85¢ per $1 |
| Gini / Inequality Index | 2,605 | 0.40 |
Earnings by Sex in Loma Rica
Average Earnings in Loma Rica are $41,758, $81,667 for men and $26,007 for women, a difference of 68.1%.
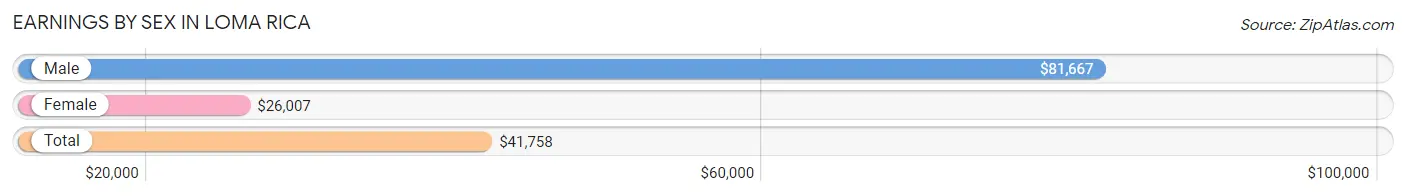
| Sex | Number | Average Earnings |
| Male | 526 (48.6%) | $81,667 |
| Female | 557 (51.4%) | $26,007 |
| Total | 1,083 (100.0%) | $41,758 |
Earnings by Sex by Income Bracket in Loma Rica
The most common earnings brackets in Loma Rica are $100,000+ for men (205 | 39.0%) and $25,000 to $29,999 for women (97 | 17.4%).
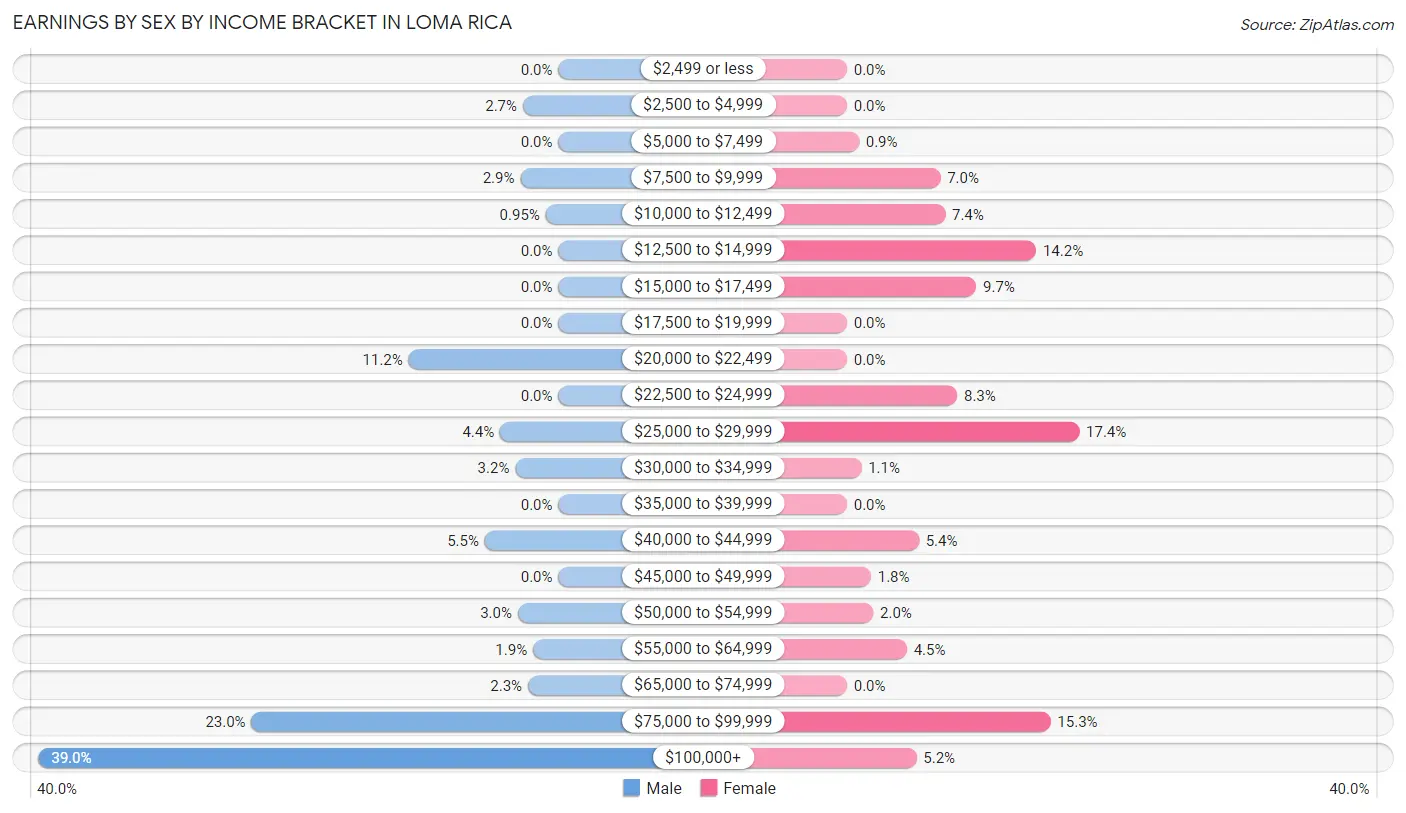
| Income | Male | Female |
| $2,499 or less | 0 (0.0%) | 0 (0.0%) |
| $2,500 to $4,999 | 14 (2.7%) | 0 (0.0%) |
| $5,000 to $7,499 | 0 (0.0%) | 5 (0.9%) |
| $7,500 to $9,999 | 15 (2.9%) | 39 (7.0%) |
| $10,000 to $12,499 | 5 (0.9%) | 41 (7.4%) |
| $12,500 to $14,999 | 0 (0.0%) | 79 (14.2%) |
| $15,000 to $17,499 | 0 (0.0%) | 54 (9.7%) |
| $17,500 to $19,999 | 0 (0.0%) | 0 (0.0%) |
| $20,000 to $22,499 | 59 (11.2%) | 0 (0.0%) |
| $22,500 to $24,999 | 0 (0.0%) | 46 (8.3%) |
| $25,000 to $29,999 | 23 (4.4%) | 97 (17.4%) |
| $30,000 to $34,999 | 17 (3.2%) | 6 (1.1%) |
| $35,000 to $39,999 | 0 (0.0%) | 0 (0.0%) |
| $40,000 to $44,999 | 29 (5.5%) | 30 (5.4%) |
| $45,000 to $49,999 | 0 (0.0%) | 10 (1.8%) |
| $50,000 to $54,999 | 16 (3.0%) | 11 (2.0%) |
| $55,000 to $64,999 | 10 (1.9%) | 25 (4.5%) |
| $65,000 to $74,999 | 12 (2.3%) | 0 (0.0%) |
| $75,000 to $99,999 | 121 (23.0%) | 85 (15.3%) |
| $100,000+ | 205 (39.0%) | 29 (5.2%) |
| Total | 526 (100.0%) | 557 (100.0%) |
Earnings by Sex by Educational Attainment in Loma Rica
Average earnings in Loma Rica are $82,330 for men and $29,836 for women, a difference of 63.8%. Men with an educational attainment of bachelor's degree enjoy the highest average annual earnings of $114,118, while those with college or associate's degree education earn the least with $86,250. Women with an educational attainment of college or associate's degree earn the most with the average annual earnings of $40,625, while those with high school diploma education have the smallest earnings of $27,600.
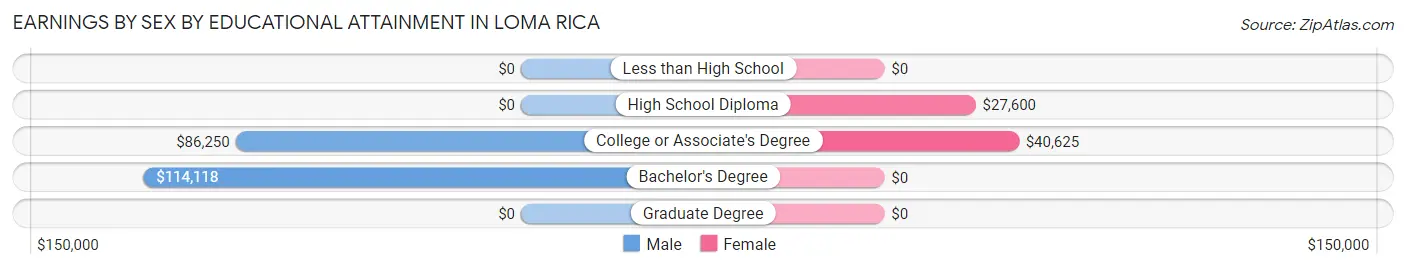
| Educational Attainment | Male Income | Female Income |
| Less than High School | - | - |
| High School Diploma | - | - |
| College or Associate's Degree | $86,250 | $40,625 |
| Bachelor's Degree | $114,118 | $0 |
| Graduate Degree | - | - |
| Total | $82,330 | $29,836 |
Family Income in Loma Rica
Family Income Brackets in Loma Rica
According to the Loma Rica family income data, there are 180 families falling into the $35,000 to $49,999 income range, which is the most common income bracket and makes up 24.1% of all families.
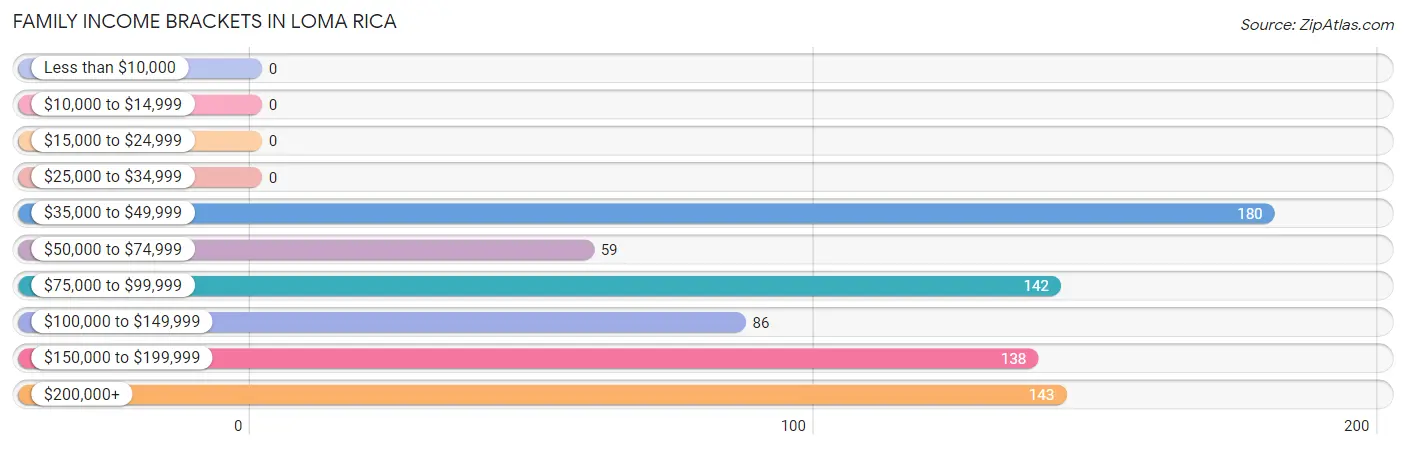
| Income Bracket | # Families | % Families |
| Less than $10,000 | 0 | 0.0% |
| $10,000 to $14,999 | 0 | 0.0% |
| $15,000 to $24,999 | 0 | 0.0% |
| $25,000 to $34,999 | 0 | 0.0% |
| $35,000 to $49,999 | 180 | 24.1% |
| $50,000 to $74,999 | 59 | 7.9% |
| $75,000 to $99,999 | 142 | 19.0% |
| $100,000 to $149,999 | 86 | 11.5% |
| $150,000 to $199,999 | 138 | 18.4% |
| $200,000+ | 143 | 19.1% |
Family Income by Famaliy Size in Loma Rica
2-person families (491 | 65.6%) account for the highest median family income in Loma Rica with $112,868 per family, while 2-person families (491 | 65.6%) have the highest median income of $56,434 per family member.
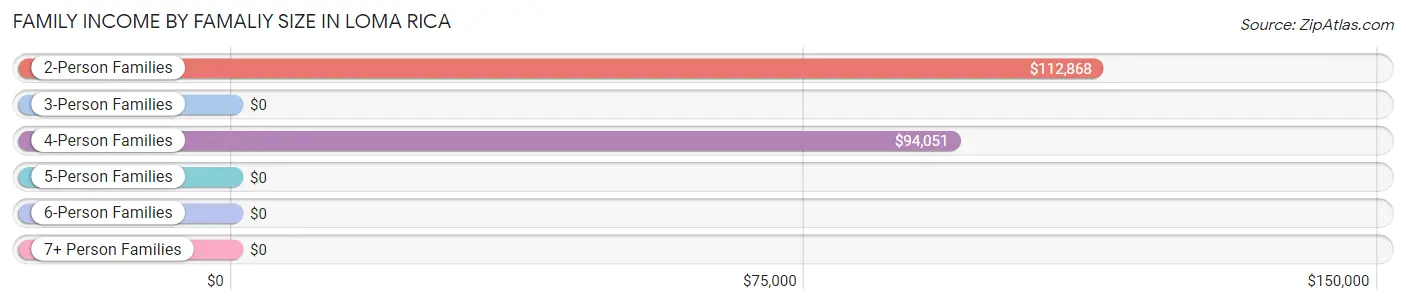
| Income Bracket | # Families | Median Income |
| 2-Person Families | 491 (65.6%) | $112,868 |
| 3-Person Families | 90 (12.0%) | $0 |
| 4-Person Families | 122 (16.3%) | $94,051 |
| 5-Person Families | 19 (2.5%) | $0 |
| 6-Person Families | 4 (0.5%) | $0 |
| 7+ Person Families | 22 (2.9%) | $0 |
| Total | 748 (100.0%) | $98,971 |
Family Income by Number of Earners in Loma Rica
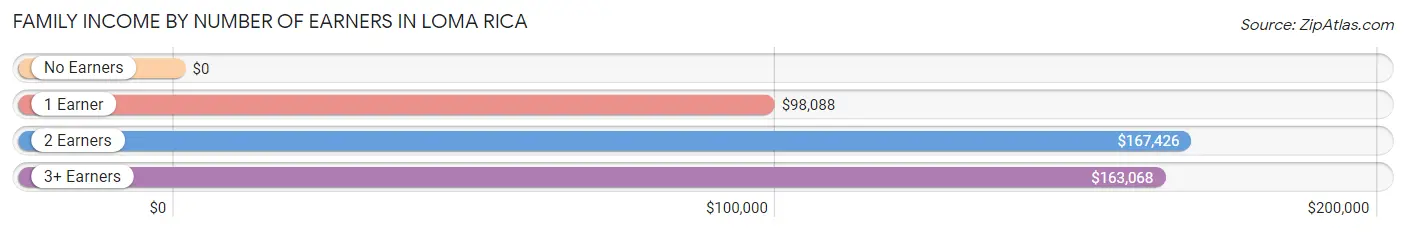
| Number of Earners | # Families | Median Income |
| No Earners | 277 (37.0%) | $0 |
| 1 Earner | 80 (10.7%) | $98,088 |
| 2 Earners | 357 (47.7%) | $167,426 |
| 3+ Earners | 34 (4.5%) | $163,068 |
| Total | 748 (100.0%) | $98,971 |
Household Income in Loma Rica
Household Income Brackets in Loma Rica
With 190 households falling in the category, the $100,000 to $149,999 income range is the most frequent in Loma Rica, accounting for 17.6% of all households.
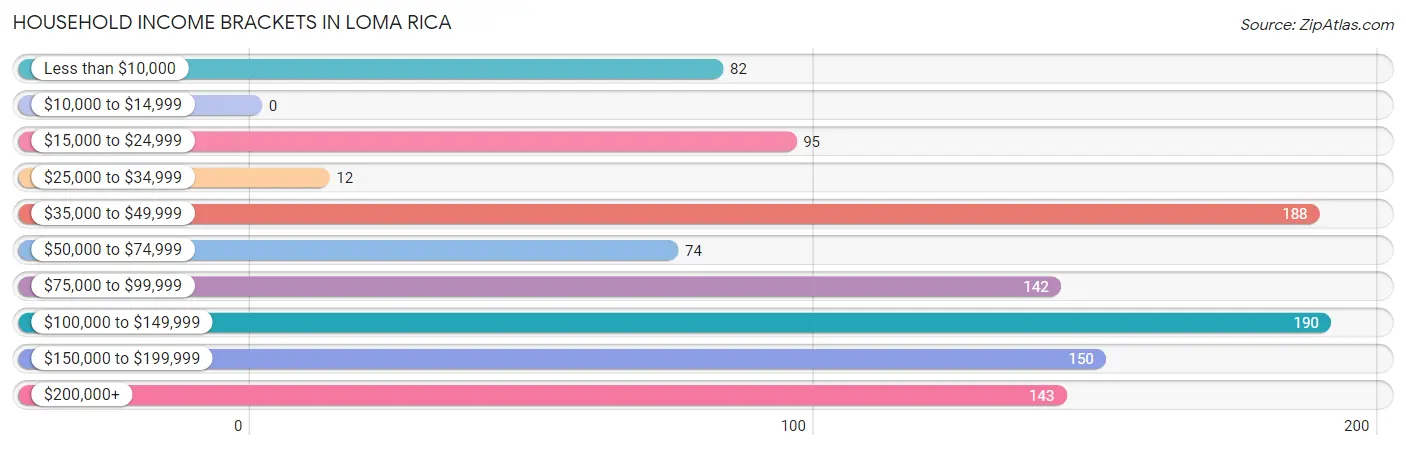
| Income Bracket | # Households | % Households |
| Less than $10,000 | 82 | 7.6% |
| $10,000 to $14,999 | 0 | 0.0% |
| $15,000 to $24,999 | 95 | 8.8% |
| $25,000 to $34,999 | 12 | 1.1% |
| $35,000 to $49,999 | 188 | 17.5% |
| $50,000 to $74,999 | 74 | 6.9% |
| $75,000 to $99,999 | 142 | 13.2% |
| $100,000 to $149,999 | 190 | 17.6% |
| $150,000 to $199,999 | 150 | 13.9% |
| $200,000+ | 143 | 13.3% |
Household Income by Householder Age in Loma Rica
The median household income in Loma Rica is $93,782, with the highest median household income of $114,922 found in the 25 to 44 years age bracket for the primary householder. A total of 204 households (18.9%) fall into this category. Meanwhile, the 15 to 24 years age bracket for the primary householder has the lowest median household income of $0, with 102 households (9.5%) in this group.
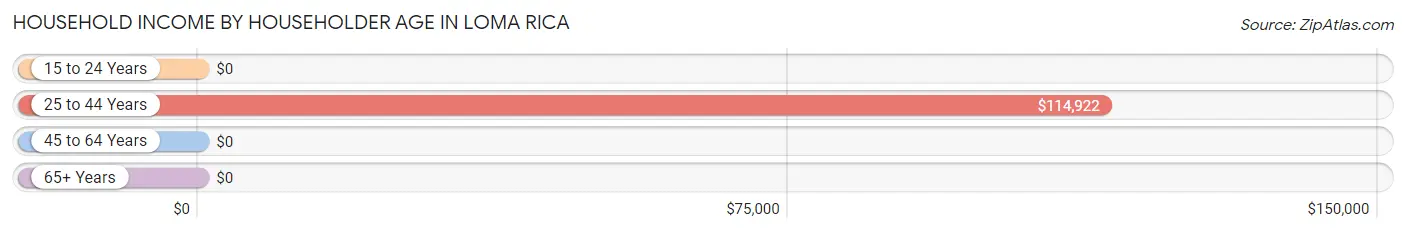
| Income Bracket | # Households | Median Income |
| 15 to 24 Years | 102 (9.5%) | $0 |
| 25 to 44 Years | 204 (18.9%) | $114,922 |
| 45 to 64 Years | 349 (32.4%) | $0 |
| 65+ Years | 422 (39.2%) | $0 |
| Total | 1,077 (100.0%) | $93,782 |
Poverty in Loma Rica
Income Below Poverty by Sex and Age in Loma Rica
With 6.3% poverty level for males and 12.7% for females among the residents of Loma Rica, 45 to 54 year old males and 35 to 44 year old females are the most vulnerable to poverty, with 59 males (77.6%) and 68 females (49.6%) in their respective age groups living below the poverty level.
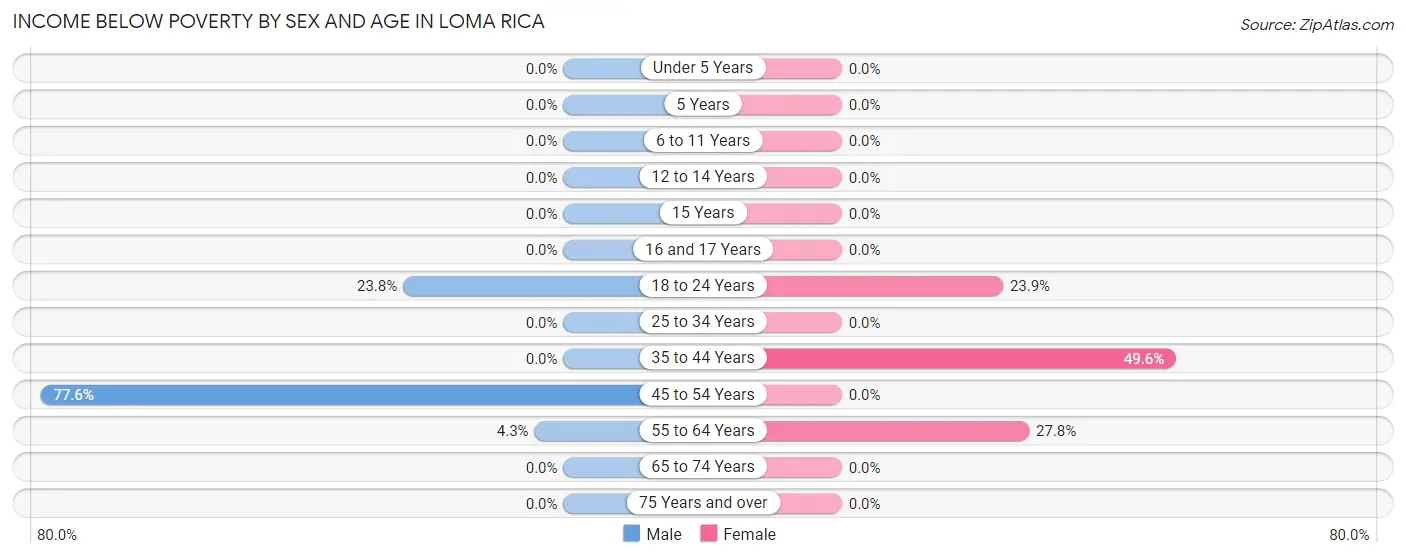
| Age Bracket | Male | Female |
| Under 5 Years | 0 (0.0%) | 0 (0.0%) |
| 5 Years | 0 (0.0%) | 0 (0.0%) |
| 6 to 11 Years | 0 (0.0%) | 0 (0.0%) |
| 12 to 14 Years | 0 (0.0%) | 0 (0.0%) |
| 15 Years | 0 (0.0%) | 0 (0.0%) |
| 16 and 17 Years | 0 (0.0%) | 0 (0.0%) |
| 18 to 24 Years | 5 (23.8%) | 39 (23.9%) |
| 25 to 34 Years | 0 (0.0%) | 0 (0.0%) |
| 35 to 44 Years | 0 (0.0%) | 68 (49.6%) |
| 45 to 54 Years | 59 (77.6%) | 0 (0.0%) |
| 55 to 64 Years | 12 (4.3%) | 67 (27.8%) |
| 65 to 74 Years | 0 (0.0%) | 0 (0.0%) |
| 75 Years and over | 0 (0.0%) | 0 (0.0%) |
| Total | 76 (6.3%) | 174 (12.7%) |
Income Above Poverty by Sex and Age in Loma Rica
According to the poverty statistics in Loma Rica, males aged under 5 years and females aged under 5 years are the age groups that are most secure financially, with 100.0% of males and 100.0% of females in these age groups living above the poverty line.
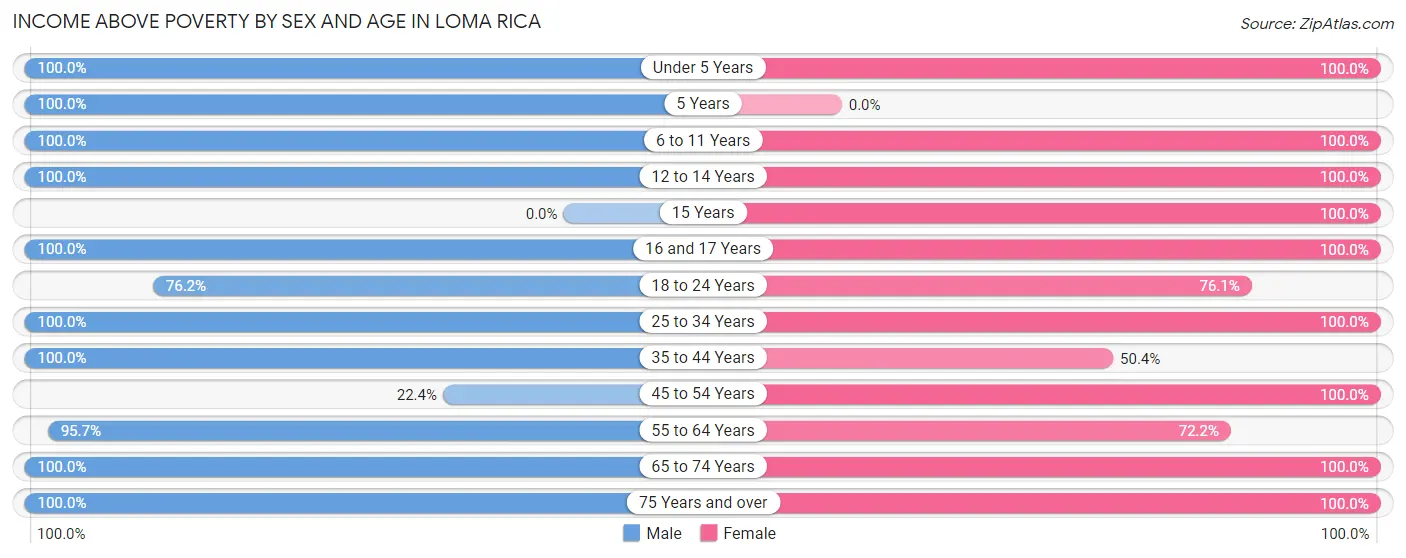
| Age Bracket | Male | Female |
| Under 5 Years | 78 (100.0%) | 68 (100.0%) |
| 5 Years | 18 (100.0%) | 0 (0.0%) |
| 6 to 11 Years | 23 (100.0%) | 139 (100.0%) |
| 12 to 14 Years | 3 (100.0%) | 18 (100.0%) |
| 15 Years | 0 (0.0%) | 45 (100.0%) |
| 16 and 17 Years | 14 (100.0%) | 5 (100.0%) |
| 18 to 24 Years | 16 (76.2%) | 124 (76.1%) |
| 25 to 34 Years | 174 (100.0%) | 111 (100.0%) |
| 35 to 44 Years | 125 (100.0%) | 69 (50.4%) |
| 45 to 54 Years | 17 (22.4%) | 118 (100.0%) |
| 55 to 64 Years | 267 (95.7%) | 174 (72.2%) |
| 65 to 74 Years | 271 (100.0%) | 261 (100.0%) |
| 75 Years and over | 123 (100.0%) | 70 (100.0%) |
| Total | 1,129 (93.7%) | 1,202 (87.4%) |
Income Below Poverty Among Married-Couple Families in Loma Rica
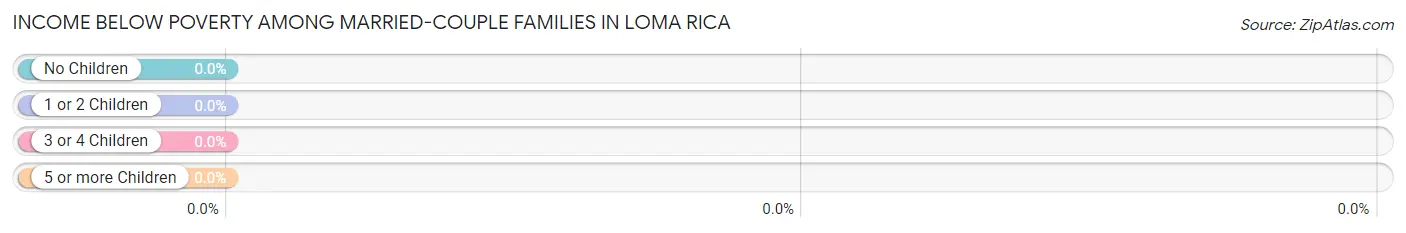
| Children | Above Poverty | Below Poverty |
| No Children | 546 (100.0%) | 0 (0.0%) |
| 1 or 2 Children | 126 (100.0%) | 0 (0.0%) |
| 3 or 4 Children | 19 (100.0%) | 0 (0.0%) |
| 5 or more Children | 22 (100.0%) | 0 (0.0%) |
| Total | 713 (100.0%) | 0 (0.0%) |
Income Below Poverty Among Single-Parent Households in Loma Rica
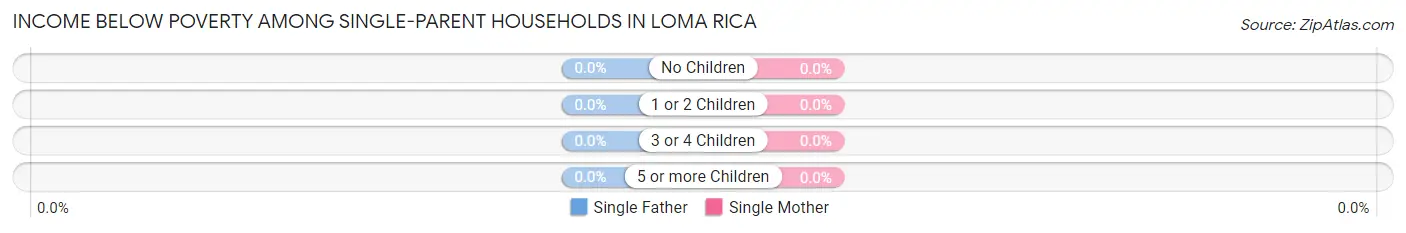
| Children | Single Father | Single Mother |
| No Children | 0 (0.0%) | 0 (0.0%) |
| 1 or 2 Children | 0 (0.0%) | 0 (0.0%) |
| 3 or 4 Children | 0 (0.0%) | 0 (0.0%) |
| 5 or more Children | 0 (0.0%) | 0 (0.0%) |
| Total | 0 (0.0%) | 0 (0.0%) |
Income Below Poverty Among Married-Couple vs Single-Parent Households in Loma Rica
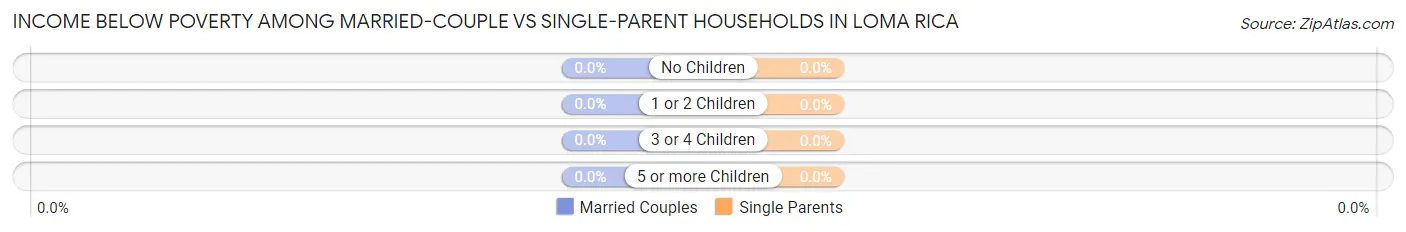
| Children | Married-Couple Families | Single-Parent Households |
| No Children | 0 (0.0%) | 0 (0.0%) |
| 1 or 2 Children | 0 (0.0%) | 0 (0.0%) |
| 3 or 4 Children | 0 (0.0%) | 0 (0.0%) |
| 5 or more Children | 0 (0.0%) | 0 (0.0%) |
| Total | 0 (0.0%) | 0 (0.0%) |
Race in Loma Rica
The most populous races in Loma Rica are White / Caucasian (2,351 | 90.2%), Hispanic or Latino (414 | 15.9%), and Two or more Races (149 | 5.7%).
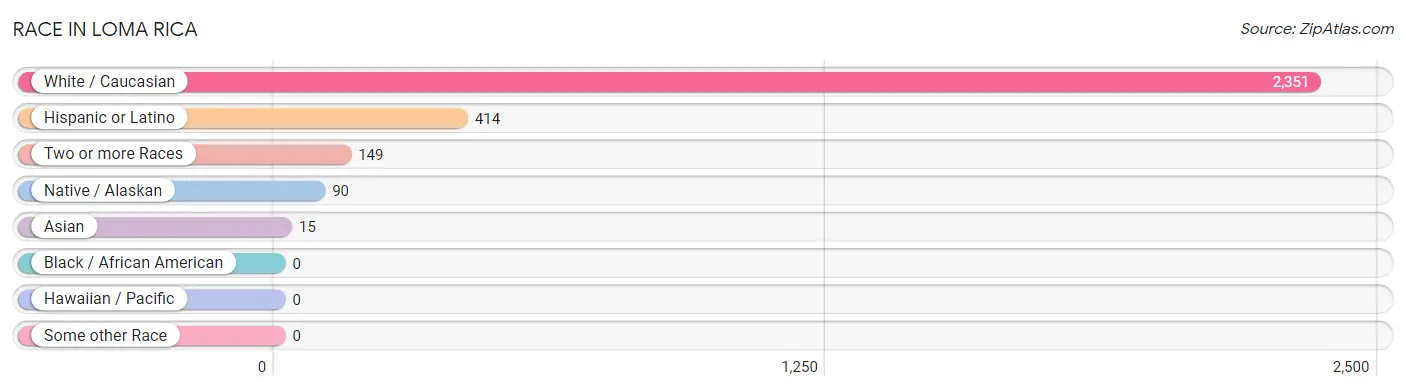
| Race | # Population | % Population |
| Asian | 15 | 0.6% |
| Black / African American | 0 | 0.0% |
| Hawaiian / Pacific | 0 | 0.0% |
| Hispanic or Latino | 414 | 15.9% |
| Native / Alaskan | 90 | 3.5% |
| White / Caucasian | 2,351 | 90.2% |
| Two or more Races | 149 | 5.7% |
| Some other Race | 0 | 0.0% |
| Total | 2,605 | 100.0% |
Ancestry in Loma Rica
The most populous ancestries reported in Loma Rica are English (398 | 15.3%), German (397 | 15.2%), Mexican (346 | 13.3%), Irish (274 | 10.5%), and American (116 | 4.4%), together accounting for 58.8% of all Loma Rica residents.
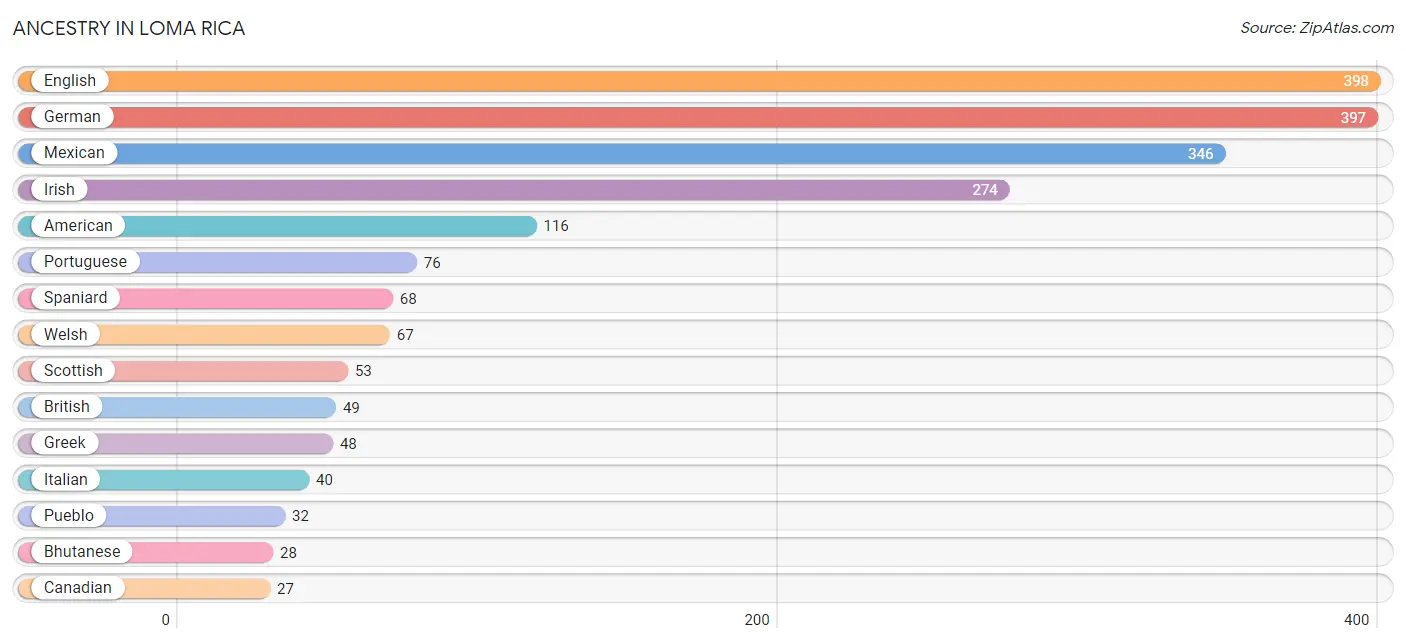
| Ancestry | # Population | % Population |
| American | 116 | 4.4% |
| Basque | 13 | 0.5% |
| Bhutanese | 28 | 1.1% |
| British | 49 | 1.9% |
| Canadian | 27 | 1.0% |
| English | 398 | 15.3% |
| European | 15 | 0.6% |
| German | 397 | 15.2% |
| Greek | 48 | 1.8% |
| Irish | 274 | 10.5% |
| Italian | 40 | 1.5% |
| Mexican | 346 | 13.3% |
| Polish | 17 | 0.6% |
| Portuguese | 76 | 2.9% |
| Pueblo | 32 | 1.2% |
| Scottish | 53 | 2.0% |
| Spaniard | 68 | 2.6% |
| Swedish | 16 | 0.6% |
| Ukrainian | 27 | 1.0% |
| Welsh | 67 | 2.6% | View All 20 Rows |
Immigrants in Loma Rica

| Immigration Origin | # Population | % Population | View All 0 Rows |
Sex and Age in Loma Rica
Sex and Age in Loma Rica
The most populous age groups in Loma Rica are 65 to 69 Years (253 | 21.0%) for men and 70 to 74 Years (200 | 14.3%) for women.
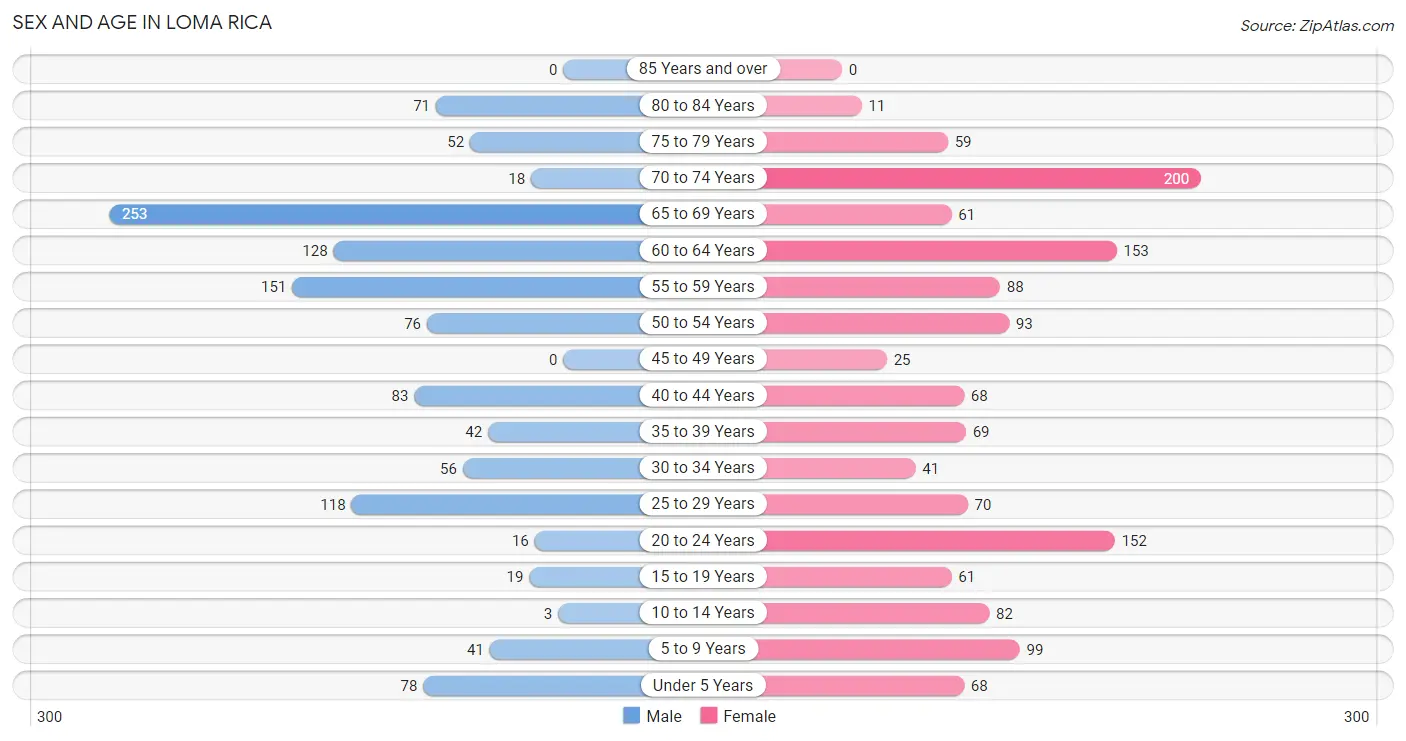
| Age Bracket | Male | Female |
| Under 5 Years | 78 (6.5%) | 68 (4.9%) |
| 5 to 9 Years | 41 (3.4%) | 99 (7.1%) |
| 10 to 14 Years | 3 (0.3%) | 82 (5.9%) |
| 15 to 19 Years | 19 (1.6%) | 61 (4.4%) |
| 20 to 24 Years | 16 (1.3%) | 152 (10.9%) |
| 25 to 29 Years | 118 (9.8%) | 70 (5.0%) |
| 30 to 34 Years | 56 (4.6%) | 41 (2.9%) |
| 35 to 39 Years | 42 (3.5%) | 69 (4.9%) |
| 40 to 44 Years | 83 (6.9%) | 68 (4.9%) |
| 45 to 49 Years | 0 (0.0%) | 25 (1.8%) |
| 50 to 54 Years | 76 (6.3%) | 93 (6.6%) |
| 55 to 59 Years | 151 (12.5%) | 88 (6.3%) |
| 60 to 64 Years | 128 (10.6%) | 153 (10.9%) |
| 65 to 69 Years | 253 (21.0%) | 61 (4.4%) |
| 70 to 74 Years | 18 (1.5%) | 200 (14.3%) |
| 75 to 79 Years | 52 (4.3%) | 59 (4.2%) |
| 80 to 84 Years | 71 (5.9%) | 11 (0.8%) |
| 85 Years and over | 0 (0.0%) | 0 (0.0%) |
| Total | 1,205 (100.0%) | 1,400 (100.0%) |
Families and Households in Loma Rica
Median Family Size in Loma Rica
The median family size in Loma Rica is 2.79 persons per family, with married-couple families (713 | 95.3%) accounting for the largest median family size of 2.8 persons per family. On the other hand, single female/mother families (18 | 2.4%) represent the smallest median family size with 2.50 persons per family.
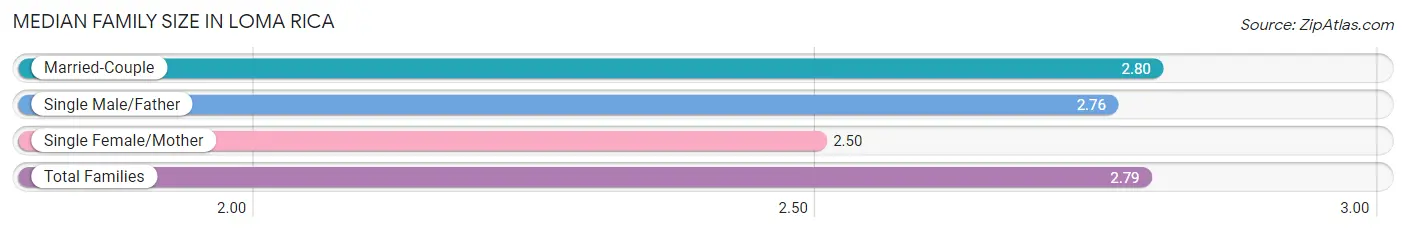
| Family Type | # Families | Family Size |
| Married-Couple | 713 (95.3%) | 2.80 |
| Single Male/Father | 17 (2.3%) | 2.76 |
| Single Female/Mother | 18 (2.4%) | 2.50 |
| Total Families | 748 (100.0%) | 2.79 |
Median Household Size in Loma Rica
The median household size in Loma Rica is 2.41 persons per household, with single male/father households (17 | 1.6%) accounting for the largest median household size of 3.71 persons per household. non-family households (329 | 30.5%) represent the smallest median household size with 1.37 persons per household.
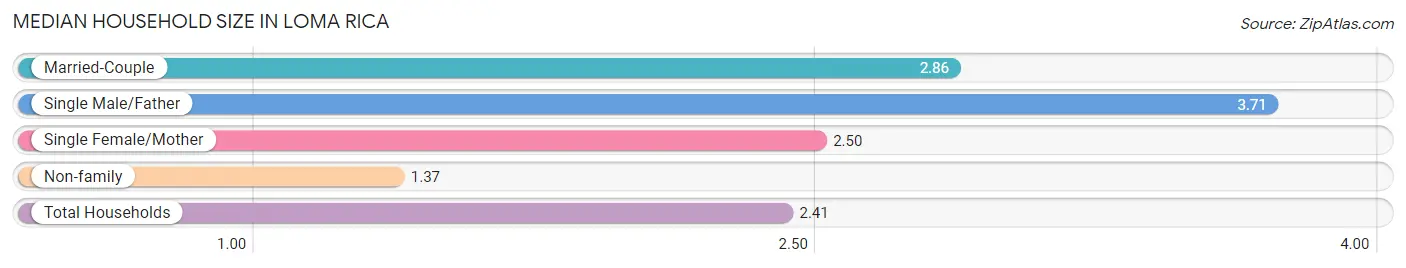
| Household Type | # Households | Household Size |
| Married-Couple | 713 (66.2%) | 2.86 |
| Single Male/Father | 17 (1.6%) | 3.71 |
| Single Female/Mother | 18 (1.7%) | 2.50 |
| Non-family | 329 (30.5%) | 1.37 |
| Total Households | 1,077 (100.0%) | 2.41 |
Household Size by Marriage Status in Loma Rica
Out of a total of 1,077 households in Loma Rica, 748 (69.5%) are family households, while 329 (30.5%) are nonfamily households. The most numerous type of family households are 2-person households, comprising 471, and the most common type of nonfamily households are 1-person households, comprising 186.
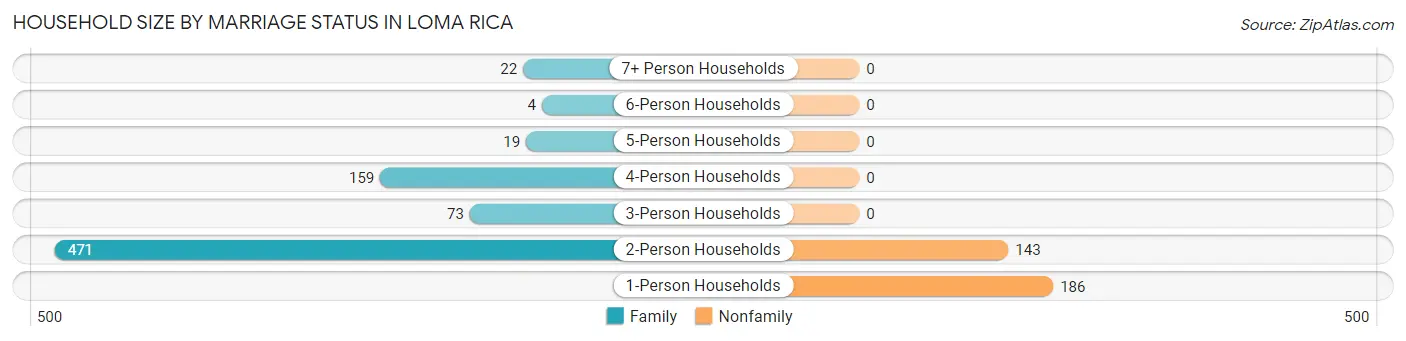
| Household Size | Family Households | Nonfamily Households |
| 1-Person Households | - | 186 (17.3%) |
| 2-Person Households | 471 (43.7%) | 143 (13.3%) |
| 3-Person Households | 73 (6.8%) | 0 (0.0%) |
| 4-Person Households | 159 (14.8%) | 0 (0.0%) |
| 5-Person Households | 19 (1.8%) | 0 (0.0%) |
| 6-Person Households | 4 (0.4%) | 0 (0.0%) |
| 7+ Person Households | 22 (2.0%) | 0 (0.0%) |
| Total | 748 (69.5%) | 329 (30.5%) |
Female Fertility in Loma Rica
Fertility by Age in Loma Rica
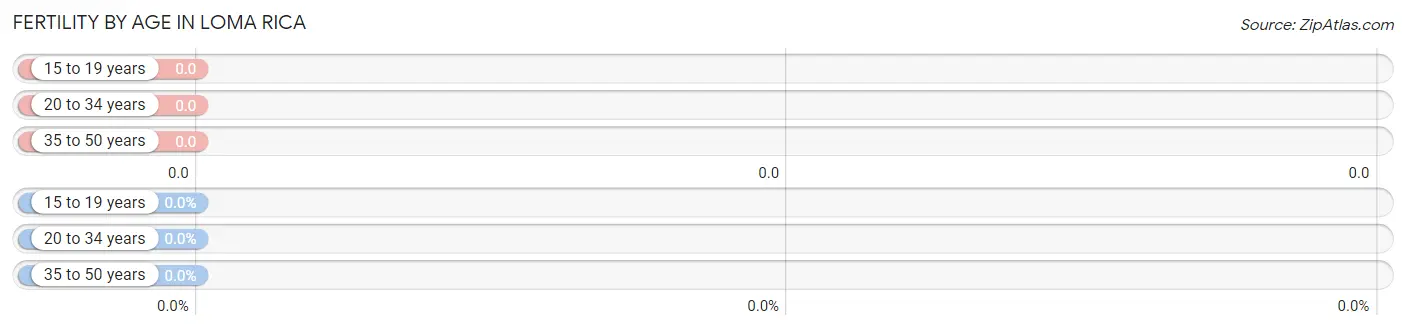
| Age Bracket | Women with Births | Births / 1,000 Women |
| 15 to 19 years | 0 (0.0%) | 0.0 |
| 20 to 34 years | 0 (0.0%) | 0.0 |
| 35 to 50 years | 0 (0.0%) | 0.0 |
| Total | 0 (0.0%) | 0.0 |
Fertility by Age by Marriage Status in Loma Rica
| Age Bracket | Married | Unmarried |
| 15 to 19 years | 0 (0.0%) | 0 (0.0%) |
| 20 to 34 years | 0 (0.0%) | 0 (0.0%) |
| 35 to 50 years | 0 (0.0%) | 0 (0.0%) |
| Total | 0 (0.0%) | 0 (0.0%) |
Fertility by Education in Loma Rica
| Educational Attainment | Women with Births | Births / 1,000 Women |
| Less than High School | 0 (0.0%) | 0.0 |
| High School Diploma | 0 (0.0%) | 0.0 |
| College or Associate's Degree | 0 (0.0%) | 0.0 |
| Bachelor's Degree | 0 (0.0%) | 0.0 |
| Graduate Degree | 0 (0.0%) | 0.0 |
| Total | 0 (0.0%) | 0.0 |
Fertility by Education by Marriage Status in Loma Rica
| Educational Attainment | Married | Unmarried |
| Less than High School | 0 (0.0%) | 0 (0.0%) |
| High School Diploma | 0 (0.0%) | 0 (0.0%) |
| College or Associate's Degree | 0 (0.0%) | 0 (0.0%) |
| Bachelor's Degree | 0 (0.0%) | 0 (0.0%) |
| Graduate Degree | 0 (0.0%) | 0 (0.0%) |
| Total | 0 (0.0%) | 0 (0.0%) |
Employment Characteristics in Loma Rica
Employment by Class of Employer in Loma Rica
Among the 935 employed individuals in Loma Rica, private company employees (423 | 45.2%), self-employed (not incorporated) (164 | 17.5%), and state government employees (139 | 14.9%) make up the most common classes of employment.
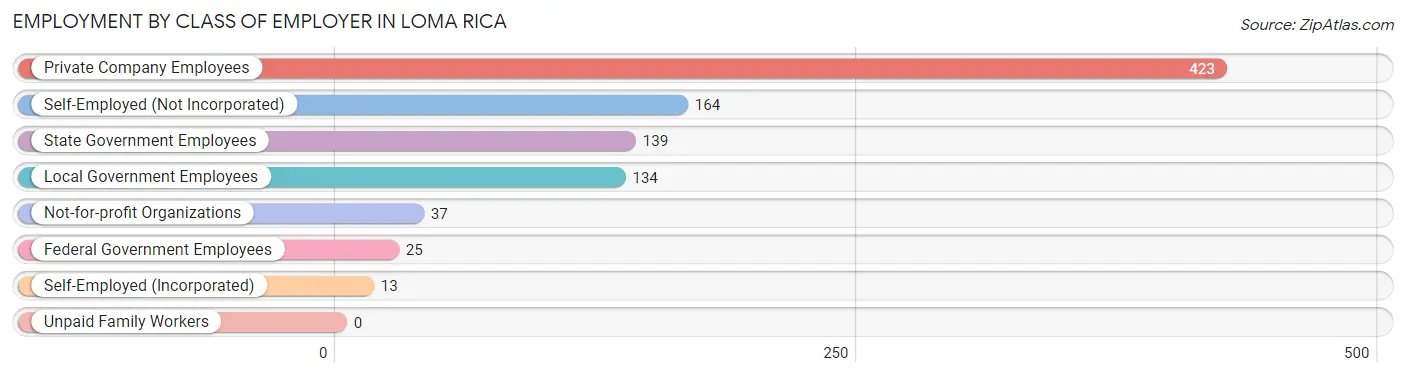
| Employer Class | # Employees | % Employees |
| Private Company Employees | 423 | 45.2% |
| Self-Employed (Incorporated) | 13 | 1.4% |
| Self-Employed (Not Incorporated) | 164 | 17.5% |
| Not-for-profit Organizations | 37 | 4.0% |
| Local Government Employees | 134 | 14.3% |
| State Government Employees | 139 | 14.9% |
| Federal Government Employees | 25 | 2.7% |
| Unpaid Family Workers | 0 | 0.0% |
| Total | 935 | 100.0% |
Employment Status by Age in Loma Rica
According to the labor force statistics for Loma Rica, out of the total population over 16 years of age (2,189), 46.6% or 1,020 individuals are in the labor force, with 4.8% or 49 of them unemployed. The age group with the highest labor force participation rate is 25 to 29 years, with 100.0% or 188 individuals in the labor force. Within the labor force, the 35 to 44 years age range has the highest percentage of unemployed individuals, with 17.5% or 32 of them being unemployed.
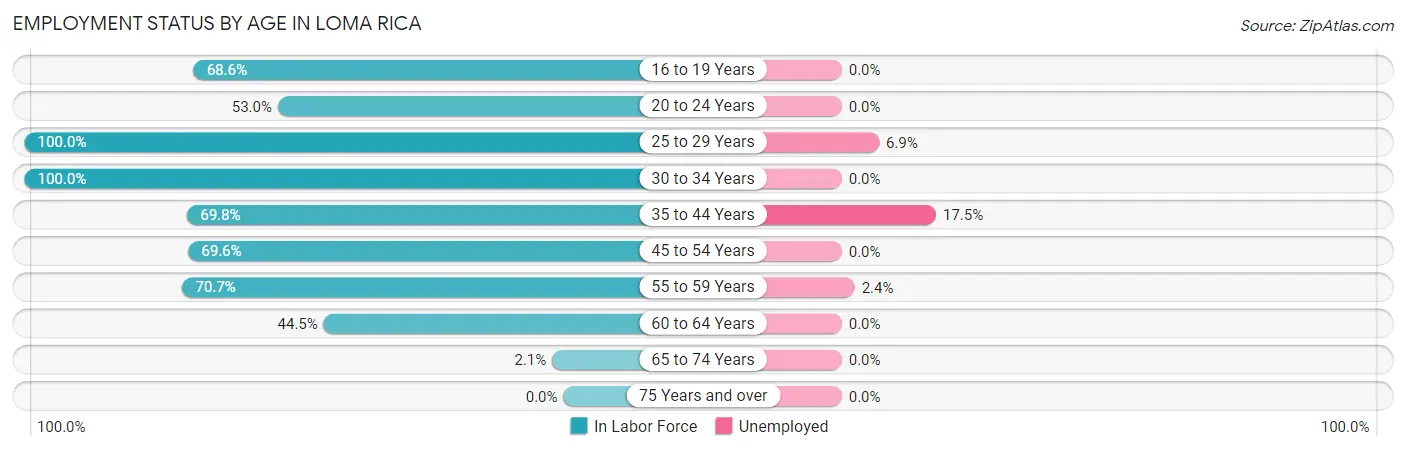
| Age Bracket | In Labor Force | Unemployed |
| 16 to 19 Years | 24 (68.6%) | 0 (0.0%) |
| 20 to 24 Years | 89 (53.0%) | 0 (0.0%) |
| 25 to 29 Years | 188 (100.0%) | 13 (6.9%) |
| 30 to 34 Years | 97 (100.0%) | 0 (0.0%) |
| 35 to 44 Years | 183 (69.8%) | 32 (17.5%) |
| 45 to 54 Years | 135 (69.6%) | 0 (0.0%) |
| 55 to 59 Years | 169 (70.7%) | 4 (2.4%) |
| 60 to 64 Years | 125 (44.5%) | 0 (0.0%) |
| 65 to 74 Years | 11 (2.1%) | 0 (0.0%) |
| 75 Years and over | 0 (0.0%) | 0 (0.0%) |
| Total | 1,020 (46.6%) | 49 (4.8%) |
Employment Status by Educational Attainment in Loma Rica
According to labor force statistics for Loma Rica, 71.1% of individuals (897) out of the total population between 25 and 64 years of age (1,261) are in the labor force, with 5.5% or 49 of them being unemployed. The group with the highest labor force participation rate are those with the educational attainment of bachelor's degree or higher, with 81.6% or 173 individuals in the labor force. Within the labor force, individuals with less than high school education have the highest percentage of unemployment, with 45.1% or 32 of them being unemployed.
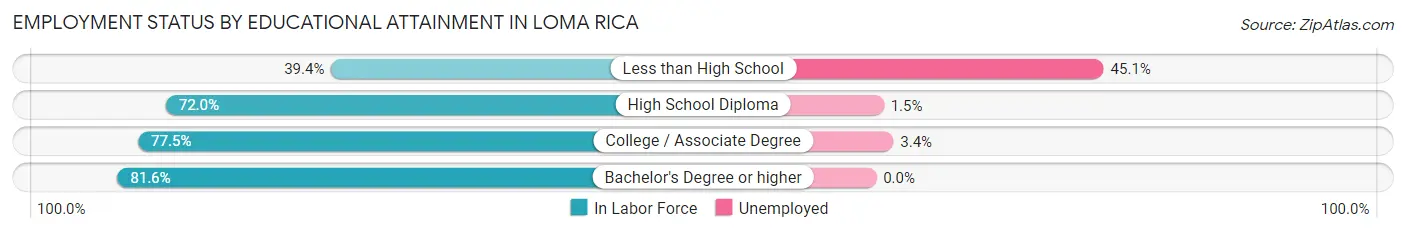
| Educational Attainment | In Labor Force | Unemployed |
| Less than High School | 71 (39.4%) | 81 (45.1%) |
| High School Diploma | 267 (72.0%) | 6 (1.5%) |
| College / Associate Degree | 386 (77.5%) | 17 (3.4%) |
| Bachelor's Degree or higher | 173 (81.6%) | 0 (0.0%) |
| Total | 897 (71.1%) | 69 (5.5%) |
Employment Occupations by Sex in Loma Rica
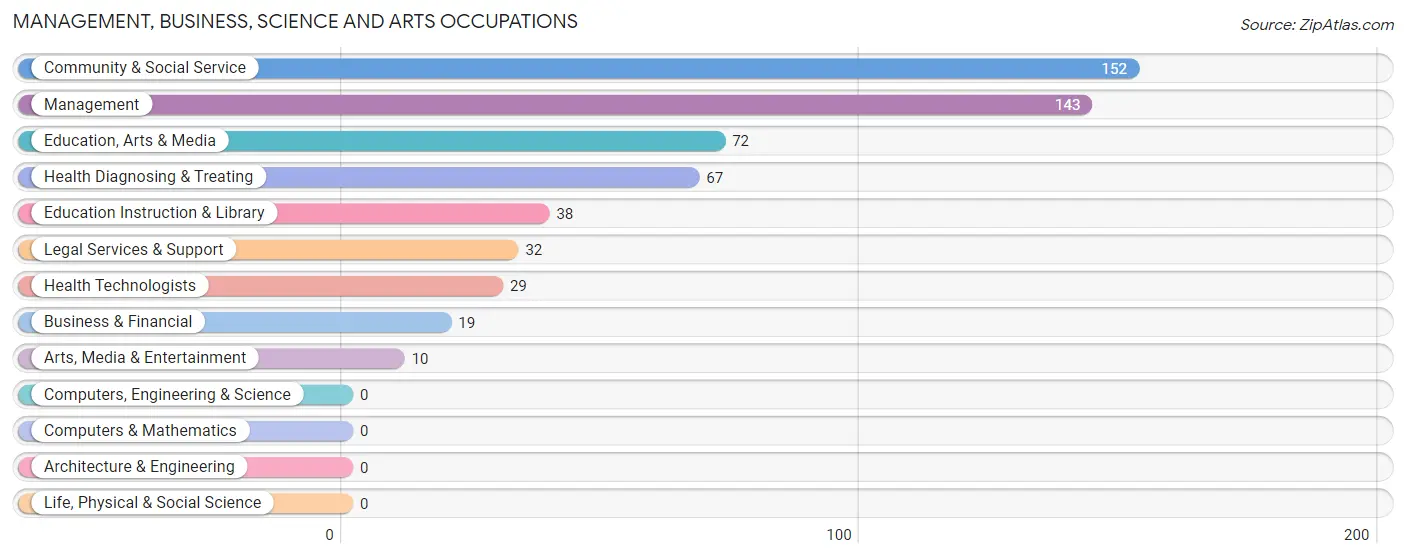
Management, Business, Science and Arts Occupations
The most common Management, Business, Science and Arts occupations in Loma Rica are Community & Social Service (152 | 15.6%), Management (143 | 14.7%), Education, Arts & Media (72 | 7.4%), Health Diagnosing & Treating (67 | 6.9%), and Education Instruction & Library (38 | 3.9%).
Management, Business, Science and Arts Occupations by Sex
Within the Management, Business, Science and Arts occupations in Loma Rica, the most male-oriented occupations are Business & Financial (100.0%), Management (66.4%), and Health Diagnosing & Treating (56.7%), while the most female-oriented occupations are Community & Social Service (100.0%), Education, Arts & Media (100.0%), and Legal Services & Support (100.0%).
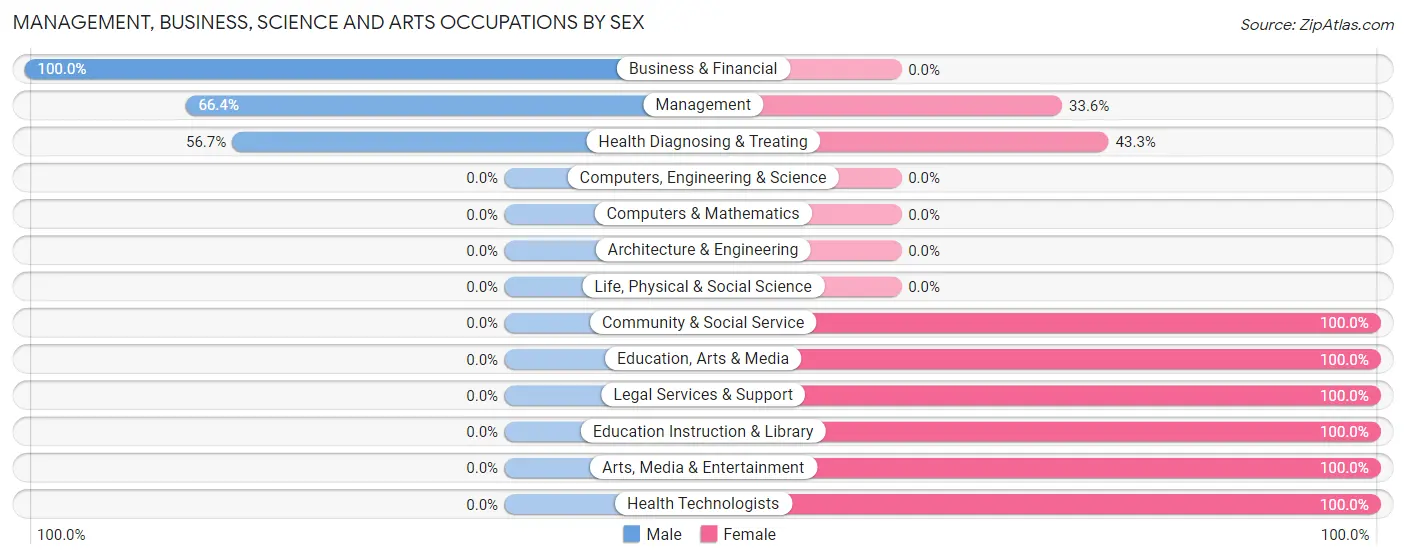
| Occupation | Male | Female |
| Management | 95 (66.4%) | 48 (33.6%) |
| Business & Financial | 19 (100.0%) | 0 (0.0%) |
| Computers, Engineering & Science | 0 (0.0%) | 0 (0.0%) |
| Computers & Mathematics | 0 (0.0%) | 0 (0.0%) |
| Architecture & Engineering | 0 (0.0%) | 0 (0.0%) |
| Life, Physical & Social Science | 0 (0.0%) | 0 (0.0%) |
| Community & Social Service | 0 (0.0%) | 152 (100.0%) |
| Education, Arts & Media | 0 (0.0%) | 72 (100.0%) |
| Legal Services & Support | 0 (0.0%) | 32 (100.0%) |
| Education Instruction & Library | 0 (0.0%) | 38 (100.0%) |
| Arts, Media & Entertainment | 0 (0.0%) | 10 (100.0%) |
| Health Diagnosing & Treating | 38 (56.7%) | 29 (43.3%) |
| Health Technologists | 0 (0.0%) | 29 (100.0%) |
| Total (Category) | 152 (39.9%) | 229 (60.1%) |
| Total (Overall) | 526 (54.1%) | 446 (45.9%) |
Services Occupations
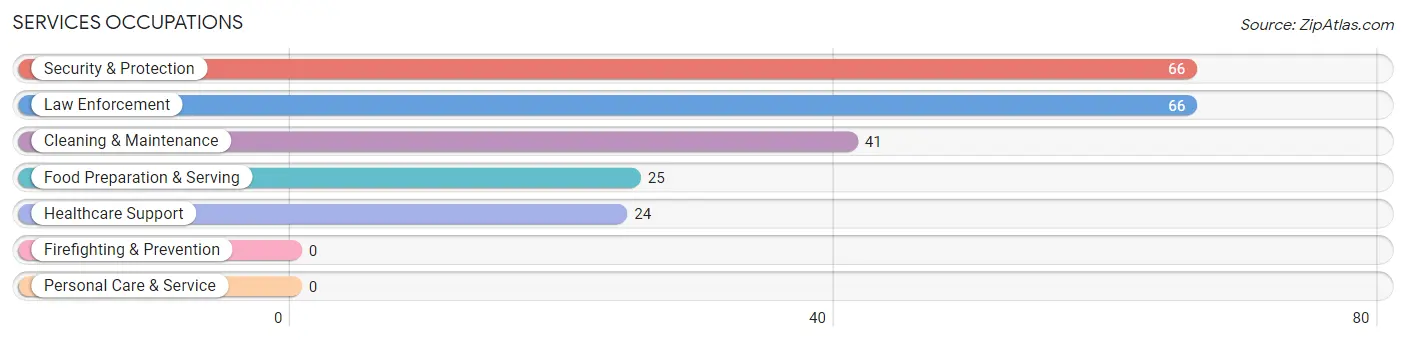
The most common Services occupations in Loma Rica are Security & Protection (66 | 6.8%), Law Enforcement (66 | 6.8%), Cleaning & Maintenance (41 | 4.2%), Food Preparation & Serving (25 | 2.6%), and Healthcare Support (24 | 2.5%).
Services Occupations by Sex
Within the Services occupations in Loma Rica, the most male-oriented occupations are Security & Protection (100.0%), Law Enforcement (100.0%), and Cleaning & Maintenance (63.4%), while the most female-oriented occupations are Healthcare Support (100.0%), Food Preparation & Serving (100.0%), and Cleaning & Maintenance (36.6%).
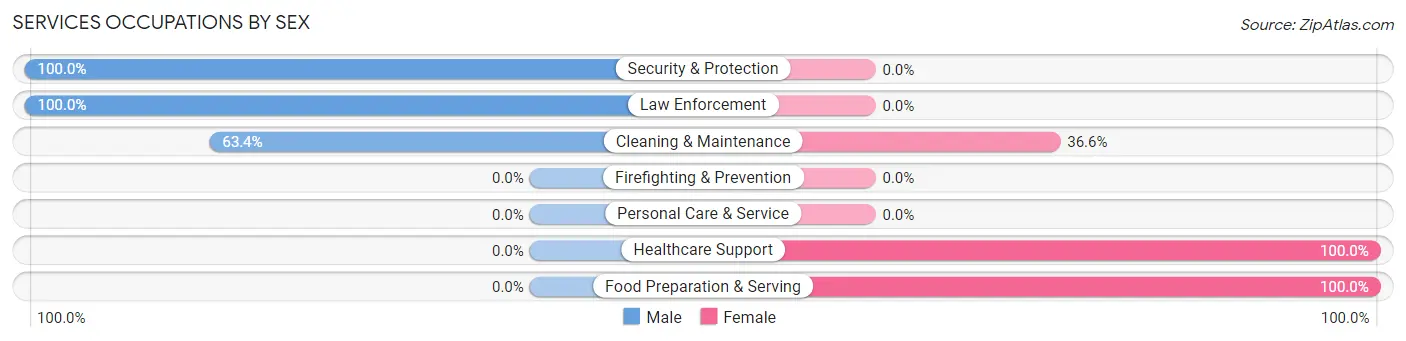
| Occupation | Male | Female |
| Healthcare Support | 0 (0.0%) | 24 (100.0%) |
| Security & Protection | 66 (100.0%) | 0 (0.0%) |
| Firefighting & Prevention | 0 (0.0%) | 0 (0.0%) |
| Law Enforcement | 66 (100.0%) | 0 (0.0%) |
| Food Preparation & Serving | 0 (0.0%) | 25 (100.0%) |
| Cleaning & Maintenance | 26 (63.4%) | 15 (36.6%) |
| Personal Care & Service | 0 (0.0%) | 0 (0.0%) |
| Total (Category) | 92 (59.0%) | 64 (41.0%) |
| Total (Overall) | 526 (54.1%) | 446 (45.9%) |
Sales and Office Occupations
The most common Sales and Office occupations in Loma Rica are Sales & Related (76 | 7.8%), and Office & Administration (52 | 5.3%).

Sales and Office Occupations by Sex

| Occupation | Male | Female |
| Sales & Related | 21 (27.6%) | 55 (72.4%) |
| Office & Administration | 0 (0.0%) | 52 (100.0%) |
| Total (Category) | 21 (16.4%) | 107 (83.6%) |
| Total (Overall) | 526 (54.1%) | 446 (45.9%) |
Natural Resources, Construction and Maintenance Occupations
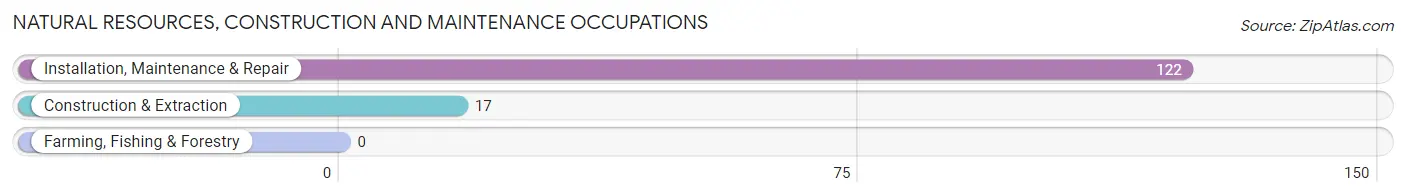
The most common Natural Resources, Construction and Maintenance occupations in Loma Rica are Installation, Maintenance & Repair (122 | 12.6%), and Construction & Extraction (17 | 1.8%).
Natural Resources, Construction and Maintenance Occupations by Sex
| Occupation | Male | Female |
| Farming, Fishing & Forestry | 0 (0.0%) | 0 (0.0%) |
| Construction & Extraction | 17 (100.0%) | 0 (0.0%) |
| Installation, Maintenance & Repair | 122 (100.0%) | 0 (0.0%) |
| Total (Category) | 139 (100.0%) | 0 (0.0%) |
| Total (Overall) | 526 (54.1%) | 446 (45.9%) |
Production, Transportation and Moving Occupations
The most common Production, Transportation and Moving occupations in Loma Rica are Transportation (105 | 10.8%), Production (42 | 4.3%), and Material Moving (21 | 2.2%).
Production, Transportation and Moving Occupations by Sex
| Occupation | Male | Female |
| Production | 37 (88.1%) | 5 (11.9%) |
| Transportation | 85 (80.9%) | 20 (19.1%) |
| Material Moving | 0 (0.0%) | 21 (100.0%) |
| Total (Category) | 122 (72.6%) | 46 (27.4%) |
| Total (Overall) | 526 (54.1%) | 446 (45.9%) |
Employment Industries by Sex in Loma Rica
Employment Industries in Loma Rica
The major employment industries in Loma Rica include Public Administration (183 | 18.8%), Transportation & Warehousing (105 | 10.8%), Professional & Scientific (102 | 10.5%), Health Care & Social Assistance (91 | 9.4%), and Construction (87 | 8.9%).
Employment Industries by Sex in Loma Rica
The Loma Rica industries that see more men than women are Agriculture, Fishing & Hunting (100.0%), Construction (100.0%), and Manufacturing (100.0%), whereas the industries that tend to have a higher number of women are Real Estate, Rental & Leasing (100.0%), Educational Services (100.0%), and Accommodation & Food Services (100.0%).
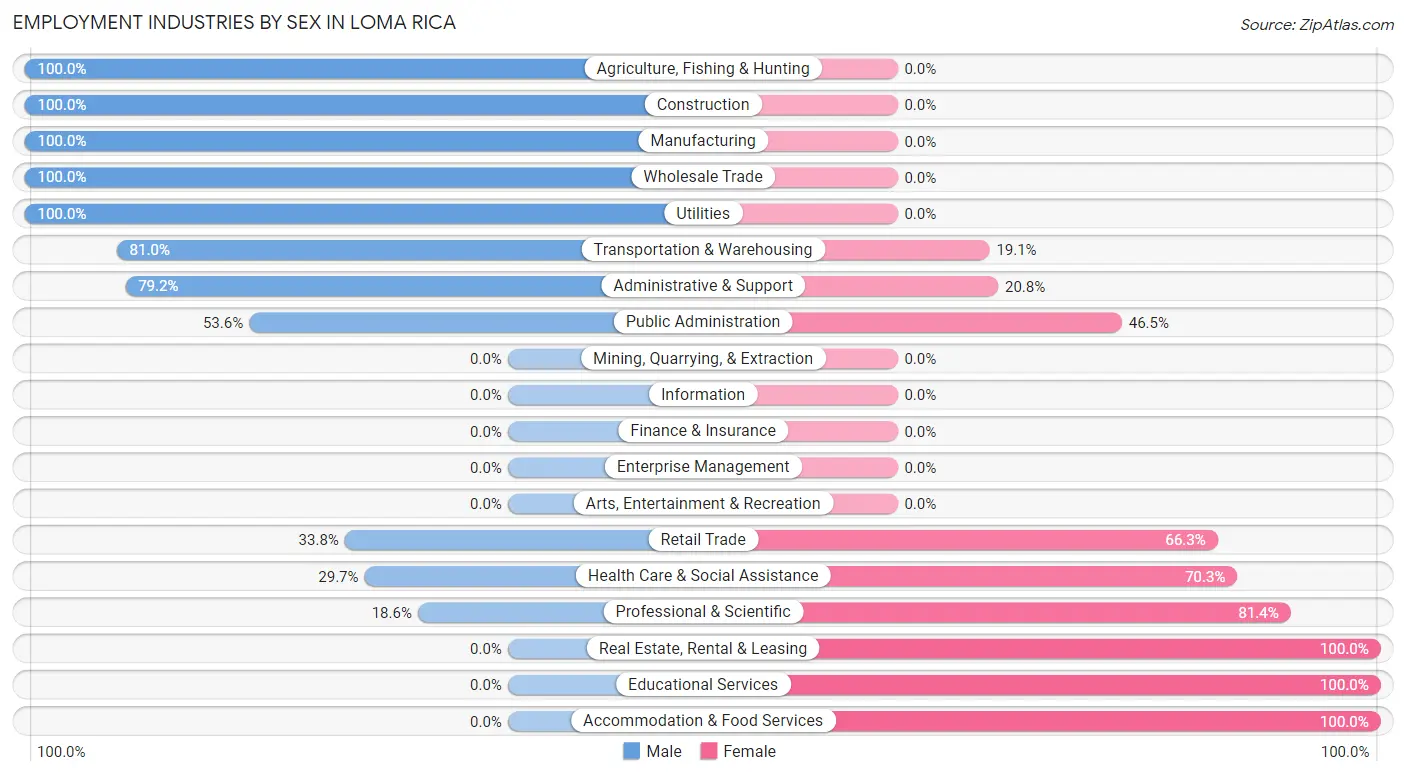
| Industry | Male | Female |
| Agriculture, Fishing & Hunting | 29 (100.0%) | 0 (0.0%) |
| Mining, Quarrying, & Extraction | 0 (0.0%) | 0 (0.0%) |
| Construction | 87 (100.0%) | 0 (0.0%) |
| Manufacturing | 14 (100.0%) | 0 (0.0%) |
| Wholesale Trade | 16 (100.0%) | 0 (0.0%) |
| Retail Trade | 27 (33.8%) | 53 (66.2%) |
| Transportation & Warehousing | 85 (80.9%) | 20 (19.1%) |
| Utilities | 23 (100.0%) | 0 (0.0%) |
| Information | 0 (0.0%) | 0 (0.0%) |
| Finance & Insurance | 0 (0.0%) | 0 (0.0%) |
| Real Estate, Rental & Leasing | 0 (0.0%) | 11 (100.0%) |
| Professional & Scientific | 19 (18.6%) | 83 (81.4%) |
| Enterprise Management | 0 (0.0%) | 0 (0.0%) |
| Administrative & Support | 38 (79.2%) | 10 (20.8%) |
| Educational Services | 0 (0.0%) | 85 (100.0%) |
| Health Care & Social Assistance | 27 (29.7%) | 64 (70.3%) |
| Arts, Entertainment & Recreation | 0 (0.0%) | 0 (0.0%) |
| Accommodation & Food Services | 0 (0.0%) | 5 (100.0%) |
| Public Administration | 98 (53.5%) | 85 (46.5%) |
| Total | 526 (54.1%) | 446 (45.9%) |
Education in Loma Rica
School Enrollment in Loma Rica
The most common levels of schooling among the 460 students in Loma Rica are elementary school (140 | 30.4%), college / undergraduate (133 | 28.9%), and high school (87 | 18.9%).
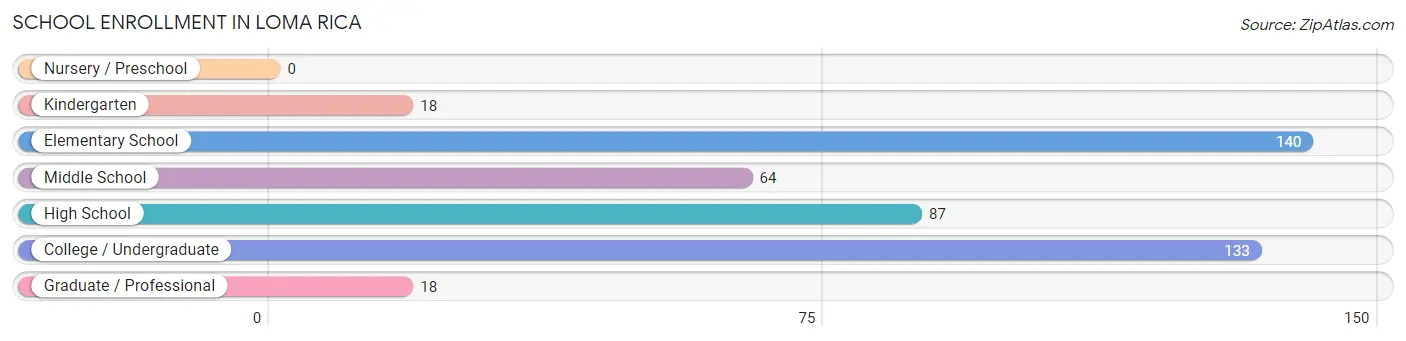
| School Level | # Students | % Students |
| Nursery / Preschool | 0 | 0.0% |
| Kindergarten | 18 | 3.9% |
| Elementary School | 140 | 30.4% |
| Middle School | 64 | 13.9% |
| High School | 87 | 18.9% |
| College / Undergraduate | 133 | 28.9% |
| Graduate / Professional | 18 | 3.9% |
| Total | 460 | 100.0% |
School Enrollment by Age by Funding Source in Loma Rica
Out of a total of 460 students who are enrolled in schools in Loma Rica, 51 (11.1%) attend a private institution, while the remaining 409 (88.9%) are enrolled in public schools. The age group of 18 to 19 year olds has the highest likelihood of being enrolled in private schools, with 11 (100.0% in the age bracket) enrolled. Conversely, the age group of 5 to 9 year old has the lowest likelihood of being enrolled in a private school, with 140 (100.0% in the age bracket) attending a public institution.
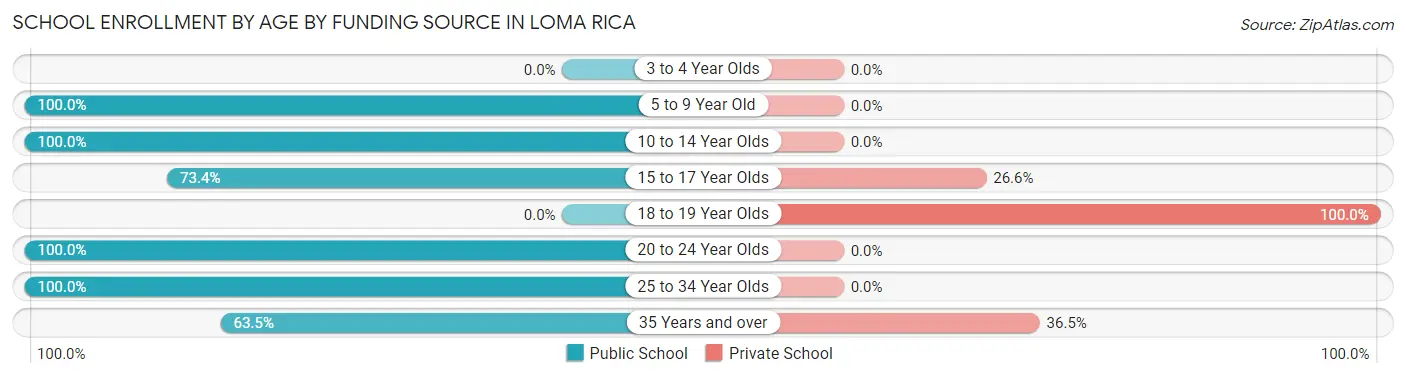
| Age Bracket | Public School | Private School |
| 3 to 4 Year Olds | 0 (0.0%) | 0 (0.0%) |
| 5 to 9 Year Old | 140 (100.0%) | 0 (0.0%) |
| 10 to 14 Year Olds | 85 (100.0%) | 0 (0.0%) |
| 15 to 17 Year Olds | 47 (73.4%) | 17 (26.6%) |
| 18 to 19 Year Olds | 0 (0.0%) | 11 (100.0%) |
| 20 to 24 Year Olds | 52 (100.0%) | 0 (0.0%) |
| 25 to 34 Year Olds | 45 (100.0%) | 0 (0.0%) |
| 35 Years and over | 40 (63.5%) | 23 (36.5%) |
| Total | 409 (88.9%) | 51 (11.1%) |
Educational Attainment by Field of Study in Loma Rica
Engineering (176 | 27.4%), arts & humanities (112 | 17.4%), business (73 | 11.4%), social sciences (63 | 9.8%), and education (60 | 9.3%) are the most common fields of study among 642 individuals in Loma Rica who have obtained a bachelor's degree or higher.
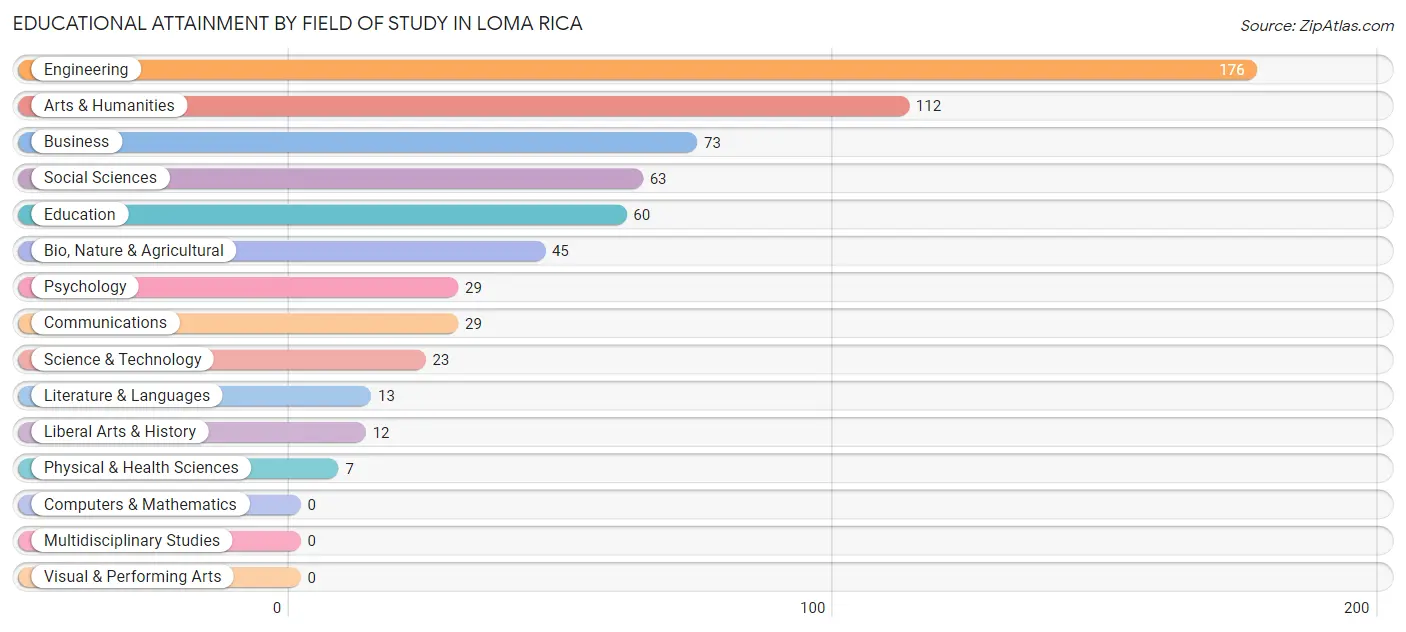
| Field of Study | # Graduates | % Graduates |
| Computers & Mathematics | 0 | 0.0% |
| Bio, Nature & Agricultural | 45 | 7.0% |
| Physical & Health Sciences | 7 | 1.1% |
| Psychology | 29 | 4.5% |
| Social Sciences | 63 | 9.8% |
| Engineering | 176 | 27.4% |
| Multidisciplinary Studies | 0 | 0.0% |
| Science & Technology | 23 | 3.6% |
| Business | 73 | 11.4% |
| Education | 60 | 9.3% |
| Literature & Languages | 13 | 2.0% |
| Liberal Arts & History | 12 | 1.9% |
| Visual & Performing Arts | 0 | 0.0% |
| Communications | 29 | 4.5% |
| Arts & Humanities | 112 | 17.4% |
| Total | 642 | 100.0% |
Transportation & Commute in Loma Rica
Vehicle Availability by Sex in Loma Rica
The most prevalent vehicle ownership categories in Loma Rica are males with 2 vehicles (187, accounting for 37.6%) and females with 2 vehicles (111, making up 43.3%).
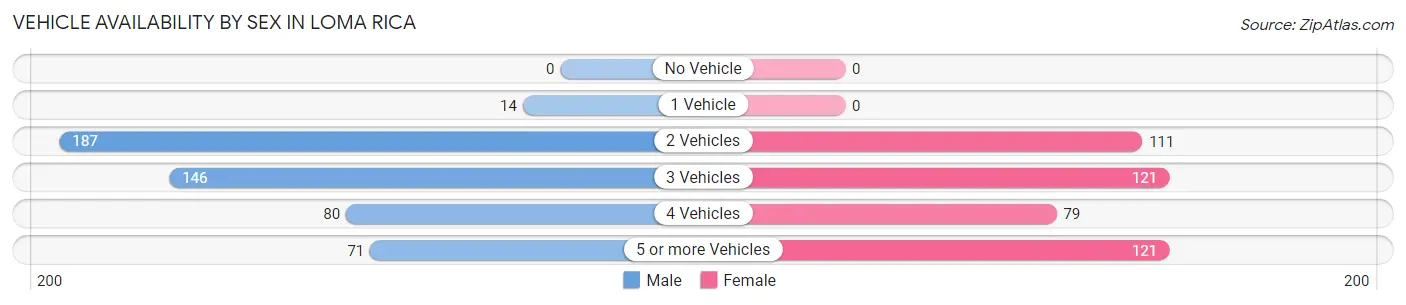
| Vehicles Available | Male | Female |
| No Vehicle | 0 (0.0%) | 0 (0.0%) |
| 1 Vehicle | 14 (2.8%) | 0 (0.0%) |
| 2 Vehicles | 187 (37.6%) | 111 (25.7%) |
| 3 Vehicles | 146 (29.3%) | 121 (28.0%) |
| 4 Vehicles | 80 (16.1%) | 79 (18.3%) |
| 5 or more Vehicles | 71 (14.3%) | 121 (28.0%) |
| Total | 498 (100.0%) | 432 (100.0%) |
Commute Time in Loma Rica
The most frequently occuring commute durations in Loma Rica are 60 to 89 minutes (244 commuters, 28.9%), 25 to 29 minutes (135 commuters, 16.0%), and 45 to 59 minutes (117 commuters, 13.9%).
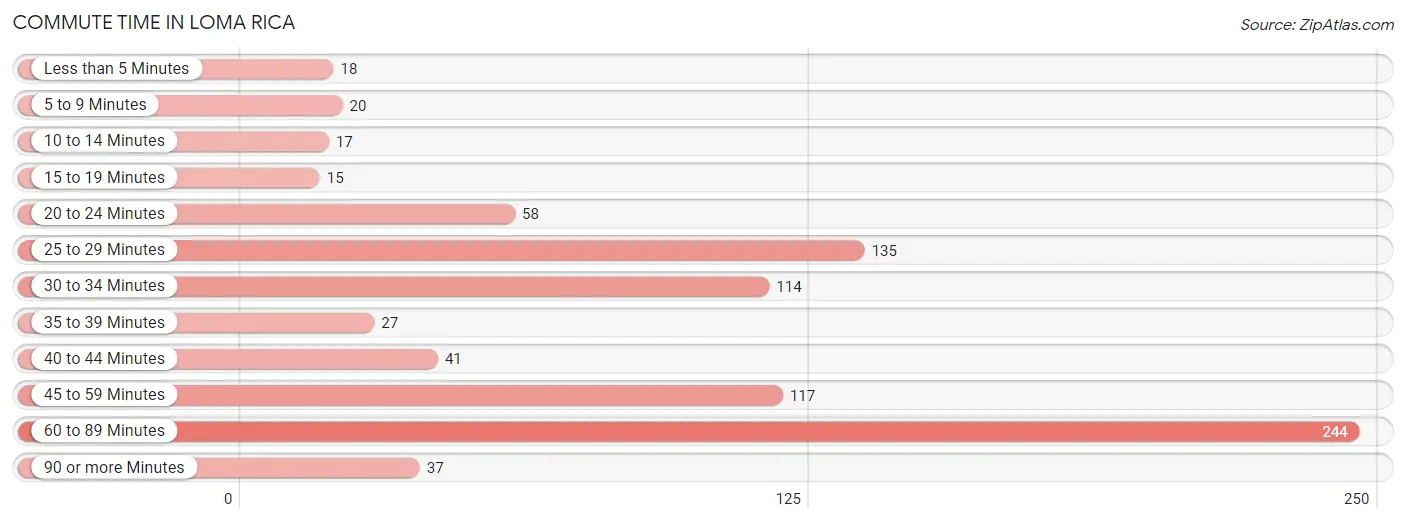
| Commute Time | # Commuters | % Commuters |
| Less than 5 Minutes | 18 | 2.1% |
| 5 to 9 Minutes | 20 | 2.4% |
| 10 to 14 Minutes | 17 | 2.0% |
| 15 to 19 Minutes | 15 | 1.8% |
| 20 to 24 Minutes | 58 | 6.9% |
| 25 to 29 Minutes | 135 | 16.0% |
| 30 to 34 Minutes | 114 | 13.5% |
| 35 to 39 Minutes | 27 | 3.2% |
| 40 to 44 Minutes | 41 | 4.9% |
| 45 to 59 Minutes | 117 | 13.9% |
| 60 to 89 Minutes | 244 | 28.9% |
| 90 or more Minutes | 37 | 4.4% |
Commute Time by Sex in Loma Rica
The most common commute times in Loma Rica are 60 to 89 minutes (147 commuters, 33.3%) for males and 60 to 89 minutes (97 commuters, 24.2%) for females.
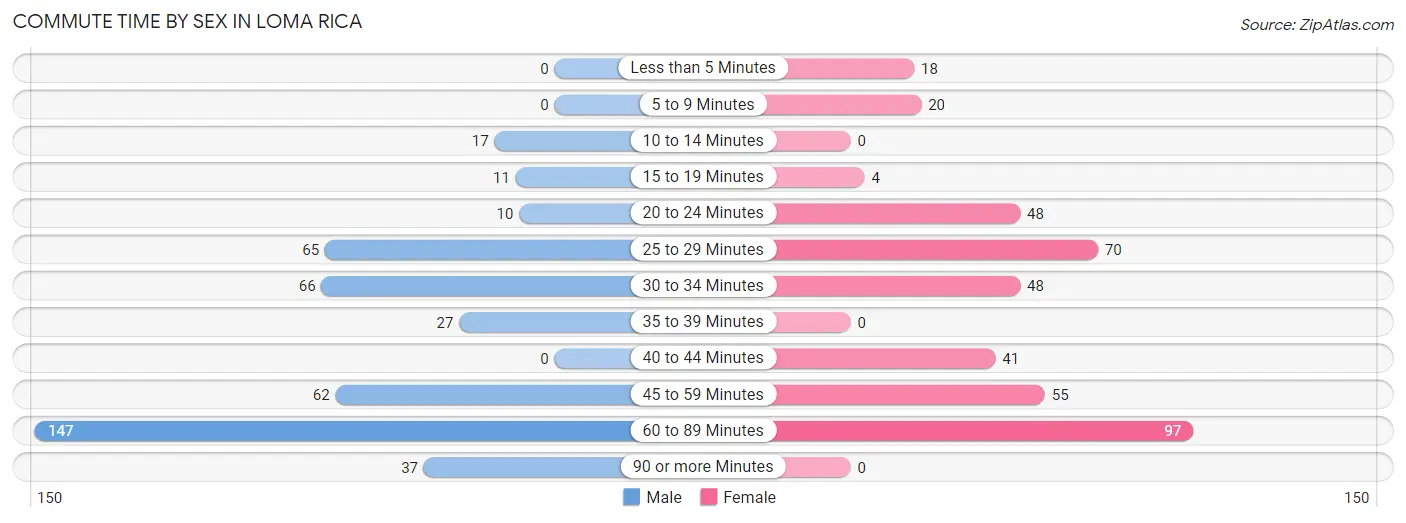
| Commute Time | Male | Female |
| Less than 5 Minutes | 0 (0.0%) | 18 (4.5%) |
| 5 to 9 Minutes | 0 (0.0%) | 20 (5.0%) |
| 10 to 14 Minutes | 17 (3.8%) | 0 (0.0%) |
| 15 to 19 Minutes | 11 (2.5%) | 4 (1.0%) |
| 20 to 24 Minutes | 10 (2.3%) | 48 (12.0%) |
| 25 to 29 Minutes | 65 (14.7%) | 70 (17.5%) |
| 30 to 34 Minutes | 66 (14.9%) | 48 (12.0%) |
| 35 to 39 Minutes | 27 (6.1%) | 0 (0.0%) |
| 40 to 44 Minutes | 0 (0.0%) | 41 (10.2%) |
| 45 to 59 Minutes | 62 (14.0%) | 55 (13.7%) |
| 60 to 89 Minutes | 147 (33.3%) | 97 (24.2%) |
| 90 or more Minutes | 37 (8.4%) | 0 (0.0%) |
Time of Departure to Work by Sex in Loma Rica
The most frequent times of departure to work in Loma Rica are 7:00 AM to 7:29 AM (185, 41.9%) for males and 6:00 AM to 6:29 AM (157, 39.2%) for females.
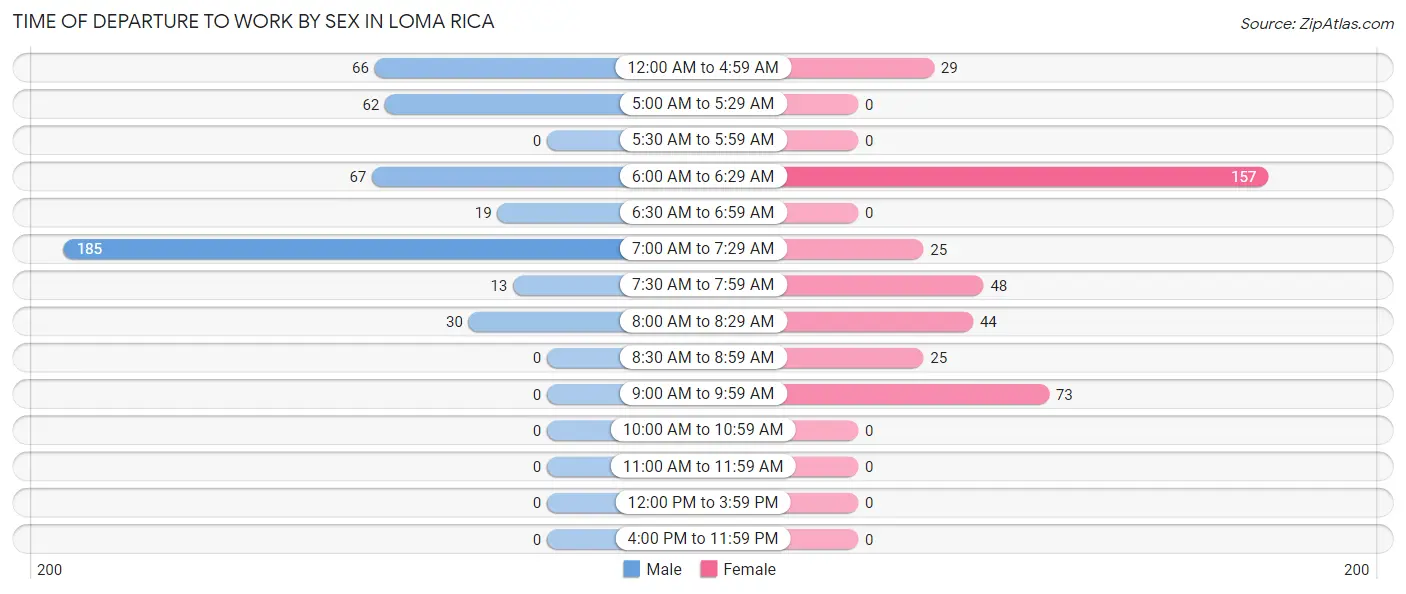
| Time of Departure | Male | Female |
| 12:00 AM to 4:59 AM | 66 (14.9%) | 29 (7.2%) |
| 5:00 AM to 5:29 AM | 62 (14.0%) | 0 (0.0%) |
| 5:30 AM to 5:59 AM | 0 (0.0%) | 0 (0.0%) |
| 6:00 AM to 6:29 AM | 67 (15.2%) | 157 (39.2%) |
| 6:30 AM to 6:59 AM | 19 (4.3%) | 0 (0.0%) |
| 7:00 AM to 7:29 AM | 185 (41.9%) | 25 (6.2%) |
| 7:30 AM to 7:59 AM | 13 (2.9%) | 48 (12.0%) |
| 8:00 AM to 8:29 AM | 30 (6.8%) | 44 (11.0%) |
| 8:30 AM to 8:59 AM | 0 (0.0%) | 25 (6.2%) |
| 9:00 AM to 9:59 AM | 0 (0.0%) | 73 (18.2%) |
| 10:00 AM to 10:59 AM | 0 (0.0%) | 0 (0.0%) |
| 11:00 AM to 11:59 AM | 0 (0.0%) | 0 (0.0%) |
| 12:00 PM to 3:59 PM | 0 (0.0%) | 0 (0.0%) |
| 4:00 PM to 11:59 PM | 0 (0.0%) | 0 (0.0%) |
| Total | 442 (100.0%) | 401 (100.0%) |
Housing Occupancy in Loma Rica
Occupancy by Ownership in Loma Rica
Of the total 1,077 dwellings in Loma Rica, owner-occupied units account for 848 (78.7%), while renter-occupied units make up 229 (21.3%).
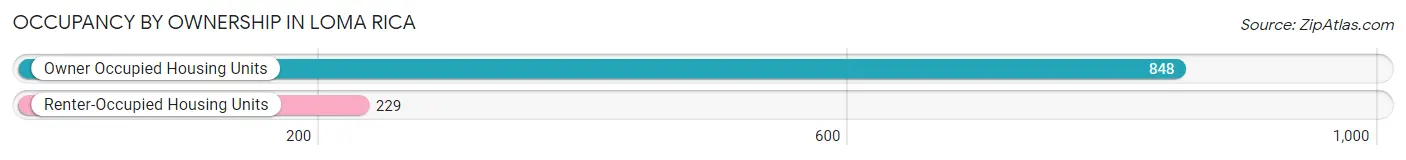
| Occupancy | # Housing Units | % Housing Units |
| Owner Occupied Housing Units | 848 | 78.7% |
| Renter-Occupied Housing Units | 229 | 21.3% |
| Total Occupied Housing Units | 1,077 | 100.0% |
Occupancy by Household Size in Loma Rica
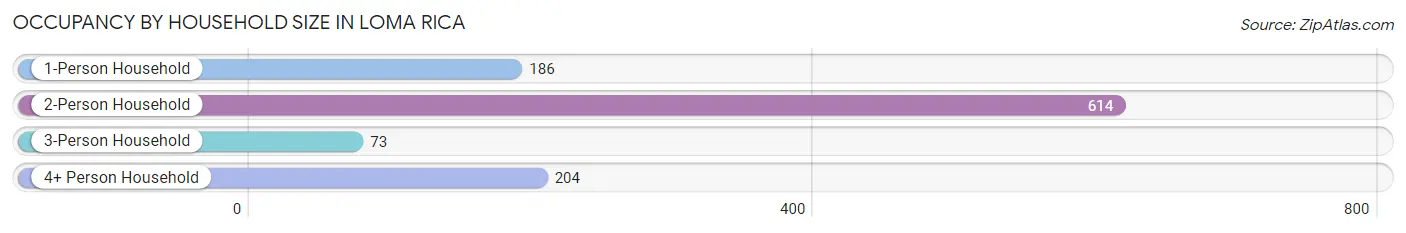
| Household Size | # Housing Units | % Housing Units |
| 1-Person Household | 186 | 17.3% |
| 2-Person Household | 614 | 57.0% |
| 3-Person Household | 73 | 6.8% |
| 4+ Person Household | 204 | 18.9% |
| Total Housing Units | 1,077 | 100.0% |
Occupancy by Ownership by Household Size in Loma Rica
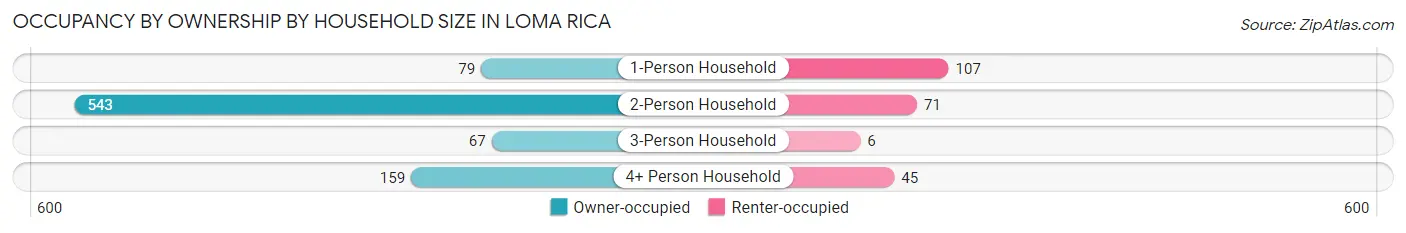
| Household Size | Owner-occupied | Renter-occupied |
| 1-Person Household | 79 (42.5%) | 107 (57.5%) |
| 2-Person Household | 543 (88.4%) | 71 (11.6%) |
| 3-Person Household | 67 (91.8%) | 6 (8.2%) |
| 4+ Person Household | 159 (77.9%) | 45 (22.1%) |
| Total Housing Units | 848 (78.7%) | 229 (21.3%) |
Occupancy by Educational Attainment in Loma Rica
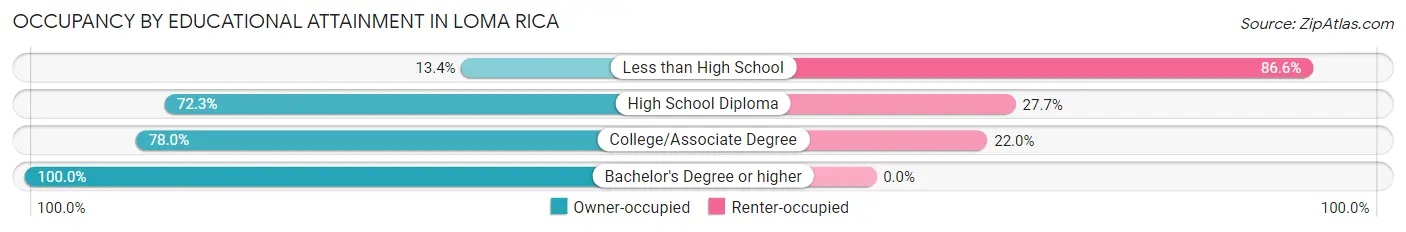
| Household Size | Owner-occupied | Renter-occupied |
| Less than High School | 15 (13.4%) | 97 (86.6%) |
| High School Diploma | 136 (72.3%) | 52 (27.7%) |
| College/Associate Degree | 283 (78.0%) | 80 (22.0%) |
| Bachelor's Degree or higher | 414 (100.0%) | 0 (0.0%) |
Occupancy by Age of Householder in Loma Rica
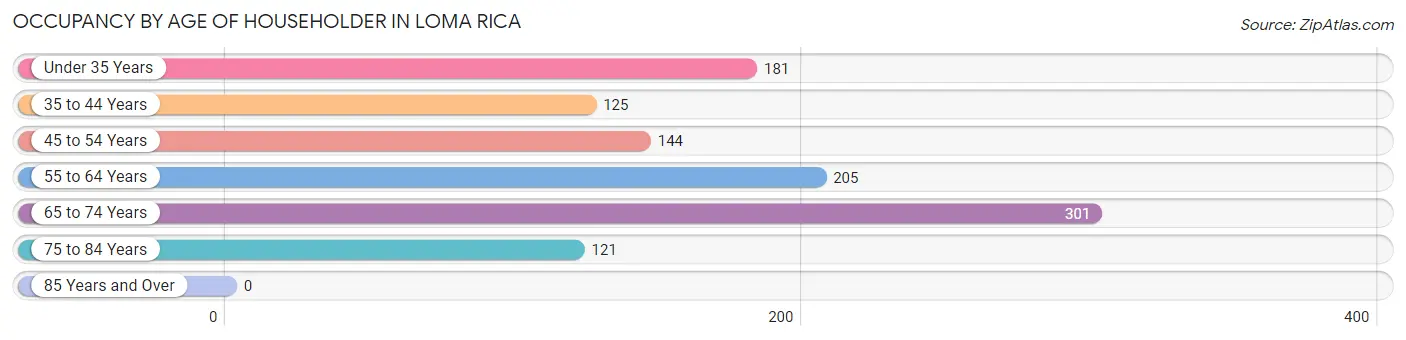
| Age Bracket | # Households | % Households |
| Under 35 Years | 181 | 16.8% |
| 35 to 44 Years | 125 | 11.6% |
| 45 to 54 Years | 144 | 13.4% |
| 55 to 64 Years | 205 | 19.0% |
| 65 to 74 Years | 301 | 28.0% |
| 75 to 84 Years | 121 | 11.2% |
| 85 Years and Over | 0 | 0.0% |
| Total | 1,077 | 100.0% |
Housing Finances in Loma Rica
Median Income by Occupancy in Loma Rica
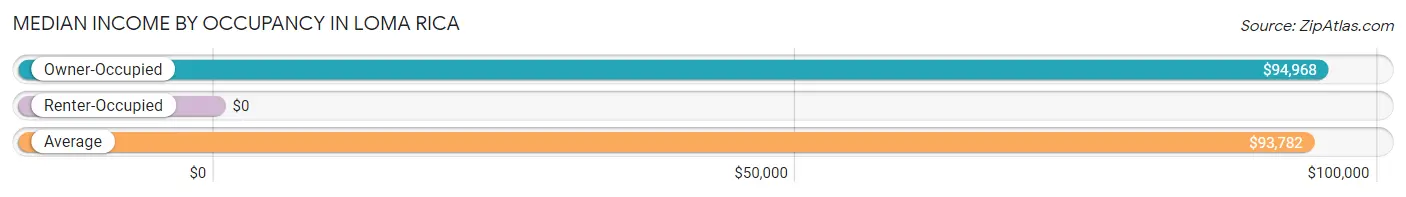
| Occupancy Type | # Households | Median Income |
| Owner-Occupied | 848 (78.7%) | $94,968 |
| Renter-Occupied | 229 (21.3%) | $0 |
| Average | 1,077 (100.0%) | $93,782 |
Occupancy by Householder Income Bracket in Loma Rica
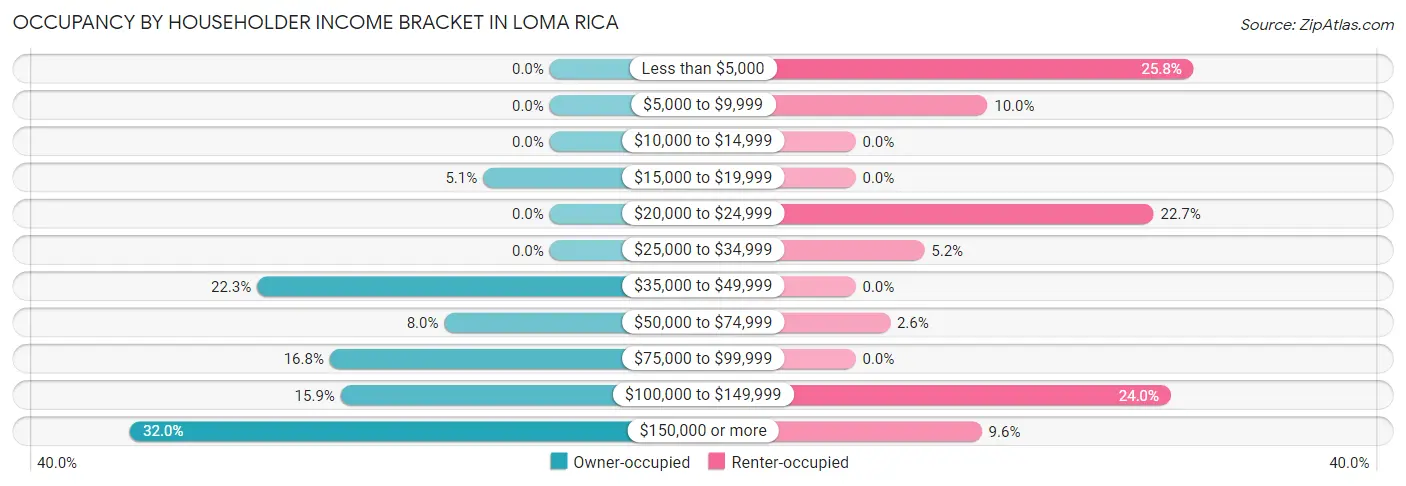
| Income Bracket | Owner-occupied | Renter-occupied |
| Less than $5,000 | 0 (0.0%) | 59 (25.8%) |
| $5,000 to $9,999 | 0 (0.0%) | 23 (10.0%) |
| $10,000 to $14,999 | 0 (0.0%) | 0 (0.0%) |
| $15,000 to $19,999 | 43 (5.1%) | 0 (0.0%) |
| $20,000 to $24,999 | 0 (0.0%) | 52 (22.7%) |
| $25,000 to $34,999 | 0 (0.0%) | 12 (5.2%) |
| $35,000 to $49,999 | 189 (22.3%) | 0 (0.0%) |
| $50,000 to $74,999 | 68 (8.0%) | 6 (2.6%) |
| $75,000 to $99,999 | 142 (16.8%) | 0 (0.0%) |
| $100,000 to $149,999 | 135 (15.9%) | 55 (24.0%) |
| $150,000 or more | 271 (32.0%) | 22 (9.6%) |
| Total | 848 (100.0%) | 229 (100.0%) |
Monthly Housing Cost Tiers in Loma Rica
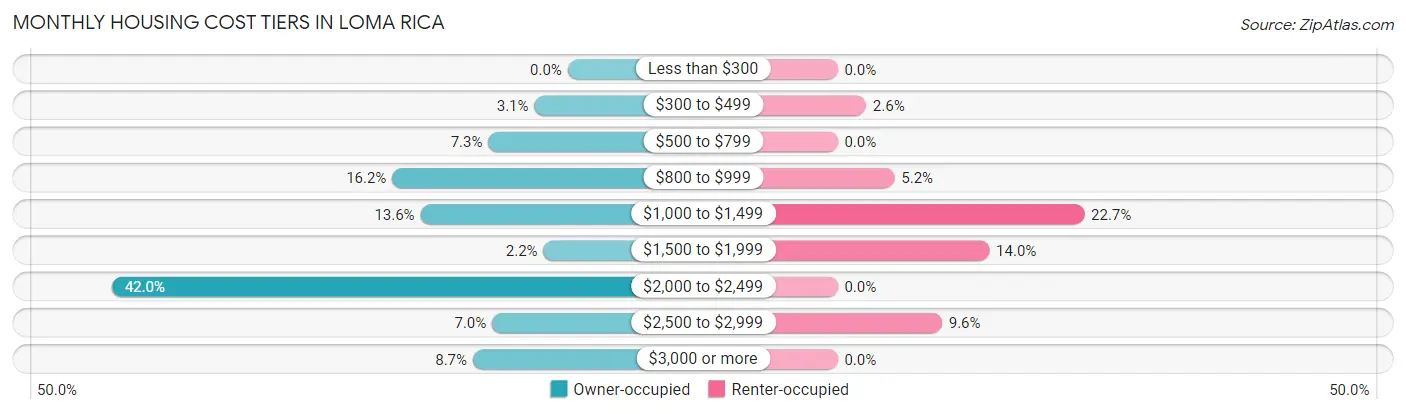
| Monthly Cost | Owner-occupied | Renter-occupied |
| Less than $300 | 0 (0.0%) | 0 (0.0%) |
| $300 to $499 | 26 (3.1%) | 6 (2.6%) |
| $500 to $799 | 62 (7.3%) | 0 (0.0%) |
| $800 to $999 | 137 (16.2%) | 12 (5.2%) |
| $1,000 to $1,499 | 115 (13.6%) | 52 (22.7%) |
| $1,500 to $1,999 | 19 (2.2%) | 32 (14.0%) |
| $2,000 to $2,499 | 356 (42.0%) | 0 (0.0%) |
| $2,500 to $2,999 | 59 (7.0%) | 22 (9.6%) |
| $3,000 or more | 74 (8.7%) | 0 (0.0%) |
| Total | 848 (100.0%) | 229 (100.0%) |
Physical Housing Characteristics in Loma Rica
Housing Structures in Loma Rica
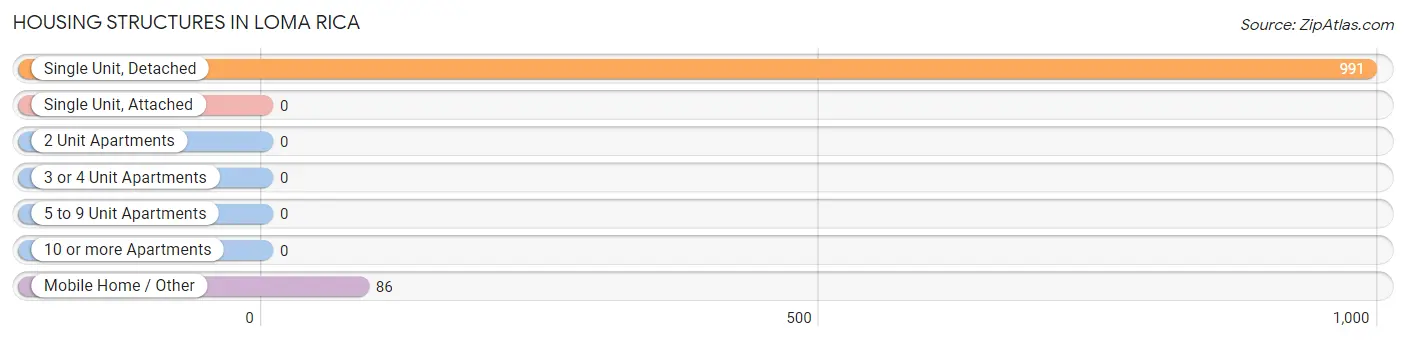
| Structure Type | # Housing Units | % Housing Units |
| Single Unit, Detached | 991 | 92.0% |
| Single Unit, Attached | 0 | 0.0% |
| 2 Unit Apartments | 0 | 0.0% |
| 3 or 4 Unit Apartments | 0 | 0.0% |
| 5 to 9 Unit Apartments | 0 | 0.0% |
| 10 or more Apartments | 0 | 0.0% |
| Mobile Home / Other | 86 | 8.0% |
| Total | 1,077 | 100.0% |
Housing Structures by Occupancy in Loma Rica
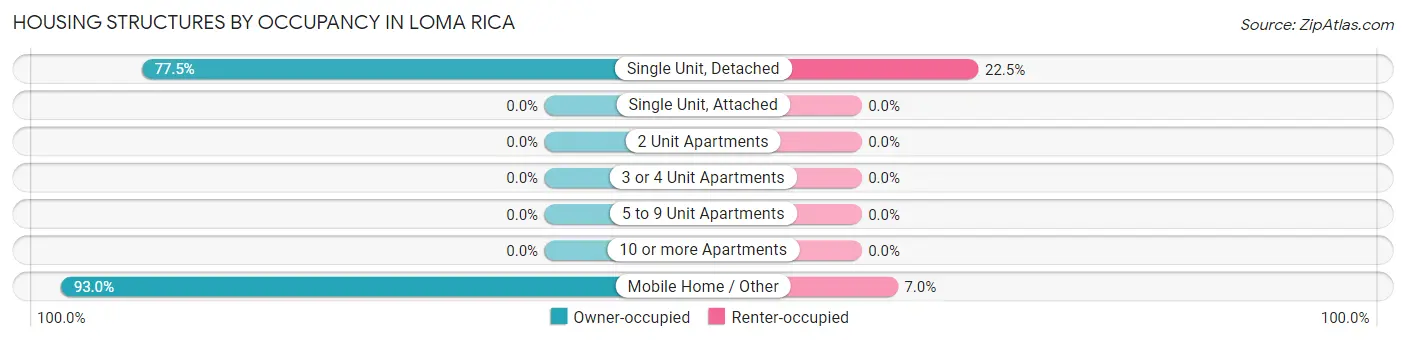
| Structure Type | Owner-occupied | Renter-occupied |
| Single Unit, Detached | 768 (77.5%) | 223 (22.5%) |
| Single Unit, Attached | 0 (0.0%) | 0 (0.0%) |
| 2 Unit Apartments | 0 (0.0%) | 0 (0.0%) |
| 3 or 4 Unit Apartments | 0 (0.0%) | 0 (0.0%) |
| 5 to 9 Unit Apartments | 0 (0.0%) | 0 (0.0%) |
| 10 or more Apartments | 0 (0.0%) | 0 (0.0%) |
| Mobile Home / Other | 80 (93.0%) | 6 (7.0%) |
| Total | 848 (78.7%) | 229 (21.3%) |
Housing Structures by Number of Rooms in Loma Rica
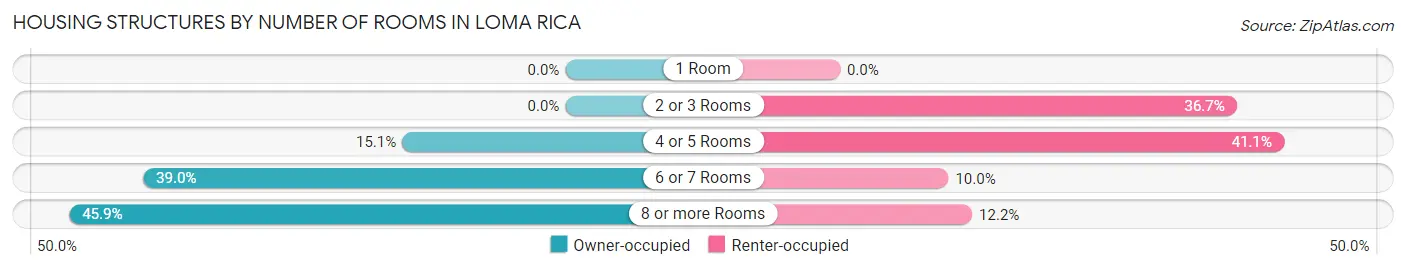
| Number of Rooms | Owner-occupied | Renter-occupied |
| 1 Room | 0 (0.0%) | 0 (0.0%) |
| 2 or 3 Rooms | 0 (0.0%) | 84 (36.7%) |
| 4 or 5 Rooms | 128 (15.1%) | 94 (41.0%) |
| 6 or 7 Rooms | 331 (39.0%) | 23 (10.0%) |
| 8 or more Rooms | 389 (45.9%) | 28 (12.2%) |
| Total | 848 (100.0%) | 229 (100.0%) |
Housing Structure by Heating Type in Loma Rica
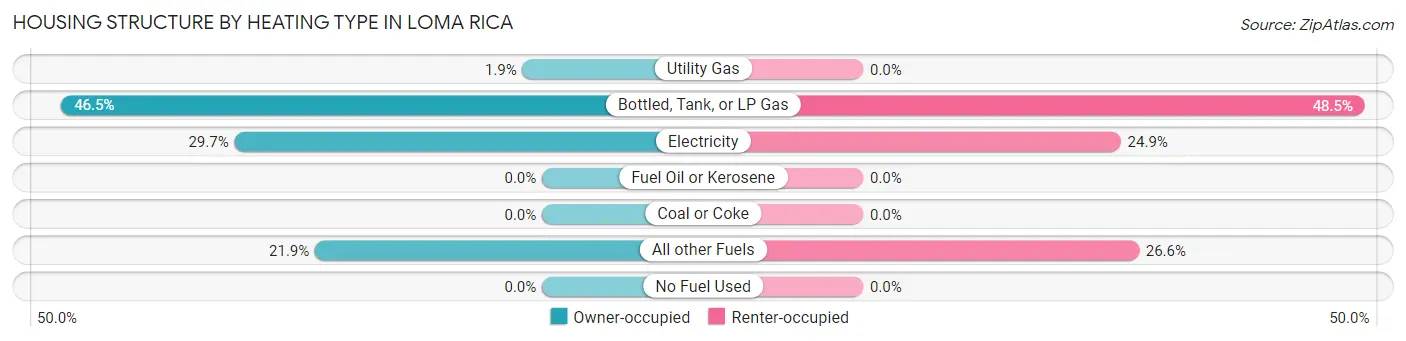
| Heating Type | Owner-occupied | Renter-occupied |
| Utility Gas | 16 (1.9%) | 0 (0.0%) |
| Bottled, Tank, or LP Gas | 394 (46.5%) | 111 (48.5%) |
| Electricity | 252 (29.7%) | 57 (24.9%) |
| Fuel Oil or Kerosene | 0 (0.0%) | 0 (0.0%) |
| Coal or Coke | 0 (0.0%) | 0 (0.0%) |
| All other Fuels | 186 (21.9%) | 61 (26.6%) |
| No Fuel Used | 0 (0.0%) | 0 (0.0%) |
| Total | 848 (100.0%) | 229 (100.0%) |
Household Vehicle Usage in Loma Rica
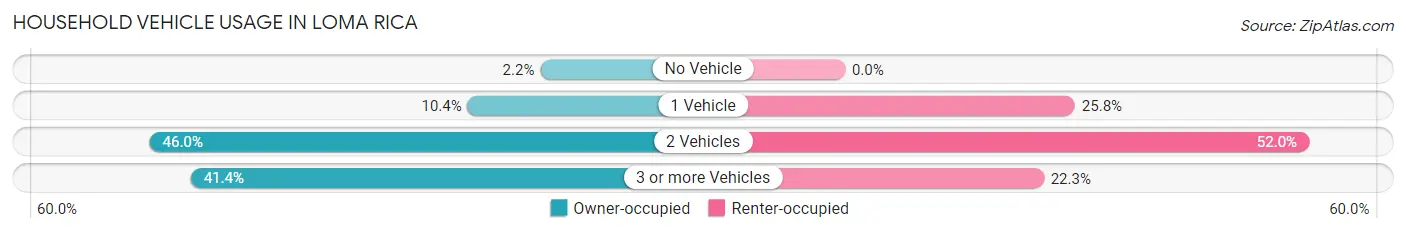
| Vehicles per Household | Owner-occupied | Renter-occupied |
| No Vehicle | 19 (2.2%) | 0 (0.0%) |
| 1 Vehicle | 88 (10.4%) | 59 (25.8%) |
| 2 Vehicles | 390 (46.0%) | 119 (52.0%) |
| 3 or more Vehicles | 351 (41.4%) | 51 (22.3%) |
| Total | 848 (100.0%) | 229 (100.0%) |
Real Estate & Mortgages in Loma Rica
Real Estate and Mortgage Overview in Loma Rica
| Characteristic | Without Mortgage | With Mortgage |
| Housing Units | 249 | 599 |
| Median Property Value | $460,300 | $451,200 |
| Median Household Income | $115,885 | $162 |
| Monthly Housing Costs | $837 | $74 |
| Real Estate Taxes | $3,300 | $0 |
Property Value by Mortgage Status in Loma Rica
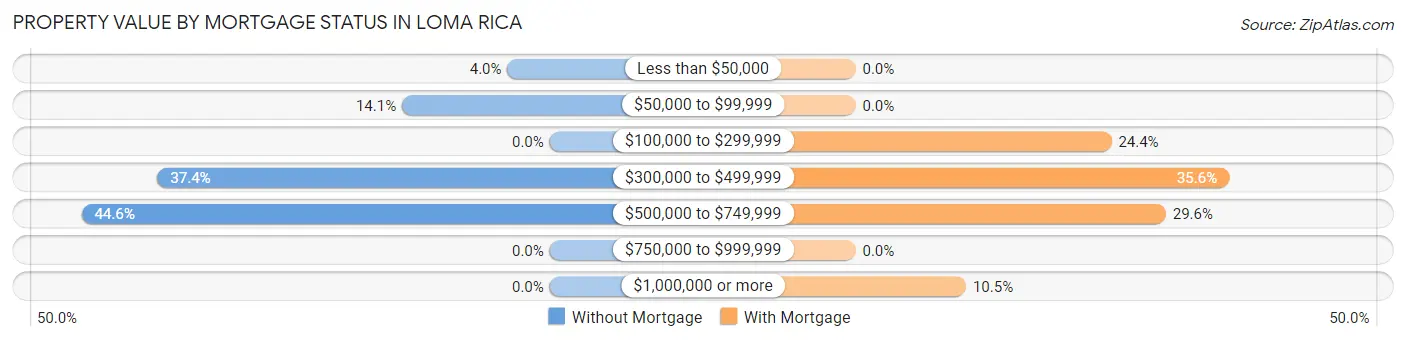
| Property Value | Without Mortgage | With Mortgage |
| Less than $50,000 | 10 (4.0%) | 0 (0.0%) |
| $50,000 to $99,999 | 35 (14.1%) | 0 (0.0%) |
| $100,000 to $299,999 | 0 (0.0%) | 146 (24.4%) |
| $300,000 to $499,999 | 93 (37.3%) | 213 (35.6%) |
| $500,000 to $749,999 | 111 (44.6%) | 177 (29.5%) |
| $750,000 to $999,999 | 0 (0.0%) | 0 (0.0%) |
| $1,000,000 or more | 0 (0.0%) | 63 (10.5%) |
| Total | 249 (100.0%) | 599 (100.0%) |
Household Income by Mortgage Status in Loma Rica
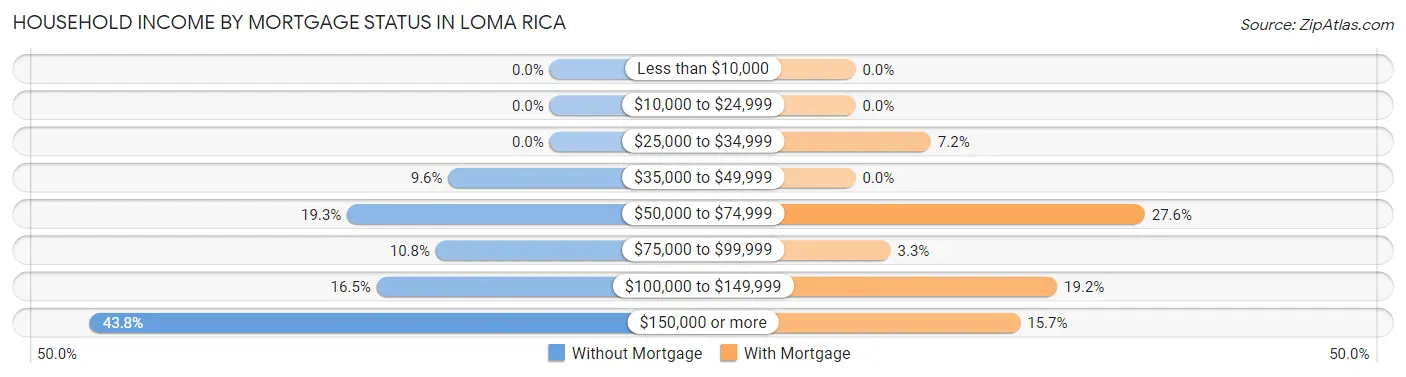
| Household Income | Without Mortgage | With Mortgage |
| Less than $10,000 | 0 (0.0%) | 0 (0.0%) |
| $10,000 to $24,999 | 0 (0.0%) | 0 (0.0%) |
| $25,000 to $34,999 | 0 (0.0%) | 43 (7.2%) |
| $35,000 to $49,999 | 24 (9.6%) | 0 (0.0%) |
| $50,000 to $74,999 | 48 (19.3%) | 165 (27.6%) |
| $75,000 to $99,999 | 27 (10.8%) | 20 (3.3%) |
| $100,000 to $149,999 | 41 (16.5%) | 115 (19.2%) |
| $150,000 or more | 109 (43.8%) | 94 (15.7%) |
| Total | 249 (100.0%) | 599 (100.0%) |
Property Value to Household Income Ratio in Loma Rica
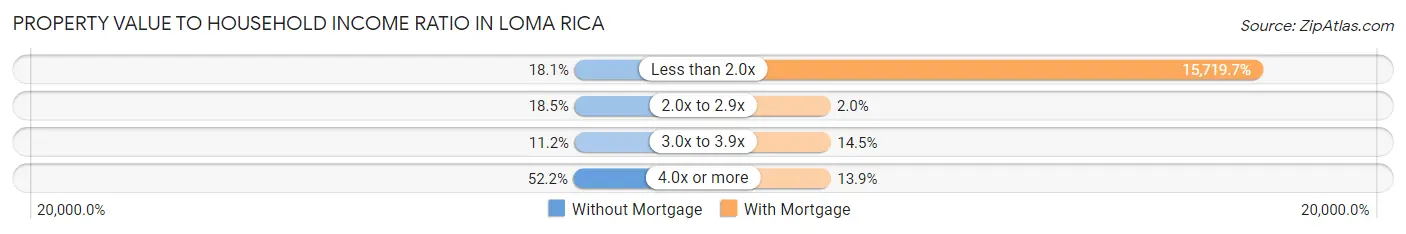
| Value-to-Income Ratio | Without Mortgage | With Mortgage |
| Less than 2.0x | 45 (18.1%) | 94,161 (15,719.7%) |
| 2.0x to 2.9x | 46 (18.5%) | 12 (2.0%) |
| 3.0x to 3.9x | 28 (11.2%) | 87 (14.5%) |
| 4.0x or more | 130 (52.2%) | 83 (13.9%) |
| Total | 249 (100.0%) | 599 (100.0%) |
Real Estate Taxes by Mortgage Status in Loma Rica
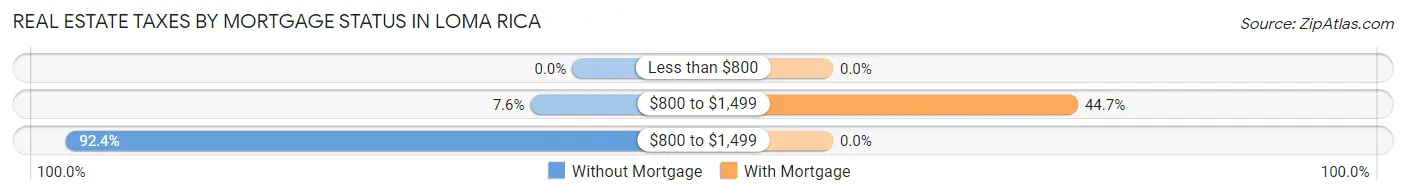
| Property Taxes | Without Mortgage | With Mortgage |
| Less than $800 | 0 (0.0%) | 0 (0.0%) |
| $800 to $1,499 | 19 (7.6%) | 268 (44.7%) |
| $800 to $1,499 | 230 (92.4%) | 0 (0.0%) |
| Total | 249 (100.0%) | 599 (100.0%) |
Health & Disability in Loma Rica
Health Insurance Coverage by Age in Loma Rica
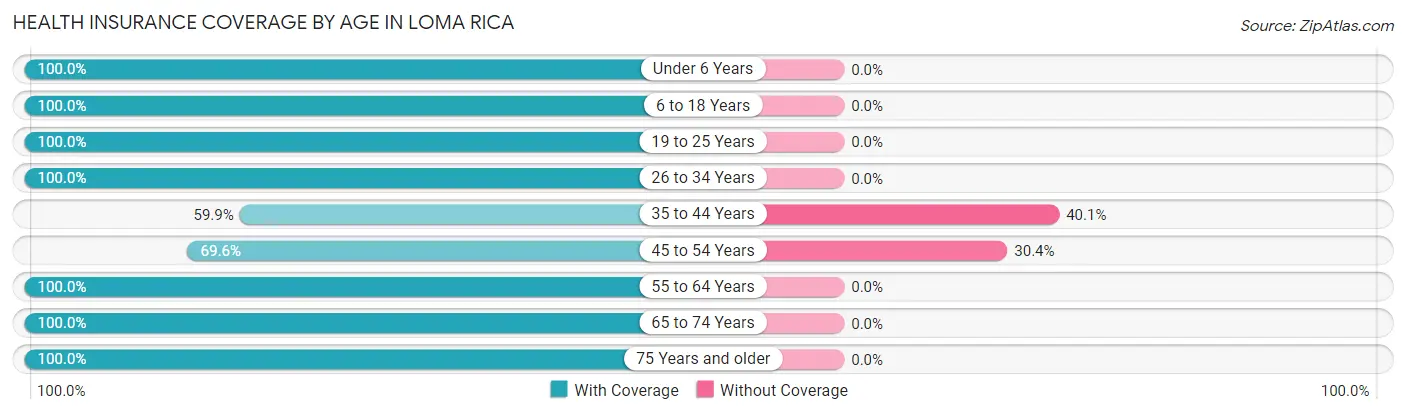
| Age Bracket | With Coverage | Without Coverage |
| Under 6 Years | 164 (100.0%) | 0 (0.0%) |
| 6 to 18 Years | 282 (100.0%) | 0 (0.0%) |
| 19 to 25 Years | 291 (100.0%) | 0 (0.0%) |
| 26 to 34 Years | 167 (100.0%) | 0 (0.0%) |
| 35 to 44 Years | 157 (59.9%) | 105 (40.1%) |
| 45 to 54 Years | 135 (69.6%) | 59 (30.4%) |
| 55 to 64 Years | 520 (100.0%) | 0 (0.0%) |
| 65 to 74 Years | 532 (100.0%) | 0 (0.0%) |
| 75 Years and older | 193 (100.0%) | 0 (0.0%) |
| Total | 2,441 (93.7%) | 164 (6.3%) |
Health Insurance Coverage by Citizenship Status in Loma Rica
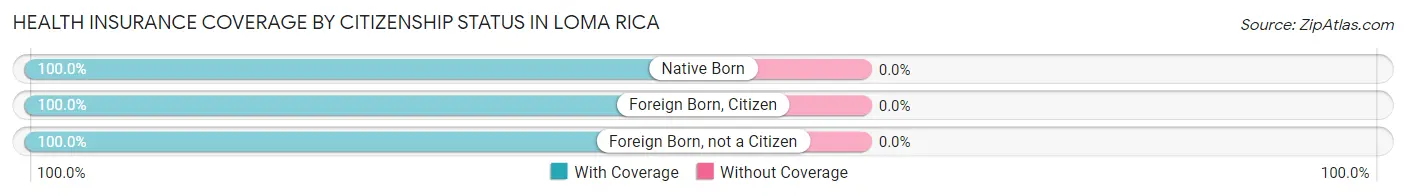
| Citizenship Status | With Coverage | Without Coverage |
| Native Born | 164 (100.0%) | 0 (0.0%) |
| Foreign Born, Citizen | 282 (100.0%) | 0 (0.0%) |
| Foreign Born, not a Citizen | 291 (100.0%) | 0 (0.0%) |
Health Insurance Coverage by Household Income in Loma Rica
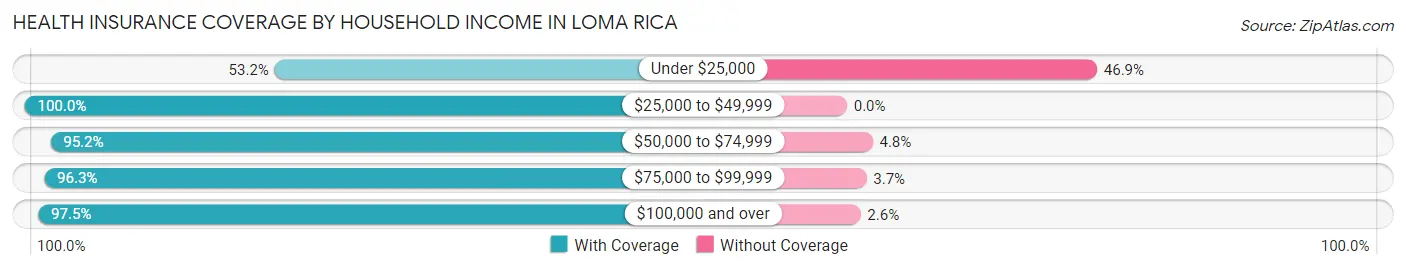
| Household Income | With Coverage | Without Coverage |
| Under $25,000 | 118 (53.1%) | 104 (46.9%) |
| $25,000 to $49,999 | 432 (100.0%) | 0 (0.0%) |
| $50,000 to $74,999 | 217 (95.2%) | 11 (4.8%) |
| $75,000 to $99,999 | 446 (96.3%) | 17 (3.7%) |
| $100,000 and over | 1,223 (97.5%) | 32 (2.5%) |
Public vs Private Health Insurance Coverage by Age in Loma Rica
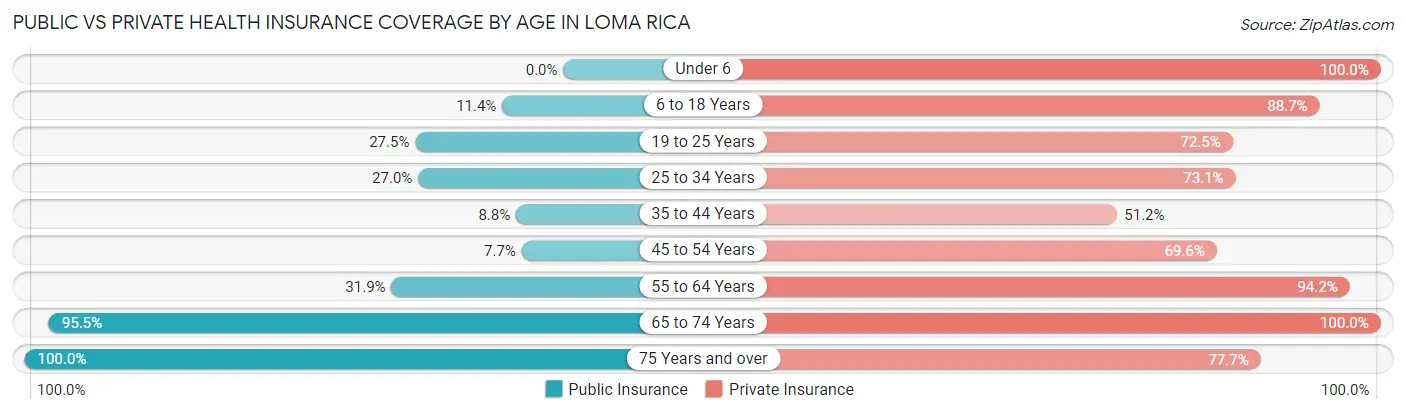
| Age Bracket | Public Insurance | Private Insurance |
| Under 6 | 0 (0.0%) | 164 (100.0%) |
| 6 to 18 Years | 32 (11.4%) | 250 (88.6%) |
| 19 to 25 Years | 80 (27.5%) | 211 (72.5%) |
| 25 to 34 Years | 45 (27.0%) | 122 (73.1%) |
| 35 to 44 Years | 23 (8.8%) | 134 (51.1%) |
| 45 to 54 Years | 15 (7.7%) | 135 (69.6%) |
| 55 to 64 Years | 166 (31.9%) | 490 (94.2%) |
| 65 to 74 Years | 508 (95.5%) | 532 (100.0%) |
| 75 Years and over | 193 (100.0%) | 150 (77.7%) |
| Total | 1,062 (40.8%) | 2,188 (84.0%) |
Disability Status by Sex by Age in Loma Rica
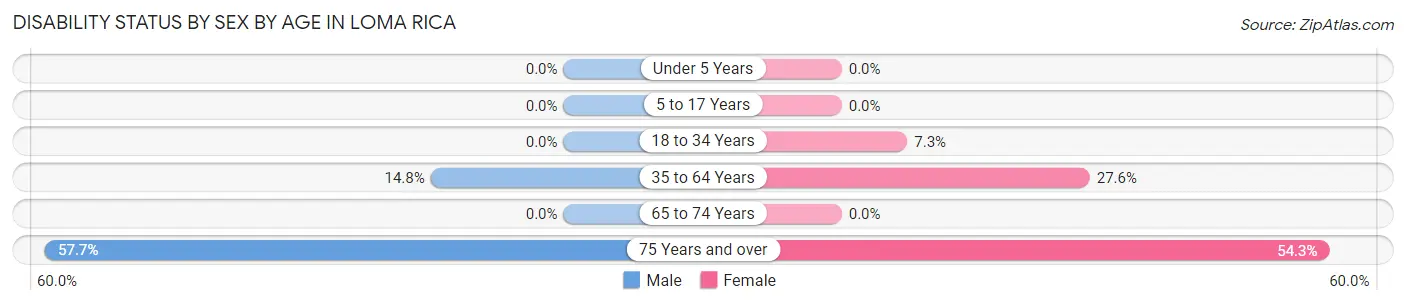
| Age Bracket | Male | Female |
| Under 5 Years | 0 (0.0%) | 0 (0.0%) |
| 5 to 17 Years | 0 (0.0%) | 0 (0.0%) |
| 18 to 34 Years | 0 (0.0%) | 20 (7.3%) |
| 35 to 64 Years | 71 (14.8%) | 137 (27.6%) |
| 65 to 74 Years | 0 (0.0%) | 0 (0.0%) |
| 75 Years and over | 71 (57.7%) | 38 (54.3%) |
Disability Class by Sex by Age in Loma Rica
Disability Class: Hearing Difficulty
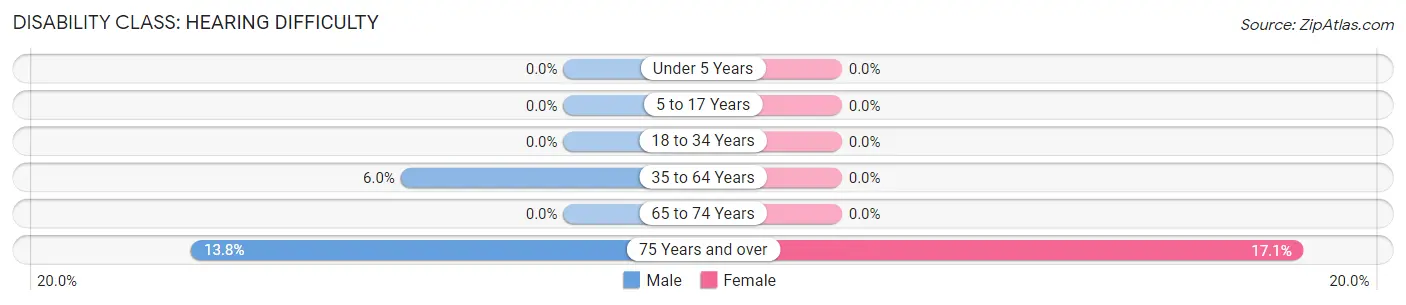
| Age Bracket | Male | Female |
| Under 5 Years | 0 (0.0%) | 0 (0.0%) |
| 5 to 17 Years | 0 (0.0%) | 0 (0.0%) |
| 18 to 34 Years | 0 (0.0%) | 0 (0.0%) |
| 35 to 64 Years | 29 (6.0%) | 0 (0.0%) |
| 65 to 74 Years | 0 (0.0%) | 0 (0.0%) |
| 75 Years and over | 17 (13.8%) | 12 (17.1%) |
Disability Class: Vision Difficulty
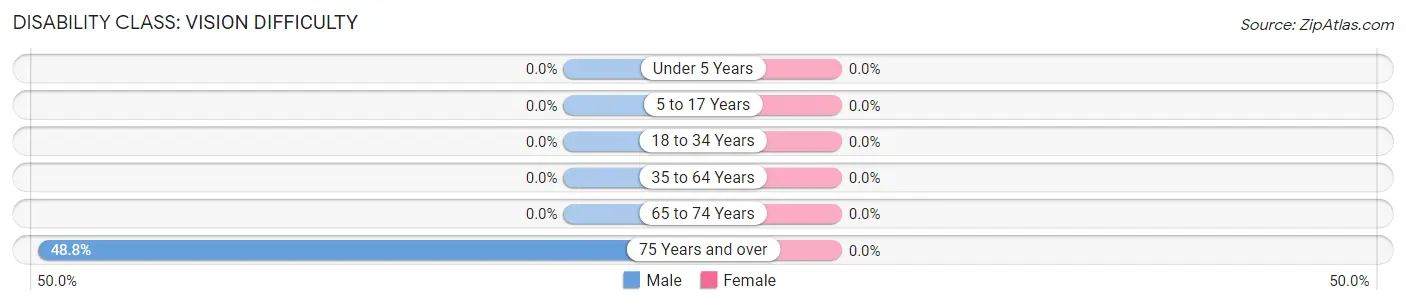
| Age Bracket | Male | Female |
| Under 5 Years | 0 (0.0%) | 0 (0.0%) |
| 5 to 17 Years | 0 (0.0%) | 0 (0.0%) |
| 18 to 34 Years | 0 (0.0%) | 0 (0.0%) |
| 35 to 64 Years | 0 (0.0%) | 0 (0.0%) |
| 65 to 74 Years | 0 (0.0%) | 0 (0.0%) |
| 75 Years and over | 60 (48.8%) | 0 (0.0%) |
Disability Class: Cognitive Difficulty
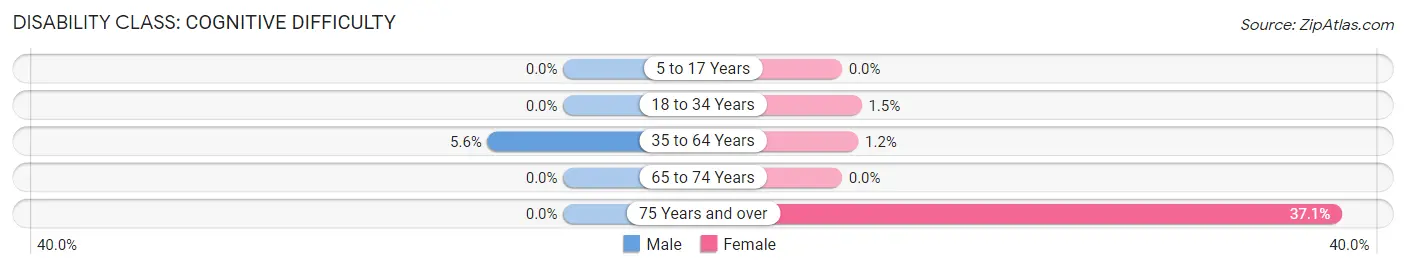
| Age Bracket | Male | Female |
| 5 to 17 Years | 0 (0.0%) | 0 (0.0%) |
| 18 to 34 Years | 0 (0.0%) | 4 (1.5%) |
| 35 to 64 Years | 27 (5.6%) | 6 (1.2%) |
| 65 to 74 Years | 0 (0.0%) | 0 (0.0%) |
| 75 Years and over | 0 (0.0%) | 26 (37.1%) |
Disability Class: Ambulatory Difficulty
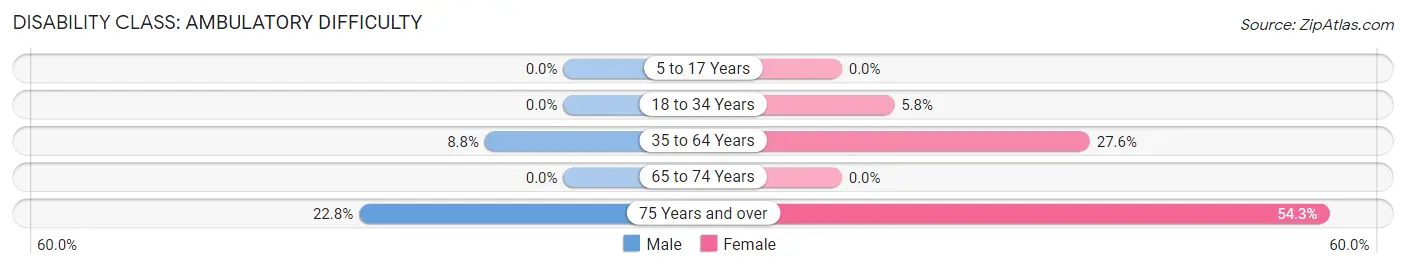
| Age Bracket | Male | Female |
| 5 to 17 Years | 0 (0.0%) | 0 (0.0%) |
| 18 to 34 Years | 0 (0.0%) | 16 (5.8%) |
| 35 to 64 Years | 42 (8.7%) | 137 (27.6%) |
| 65 to 74 Years | 0 (0.0%) | 0 (0.0%) |
| 75 Years and over | 28 (22.8%) | 38 (54.3%) |
Disability Class: Self-Care Difficulty
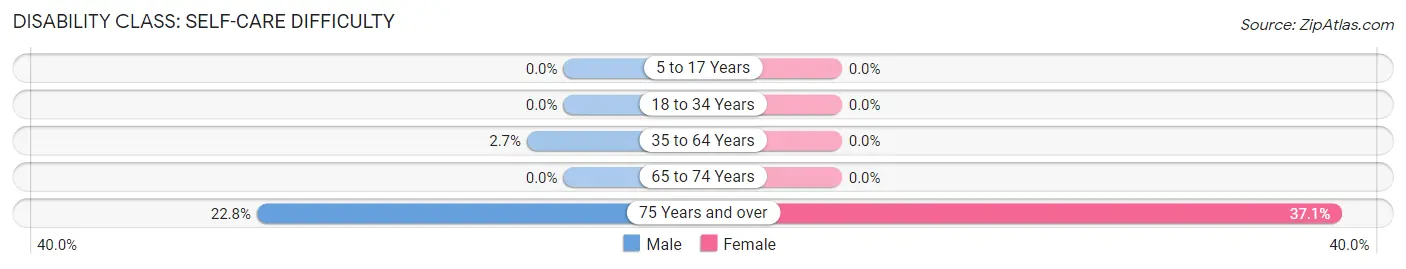
| Age Bracket | Male | Female |
| 5 to 17 Years | 0 (0.0%) | 0 (0.0%) |
| 18 to 34 Years | 0 (0.0%) | 0 (0.0%) |
| 35 to 64 Years | 13 (2.7%) | 0 (0.0%) |
| 65 to 74 Years | 0 (0.0%) | 0 (0.0%) |
| 75 Years and over | 28 (22.8%) | 26 (37.1%) |
Technology Access in Loma Rica
Computing Device Access in Loma Rica
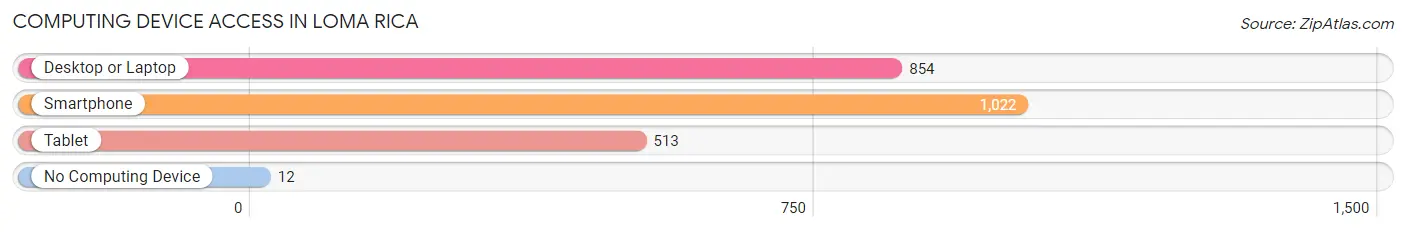
| Device Type | # Households | % Households |
| Desktop or Laptop | 854 | 79.3% |
| Smartphone | 1,022 | 94.9% |
| Tablet | 513 | 47.6% |
| No Computing Device | 12 | 1.1% |
| Total | 1,077 | 100.0% |
Internet Access in Loma Rica
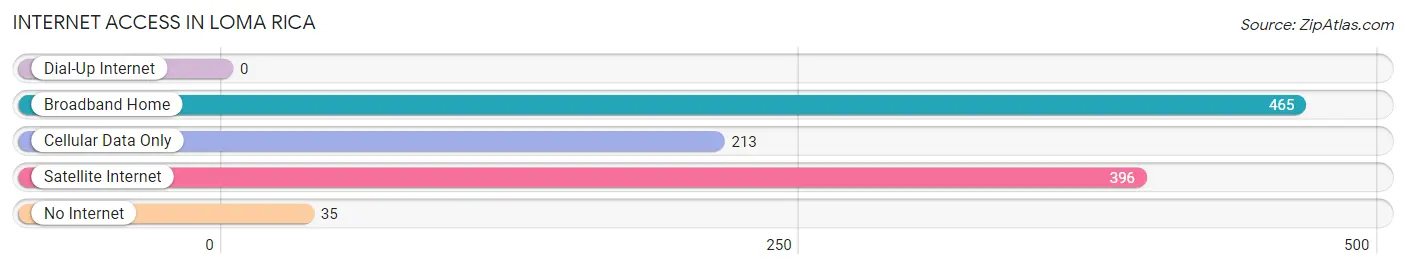
| Internet Type | # Households | % Households |
| Dial-Up Internet | 0 | 0.0% |
| Broadband Home | 465 | 43.2% |
| Cellular Data Only | 213 | 19.8% |
| Satellite Internet | 396 | 36.8% |
| No Internet | 35 | 3.3% |
| Total | 1,077 | 100.0% |
Loma Rica Summary
Loma Rica is a small unincorporated community located in Yuba County, California. It is situated in the Sierra Nevada foothills, approximately 10 miles northeast of Marysville and about 40 miles north of Sacramento. The population of Loma Rica was estimated to be 1,845 in 2019.
History
Loma Rica was originally inhabited by the Maidu Native American tribe. The first non-native settlers arrived in the area in the 1850s, and the town was officially founded in 1856. The name “Loma Rica” is derived from the Spanish phrase “loma rica” which translates to “rich hill”.
The town was initially a farming community, and the main crops grown were wheat, barley, and oats. In the late 1800s, the town began to grow as a result of the gold rush. Many miners settled in the area and began to mine for gold. The town also became a popular stop for stagecoaches traveling between Marysville and Grass Valley.
In the early 1900s, the town began to decline as the gold rush ended and the population decreased. However, in the 1950s, the town experienced a resurgence as the population began to grow again. This was due to the construction of the Beale Air Force Base, which brought many new residents to the area.
Geography
Loma Rica is located in the Sierra Nevada foothills, approximately 10 miles northeast of Marysville and about 40 miles north of Sacramento. The town is situated at an elevation of 1,067 feet above sea level.
The town is surrounded by rolling hills and is located in a valley. The climate in Loma Rica is mild and temperate, with hot summers and cool winters. The average annual temperature is around 60 degrees Fahrenheit.
Economy
The economy of Loma Rica is largely based on agriculture. The main crops grown in the area are wheat, barley, oats, and hay. The town is also home to several small businesses, including a grocery store, a hardware store, and a few restaurants.
The Beale Air Force Base is located nearby and provides employment opportunities for many of the town’s residents. The base is home to the 9th Reconnaissance Wing, which is responsible for providing intelligence, surveillance, and reconnaissance support to the United States Air Force.
Demographics
As of 2019, the population of Loma Rica was estimated to be 1,845. The racial makeup of the town is predominantly white (90.2%), followed by Hispanic or Latino (4.7%), Asian (2.2%), and African American (1.2%).
The median household income in Loma Rica is $50,945, which is slightly higher than the national average. The median age of the town’s residents is 44.3 years, which is slightly lower than the national average.
Conclusion
Loma Rica is a small unincorporated community located in Yuba County, California. It is situated in the Sierra Nevada foothills, approximately 10 miles northeast of Marysville and about 40 miles north of Sacramento. The population of Loma Rica was estimated to be 1,845 in 2019. The town is largely agricultural, with the main crops being wheat, barley, oats, and hay. The Beale Air Force Base is located nearby and provides employment opportunities for many of the town’s residents. The racial makeup of the town is predominantly white, followed by Hispanic or Latino, Asian, and African American. The median household income in Loma Rica is $50,945, which is slightly higher than the national average.
Common Questions
What is Per Capita Income in Loma Rica?
Per Capita income in Loma Rica is $40,774.
What is the Median Family Income in Loma Rica?
Median Family Income in Loma Rica is $98,971.
What is the Median Household income in Loma Rica?
Median Household Income in Loma Rica is $93,782.
What is Income or Wage Gap in Loma Rica?
Income or Wage Gap in Loma Rica is 68.2%.
Women in Loma Rica earn 31.8 cents for every dollar earned by a man.
What is Inequality or Gini Index in Loma Rica?
Inequality or Gini Index in Loma Rica is 0.40.
What is the Total Population of Loma Rica?
Total Population of Loma Rica is 2,605.
What is the Total Male Population of Loma Rica?
Total Male Population of Loma Rica is 1,205.
What is the Total Female Population of Loma Rica?
Total Female Population of Loma Rica is 1,400.
What is the Ratio of Males per 100 Females in Loma Rica?
There are 86.07 Males per 100 Females in Loma Rica.
What is the Ratio of Females per 100 Males in Loma Rica?
There are 116.18 Females per 100 Males in Loma Rica.
What is the Median Population Age in Loma Rica?
Median Population Age in Loma Rica is 52.4 Years.
What is the Average Family Size in Loma Rica
Average Family Size in Loma Rica is 2.8 People.
What is the Average Household Size in Loma Rica
Average Household Size in Loma Rica is 2.4 People.
How Large is the Labor Force in Loma Rica?
There are 1,020 People in the Labor Forcein in Loma Rica.
What is the Percentage of People in the Labor Force in Loma Rica?
46.6% of People are in the Labor Force in Loma Rica.
What is the Unemployment Rate in Loma Rica?
Unemployment Rate in Loma Rica is 4.8%.