Cities with the Highest Percentage of Population Carpooling to Work in California
RELATED REPORTS & OPTIONS
Drive | Carpool
California
Compare Cities
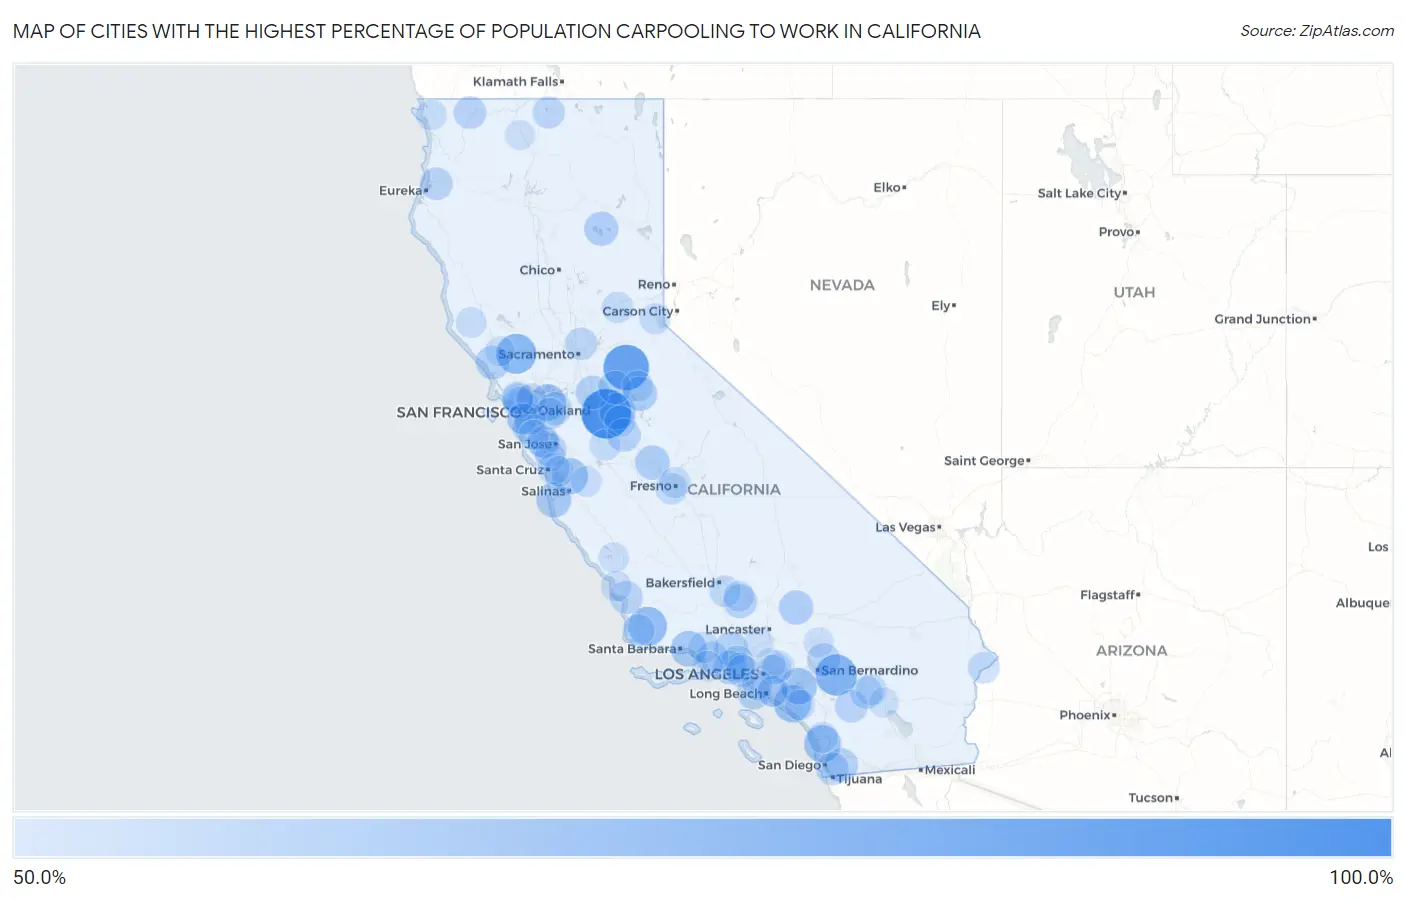
Map of Cities with the Highest Percentage of Population Carpooling to Work in California
0.0%
100.0%
Cities with the Highest Percentage of Population Carpooling to Work in California
| City | % Carpool | vs State | vs National | |
| 1. | Del Rio | 91.0% | 39.3%(+51.7)#1 | 38.2%(+52.8)#1 |
| 2. | Pine Grove | 82.5% | 39.3%(+43.2)#2 | 38.2%(+44.3)#5 |
| 3. | Oak Glen | 73.5% | 39.3%(+34.2)#3 | 38.2%(+35.3)#33 |
| 4. | Calistoga | 70.9% | 39.3%(+31.6)#4 | 38.2%(+32.7)#49 |
| 5. | Los Alamos | 68.7% | 39.3%(+29.4)#5 | 38.2%(+30.5)#79 |
| 6. | Laguna Woods | 65.5% | 39.3%(+26.2)#6 | 38.2%(+27.3)#140 |
| 7. | Rancho Santa Fe | 65.0% | 39.3%(+25.7)#7 | 38.2%(+26.8)#161 |
| 8. | Shell Ridge | 64.3% | 39.3%(+25.0)#8 | 38.2%(+26.1)#180 |
| 9. | Silverado | 63.7% | 39.3%(+24.4)#9 | 38.2%(+25.5)#209 |
| 10. | Coronita | 63.5% | 39.3%(+24.2)#10 | 38.2%(+25.3)#213 |
| 11. | East Oakdale | 63.3% | 39.3%(+24.0)#11 | 38.2%(+25.1)#223 |
| 12. | Aromas | 63.1% | 39.3%(+23.8)#12 | 38.2%(+24.9)#241 |
| 13. | Toro Canyon | 62.5% | 39.3%(+23.2)#13 | 38.2%(+24.3)#269 |
| 14. | Carmel By The Sea | 60.9% | 39.3%(+21.6)#14 | 38.2%(+22.7)#427 |
| 15. | Spring Valley Cdp Lake County | 60.7% | 39.3%(+21.4)#15 | 38.2%(+22.5)#436 |
| 16. | Trabuco Canyon | 60.5% | 39.3%(+21.2)#16 | 38.2%(+22.3)#455 |
| 17. | San Miguel Cdp Contra Costa County | 60.4% | 39.3%(+21.1)#17 | 38.2%(+22.2)#478 |
| 18. | Fairmead | 59.8% | 39.3%(+20.5)#18 | 38.2%(+21.6)#555 |
| 19. | Columbia | 59.5% | 39.3%(+20.2)#19 | 38.2%(+21.3)#579 |
| 20. | Boron | 59.4% | 39.3%(+20.1)#20 | 38.2%(+21.2)#608 |
| 21. | Madera Ranchos | 59.2% | 39.3%(+19.9)#21 | 38.2%(+21.0)#645 |
| 22. | Sage | 59.1% | 39.3%(+19.8)#22 | 38.2%(+20.9)#659 |
| 23. | Hamilton Branch | 59.1% | 39.3%(+19.8)#23 | 38.2%(+20.9)#667 |
| 24. | Stallion Springs | 58.6% | 39.3%(+19.3)#24 | 38.2%(+20.4)#703 |
| 25. | Piru | 58.5% | 39.3%(+19.2)#25 | 38.2%(+20.3)#712 |
| 26. | Monte Rio | 58.5% | 39.3%(+19.2)#26 | 38.2%(+20.3)#721 |
| 27. | Palos Verdes Estates | 58.4% | 39.3%(+19.1)#27 | 38.2%(+20.2)#732 |
| 28. | Westlake Village | 58.3% | 39.3%(+19.0)#28 | 38.2%(+20.1)#745 |
| 29. | Jamul | 58.3% | 39.3%(+19.0)#29 | 38.2%(+20.1)#747 |
| 30. | Morada | 58.3% | 39.3%(+19.0)#30 | 38.2%(+20.1)#754 |
| 31. | Bell Canyon | 58.1% | 39.3%(+18.8)#31 | 38.2%(+19.9)#806 |
| 32. | Rancho Calaveras | 57.8% | 39.3%(+18.5)#32 | 38.2%(+19.6)#837 |
| 33. | Ballico | 57.6% | 39.3%(+18.3)#33 | 38.2%(+19.4)#856 |
| 34. | Lake Arrowhead | 57.5% | 39.3%(+18.2)#34 | 38.2%(+19.3)#859 |
| 35. | Blackhawk | 57.3% | 39.3%(+18.0)#35 | 38.2%(+19.1)#891 |
| 36. | Monte Sereno | 56.9% | 39.3%(+17.6)#36 | 38.2%(+18.7)#972 |
| 37. | Pismo Beach | 56.7% | 39.3%(+17.4)#37 | 38.2%(+18.5)#998 |
| 38. | Blue Lake | 56.3% | 39.3%(+17.0)#38 | 38.2%(+18.1)#1,080 |
| 39. | Happy Camp | 56.3% | 39.3%(+17.0)#39 | 38.2%(+18.1)#1,082 |
| 40. | Bonita | 56.2% | 39.3%(+16.9)#40 | 38.2%(+18.0)#1,098 |
| 41. | Anza | 56.2% | 39.3%(+16.9)#41 | 38.2%(+18.0)#1,110 |
| 42. | Colma | 56.1% | 39.3%(+16.8)#42 | 38.2%(+17.9)#1,134 |
| 43. | Topanga | 56.0% | 39.3%(+16.7)#43 | 38.2%(+17.8)#1,151 |
| 44. | Woodville Farm Labor Camp | 56.0% | 39.3%(+16.7)#44 | 38.2%(+17.8)#1,162 |
| 45. | Hillsborough | 55.9% | 39.3%(+16.6)#45 | 38.2%(+17.7)#1,168 |
| 46. | Rancho Mirage | 55.8% | 39.3%(+16.5)#46 | 38.2%(+17.6)#1,179 |
| 47. | Elverta | 55.7% | 39.3%(+16.4)#47 | 38.2%(+17.5)#1,205 |
| 48. | Belvedere | 55.3% | 39.3%(+16.0)#48 | 38.2%(+17.1)#1,281 |
| 49. | Saticoy | 55.3% | 39.3%(+16.0)#49 | 38.2%(+17.1)#1,284 |
| 50. | Macdoel | 55.1% | 39.3%(+15.8)#50 | 38.2%(+16.9)#1,358 |
| 51. | San Anselmo | 54.9% | 39.3%(+15.6)#51 | 38.2%(+16.7)#1,374 |
| 52. | Los Altos Hills | 54.8% | 39.3%(+15.5)#52 | 38.2%(+16.6)#1,394 |
| 53. | Loyola | 54.6% | 39.3%(+15.3)#53 | 38.2%(+16.4)#1,431 |
| 54. | Big River | 54.4% | 39.3%(+15.1)#54 | 38.2%(+16.2)#1,495 |
| 55. | Norris Canyon | 54.4% | 39.3%(+15.1)#55 | 38.2%(+16.2)#1,496 |
| 56. | Mission Hills | 54.3% | 39.3%(+15.0)#56 | 38.2%(+16.1)#1,507 |
| 57. | Los Alamitos | 54.2% | 39.3%(+14.9)#57 | 38.2%(+16.0)#1,543 |
| 58. | Brisbane | 54.2% | 39.3%(+14.9)#58 | 38.2%(+16.0)#1,547 |
| 59. | Seacliff | 54.2% | 39.3%(+14.9)#59 | 38.2%(+16.0)#1,549 |
| 60. | Weedpatch | 54.1% | 39.3%(+14.8)#60 | 38.2%(+15.9)#1,572 |
| 61. | West Park | 54.0% | 39.3%(+14.7)#61 | 38.2%(+15.8)#1,602 |
| 62. | Mira Monte | 53.9% | 39.3%(+14.6)#62 | 38.2%(+15.7)#1,613 |
| 63. | Somis | 53.8% | 39.3%(+14.5)#63 | 38.2%(+15.6)#1,632 |
| 64. | Alta | 53.8% | 39.3%(+14.5)#64 | 38.2%(+15.6)#1,635 |
| 65. | Mill Valley | 53.7% | 39.3%(+14.4)#65 | 38.2%(+15.5)#1,645 |
| 66. | Murphys | 53.6% | 39.3%(+14.3)#66 | 38.2%(+15.4)#1,669 |
| 67. | Old Fig Garden | 53.5% | 39.3%(+14.2)#67 | 38.2%(+15.3)#1,686 |
| 68. | Newman | 53.4% | 39.3%(+14.1)#68 | 38.2%(+15.2)#1,726 |
| 69. | Bradbury | 53.4% | 39.3%(+14.1)#69 | 38.2%(+15.2)#1,745 |
| 70. | Tahoma | 53.2% | 39.3%(+13.9)#70 | 38.2%(+15.0)#1,804 |
| 71. | Waterford | 53.1% | 39.3%(+13.8)#71 | 38.2%(+14.9)#1,816 |
| 72. | Thousand Palms | 53.0% | 39.3%(+13.7)#72 | 38.2%(+14.8)#1,835 |
| 73. | Lake San Marcos | 53.0% | 39.3%(+13.7)#73 | 38.2%(+14.8)#1,840 |
| 74. | Ridgemark | 52.7% | 39.3%(+13.4)#74 | 38.2%(+14.5)#1,900 |
| 75. | Channel Islands Beach | 52.7% | 39.3%(+13.4)#75 | 38.2%(+14.5)#1,901 |
| 76. | Bear Valley Springs | 52.6% | 39.3%(+13.3)#76 | 38.2%(+14.4)#1,917 |
| 77. | Altadena | 52.5% | 39.3%(+13.2)#77 | 38.2%(+14.3)#1,930 |
| 78. | Lexington Hills | 52.5% | 39.3%(+13.2)#78 | 38.2%(+14.3)#1,938 |
| 79. | Ross | 52.5% | 39.3%(+13.2)#79 | 38.2%(+14.3)#1,939 |
| 80. | Boonville | 52.4% | 39.3%(+13.1)#80 | 38.2%(+14.2)#1,983 |
| 81. | Rollingwood | 52.3% | 39.3%(+13.0)#81 | 38.2%(+14.1)#1,994 |
| 82. | Los Osos | 52.2% | 39.3%(+12.9)#82 | 38.2%(+14.0)#2,032 |
| 83. | Broadmoor | 52.2% | 39.3%(+12.9)#83 | 38.2%(+14.0)#2,039 |
| 84. | Hiouchi | 52.2% | 39.3%(+12.9)#84 | 38.2%(+14.0)#2,052 |
| 85. | Mayflower Village | 51.9% | 39.3%(+12.6)#85 | 38.2%(+13.7)#2,124 |
| 86. | East San Gabriel | 51.8% | 39.3%(+12.5)#86 | 38.2%(+13.6)#2,138 |
| 87. | Lake Nacimiento | 51.8% | 39.3%(+12.5)#87 | 38.2%(+13.6)#2,145 |
| 88. | Coto De Caza | 51.7% | 39.3%(+12.4)#88 | 38.2%(+13.5)#2,164 |
| 89. | Rossmoor | 51.7% | 39.3%(+12.4)#89 | 38.2%(+13.5)#2,166 |
| 90. | Aptos Hills Larkin Valley | 51.7% | 39.3%(+12.4)#90 | 38.2%(+13.5)#2,175 |
| 91. | Alondra Park | 51.6% | 39.3%(+12.3)#91 | 38.2%(+13.4)#2,187 |
| 92. | Bayview Cdp Humboldt County | 51.6% | 39.3%(+12.3)#92 | 38.2%(+13.4)#2,196 |
| 93. | La Canada Flintridge | 51.5% | 39.3%(+12.2)#93 | 38.2%(+13.3)#2,210 |
| 94. | Thermal | 51.5% | 39.3%(+12.2)#94 | 38.2%(+13.3)#2,229 |
| 95. | Agua Dulce | 51.4% | 39.3%(+12.1)#95 | 38.2%(+13.2)#2,267 |
| 96. | Spring Valley Lake | 51.3% | 39.3%(+12.0)#96 | 38.2%(+13.1)#2,293 |
| 97. | Emerald Lake Hills | 51.3% | 39.3%(+12.0)#97 | 38.2%(+13.1)#2,299 |
| 98. | Gazelle | 51.3% | 39.3%(+12.0)#98 | 38.2%(+13.1)#2,334 |
| 99. | Calabasas | 51.2% | 39.3%(+11.9)#99 | 38.2%(+13.0)#2,335 |
| 100. | Healdsburg | 51.2% | 39.3%(+11.9)#100 | 38.2%(+13.0)#2,337 |
Common Questions
What are the Top 10 Cities with the Highest Percentage of Population Carpooling to Work in California?
Top 10 Cities with the Highest Percentage of Population Carpooling to Work in California are:
#1
91.0%
#2
82.5%
#3
73.5%
#4
70.9%
#5
68.7%
#6
65.5%
#7
65.0%
#8
64.3%
#9
63.5%
#10
63.3%
What city has the Highest Percentage of Population Carpooling to Work in California?
Del Rio has the Highest Percentage of Population Carpooling to Work in California with 91.0%.
What is the Percentage of Population Carpooling to Work in the State of California?
Percentage of Population Carpooling to Work in California is 39.3%.
What is the Percentage of Population Carpooling to Work in the United States?
Percentage of Population Carpooling to Work in the United States is 38.2%.