Cities with the Highest Percentage of Population Enrolled in High School in California
RELATED REPORTS & OPTIONS
High School
California
Compare Cities
Map of Cities with the Highest Percentage of Population Enrolled in High School in California
0.0%
50.0%
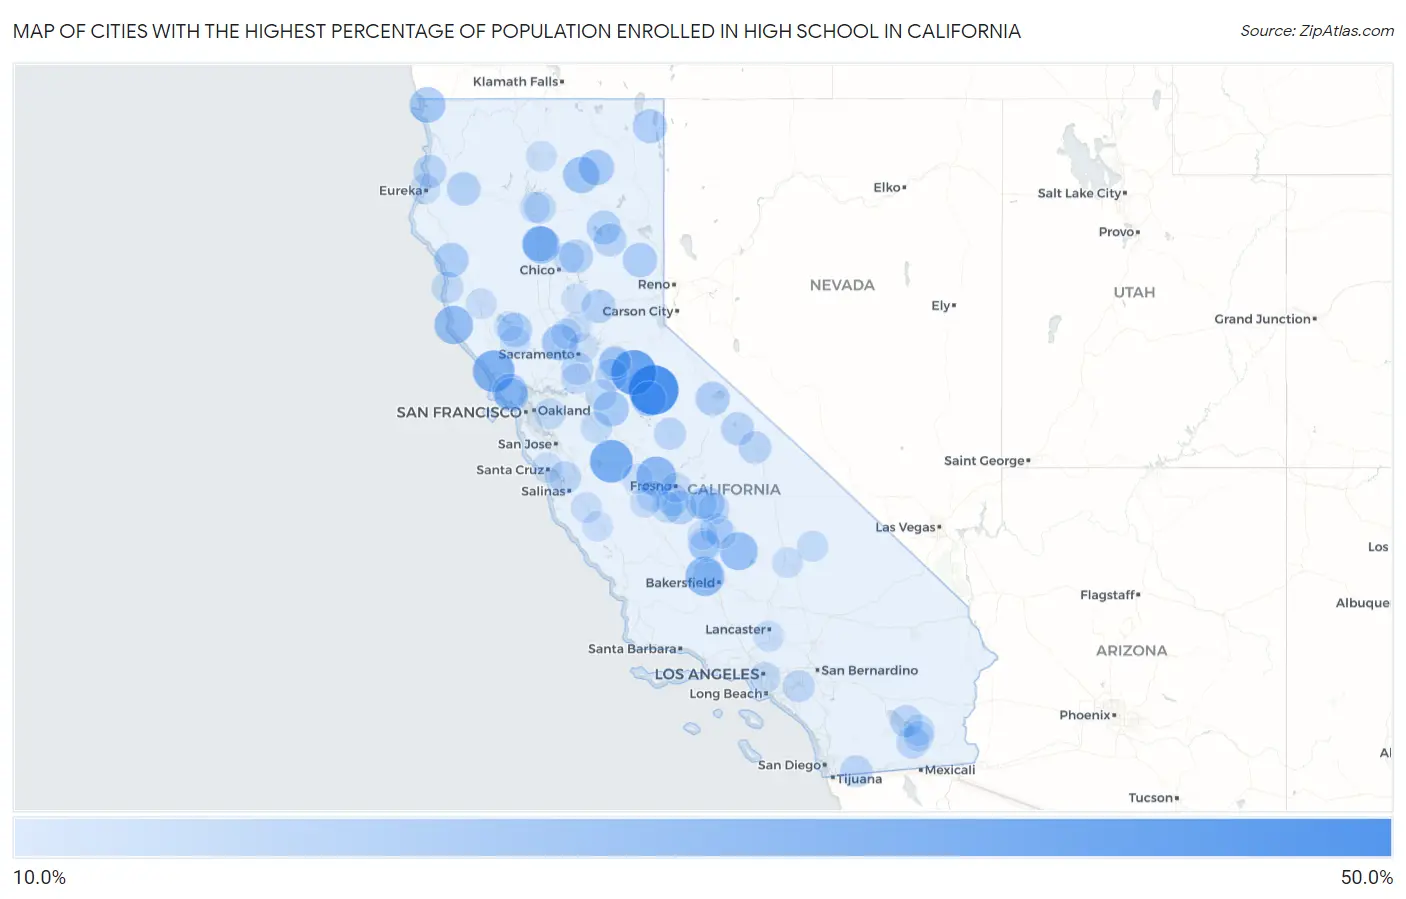
Cities with the Highest Percentage of Population Enrolled in High School in California
| City | % in High School | vs State | vs National | |
| 1. | Sierra Village | 42.2% | 5.6%(+36.6)#1 | 5.4%(+36.8)#32 |
| 2. | Rail Road Flat | 34.6% | 5.6%(+29.0)#2 | 5.4%(+29.2)#60 |
| 3. | Volta | 30.8% | 5.6%(+25.2)#3 | 5.4%(+25.4)#92 |
| 4. | Bodega | 29.2% | 5.6%(+23.6)#4 | 5.4%(+23.8)#111 |
| 5. | Old River | 26.4% | 5.6%(+20.8)#5 | 5.4%(+21.0)#143 |
| 6. | La Vina | 25.6% | 5.6%(+20.0)#6 | 5.4%(+20.2)#166 |
| 7. | Cherokee Strip | 25.0% | 5.6%(+19.4)#7 | 5.4%(+19.6)#178 |
| 8. | El Monte Mobile | 24.6% | 5.6%(+18.9)#8 | 5.4%(+19.2)#191 |
| 9. | Manchester | 24.0% | 5.6%(+18.4)#9 | 5.4%(+18.6)#202 |
| 10. | Idlewild | 22.9% | 5.6%(+17.3)#10 | 5.4%(+17.5)#231 |
| 11. | Gerber | 21.7% | 5.6%(+16.0)#11 | 5.4%(+16.3)#264 |
| 12. | Fall River Mills | 20.4% | 5.6%(+14.8)#12 | 5.4%(+15.1)#320 |
| 13. | Yolo | 20.0% | 5.6%(+14.4)#13 | 5.4%(+14.6)#341 |
| 14. | Igo | 19.5% | 5.6%(+13.9)#14 | 5.4%(+14.2)#373 |
| 15. | Smith River | 19.4% | 5.6%(+13.7)#15 | 5.4%(+14.0)#382 |
| 16. | Nubieber | 19.0% | 5.6%(+13.4)#16 | 5.4%(+13.7)#394 |
| 17. | Proberta | 19.0% | 5.6%(+13.3)#17 | 5.4%(+13.6)#399 |
| 18. | Valley Home | 18.7% | 5.6%(+13.1)#18 | 5.4%(+13.3)#414 |
| 19. | Nicasio | 18.5% | 5.6%(+12.9)#19 | 5.4%(+13.1)#422 |
| 20. | Tuolumne City | 18.4% | 5.6%(+12.7)#20 | 5.4%(+13.0)#433 |
| 21. | Pumpkin Center | 17.8% | 5.6%(+12.2)#21 | 5.4%(+12.4)#476 |
| 22. | Leggett | 17.4% | 5.6%(+11.8)#22 | 5.4%(+12.0)#521 |
| 23. | Beckwourth | 17.3% | 5.6%(+11.7)#23 | 5.4%(+11.9)#531 |
| 24. | Seville | 17.0% | 5.6%(+11.4)#24 | 5.4%(+11.6)#557 |
| 25. | Lee Vining | 17.0% | 5.6%(+11.4)#25 | 5.4%(+11.6)#562 |
| 26. | Lower Lake | 16.9% | 5.6%(+11.3)#26 | 5.4%(+11.5)#575 |
| 27. | Millerton | 16.8% | 5.6%(+11.2)#27 | 5.4%(+11.4)#585 |
| 28. | Lake City | 16.7% | 5.6%(+11.0)#28 | 5.4%(+11.3)#600 |
| 29. | San Geronimo | 16.6% | 5.6%(+11.0)#29 | 5.4%(+11.2)#605 |
| 30. | Clear Creek | 16.6% | 5.6%(+11.0)#30 | 5.4%(+11.2)#606 |
| 31. | Laton | 16.4% | 5.6%(+10.8)#31 | 5.4%(+11.0)#615 |
| 32. | El Adobe | 16.3% | 5.6%(+10.6)#32 | 5.4%(+10.9)#632 |
| 33. | Burnt Ranch | 16.2% | 5.6%(+10.6)#33 | 5.4%(+10.8)#637 |
| 34. | Di Giorgio | 16.1% | 5.6%(+10.5)#34 | 5.4%(+10.7)#648 |
| 35. | Rough And Ready | 16.1% | 5.6%(+10.4)#35 | 5.4%(+10.7)#651 |
| 36. | Stirling City | 16.0% | 5.6%(+10.3)#36 | 5.4%(+10.6)#662 |
| 37. | Oak Run | 15.9% | 5.6%(+10.3)#37 | 5.4%(+10.5)#669 |
| 38. | Edison | 15.7% | 5.6%(+10.1)#38 | 5.4%(+10.3)#695 |
| 39. | Greenville | 15.5% | 5.6%(+9.83)#39 | 5.4%(+10.1)#735 |
| 40. | Aspen Springs | 15.2% | 5.6%(+9.57)#40 | 5.4%(+9.82)#771 |
| 41. | Westhaven Moonstone | 15.0% | 5.6%(+9.39)#41 | 5.4%(+9.64)#786 |
| 42. | Drytown | 15.0% | 5.6%(+9.36)#42 | 5.4%(+9.61)#792 |
| 43. | Hypericum | 15.0% | 5.6%(+9.34)#43 | 5.4%(+9.59)#801 |
| 44. | Wilkerson | 14.6% | 5.6%(+8.94)#44 | 5.4%(+9.19)#862 |
| 45. | Caruthers | 14.4% | 5.6%(+8.78)#45 | 5.4%(+9.03)#891 |
| 46. | Modjeska | 14.3% | 5.6%(+8.65)#46 | 5.4%(+8.90)#906 |
| 47. | Spring Valley Cdp Lake County | 14.2% | 5.6%(+8.57)#47 | 5.4%(+8.82)#926 |
| 48. | Westmorland | 14.2% | 5.6%(+8.56)#48 | 5.4%(+8.81)#930 |
| 49. | Bombay Beach | 14.0% | 5.6%(+8.41)#49 | 5.4%(+8.66)#957 |
| 50. | Las Lomas | 14.0% | 5.6%(+8.35)#50 | 5.4%(+8.59)#972 |
| 51. | Hood | 13.9% | 5.6%(+8.25)#51 | 5.4%(+8.50)#988 |
| 52. | Buena Vista | 13.8% | 5.6%(+8.12)#52 | 5.4%(+8.37)#1,023 |
| 53. | Potrero | 13.8% | 5.6%(+8.12)#53 | 5.4%(+8.36)#1,026 |
| 54. | Bootjack | 13.6% | 5.6%(+8.01)#54 | 5.4%(+8.26)#1,047 |
| 55. | Cleone | 13.3% | 5.6%(+7.67)#55 | 5.4%(+7.92)#1,118 |
| 56. | Coronita | 13.3% | 5.6%(+7.66)#56 | 5.4%(+7.91)#1,123 |
| 57. | Millville | 13.3% | 5.6%(+7.65)#57 | 5.4%(+7.89)#1,127 |
| 58. | Strathmore | 13.2% | 5.6%(+7.54)#58 | 5.4%(+7.79)#1,142 |
| 59. | Woodlake | 13.1% | 5.6%(+7.47)#59 | 5.4%(+7.72)#1,155 |
| 60. | Teviston | 13.1% | 5.6%(+7.47)#60 | 5.4%(+7.71)#1,159 |
| 61. | Olde Stockdale | 13.1% | 5.6%(+7.44)#61 | 5.4%(+7.69)#1,164 |
| 62. | Niland | 12.8% | 5.6%(+7.12)#62 | 5.4%(+7.37)#1,258 |
| 63. | Monson | 12.7% | 5.6%(+7.05)#63 | 5.4%(+7.30)#1,289 |
| 64. | Grayson | 12.6% | 5.6%(+7.00)#64 | 5.4%(+7.25)#1,301 |
| 65. | Bear Valley Cdp Alpine County | 12.5% | 5.6%(+6.86)#65 | 5.4%(+7.11)#1,347 |
| 66. | Linden | 12.3% | 5.6%(+6.68)#66 | 5.4%(+6.93)#1,396 |
| 67. | Earlimart | 12.1% | 5.6%(+6.51)#67 | 5.4%(+6.76)#1,463 |
| 68. | Lanare | 12.1% | 5.6%(+6.49)#68 | 5.4%(+6.73)#1,465 |
| 69. | San Joaquin | 12.1% | 5.6%(+6.45)#69 | 5.4%(+6.70)#1,477 |
| 70. | Potomac Park | 12.1% | 5.6%(+6.43)#70 | 5.4%(+6.68)#1,488 |
| 71. | Homewood Canyon | 12.1% | 5.6%(+6.42)#71 | 5.4%(+6.67)#1,494 |
| 72. | Plymouth | 12.1% | 5.6%(+6.42)#72 | 5.4%(+6.67)#1,495 |
| 73. | Forest Ranch | 12.0% | 5.6%(+6.34)#73 | 5.4%(+6.59)#1,535 |
| 74. | Norris Canyon | 11.9% | 5.6%(+6.31)#74 | 5.4%(+6.56)#1,551 |
| 75. | Vernon | 11.9% | 5.6%(+6.28)#75 | 5.4%(+6.52)#1,563 |
| 76. | Desert View Highlands | 11.7% | 5.6%(+6.10)#76 | 5.4%(+6.35)#1,645 |
| 77. | Redwood Valley | 11.6% | 5.6%(+6.01)#77 | 5.4%(+6.26)#1,691 |
| 78. | Soledad | 11.6% | 5.6%(+5.99)#78 | 5.4%(+6.23)#1,709 |
| 79. | Walnut Grove | 11.6% | 5.6%(+5.97)#79 | 5.4%(+6.22)#1,717 |
| 80. | Mccloud | 11.6% | 5.6%(+5.94)#80 | 5.4%(+6.19)#1,735 |
| 81. | Samoa | 11.5% | 5.6%(+5.85)#81 | 5.4%(+6.10)#1,771 |
| 82. | Rio Oso | 11.4% | 5.6%(+5.79)#82 | 5.4%(+6.04)#1,796 |
| 83. | Calipatria | 11.4% | 5.6%(+5.79)#83 | 5.4%(+6.04)#1,804 |
| 84. | Inyokern | 11.4% | 5.6%(+5.79)#84 | 5.4%(+6.04)#1,805 |
| 85. | Palo Cedro | 11.4% | 5.6%(+5.75)#85 | 5.4%(+6.00)#1,818 |
| 86. | Pasatiempo | 11.3% | 5.6%(+5.68)#86 | 5.4%(+5.92)#1,860 |
| 87. | Woodville Farm Labor Camp | 11.3% | 5.6%(+5.67)#87 | 5.4%(+5.91)#1,861 |
| 88. | Pine Canyon | 11.3% | 5.6%(+5.65)#88 | 5.4%(+5.89)#1,874 |
| 89. | Robbins | 11.2% | 5.6%(+5.54)#89 | 5.4%(+5.79)#1,931 |
| 90. | Middletown | 11.1% | 5.6%(+5.51)#90 | 5.4%(+5.76)#1,942 |
| 91. | Cantua Creek | 11.1% | 5.6%(+5.50)#91 | 5.4%(+5.75)#1,948 |
| 92. | San Miguel Cdp San Luis Obispo County | 11.0% | 5.6%(+5.41)#92 | 5.4%(+5.65)#1,988 |
| 93. | Firebaugh | 10.9% | 5.6%(+5.29)#93 | 5.4%(+5.54)#2,038 |
| 94. | Calwa | 10.9% | 5.6%(+5.22)#94 | 5.4%(+5.47)#2,075 |
| 95. | East Porterville | 10.8% | 5.6%(+5.15)#95 | 5.4%(+5.40)#2,120 |
| 96. | Clearlake Riviera | 10.6% | 5.6%(+5.00)#96 | 5.4%(+5.25)#2,208 |
| 97. | Shafter | 10.6% | 5.6%(+4.99)#97 | 5.4%(+5.24)#2,222 |
| 98. | Mcclellan Park | 10.6% | 5.6%(+4.93)#98 | 5.4%(+5.17)#2,259 |
| 99. | Tipton | 10.5% | 5.6%(+4.91)#99 | 5.4%(+5.16)#2,268 |
| 100. | Honcut | 10.5% | 5.6%(+4.91)#100 | 5.4%(+5.16)#2,271 |
Common Questions
What are the Top 10 Cities with the Highest Percentage of Population Enrolled in High School in California?
Top 10 Cities with the Highest Percentage of Population Enrolled in High School in California are:
#1
42.2%
#2
34.6%
#3
30.8%
#4
29.2%
#5
25.6%
#6
25.0%
#7
24.0%
#8
22.9%
#9
21.7%
#10
20.4%
What city has the Highest Percentage of Population Enrolled in High School in California?
Sierra Village has the Highest Percentage of Population Enrolled in High School in California with 42.2%.
What is the Percentage of Population Enrolled in High School in the State of California?
Percentage of Population Enrolled in High School in California is 5.6%.
What is the Percentage of Population Enrolled in High School in the United States?
Percentage of Population Enrolled in High School in the United States is 5.4%.