Cities with the Highest Percentage of Population Employed in Construction & Extraction in California
RELATED REPORTS & OPTIONS
Construction & Extraction
California
Compare Cities
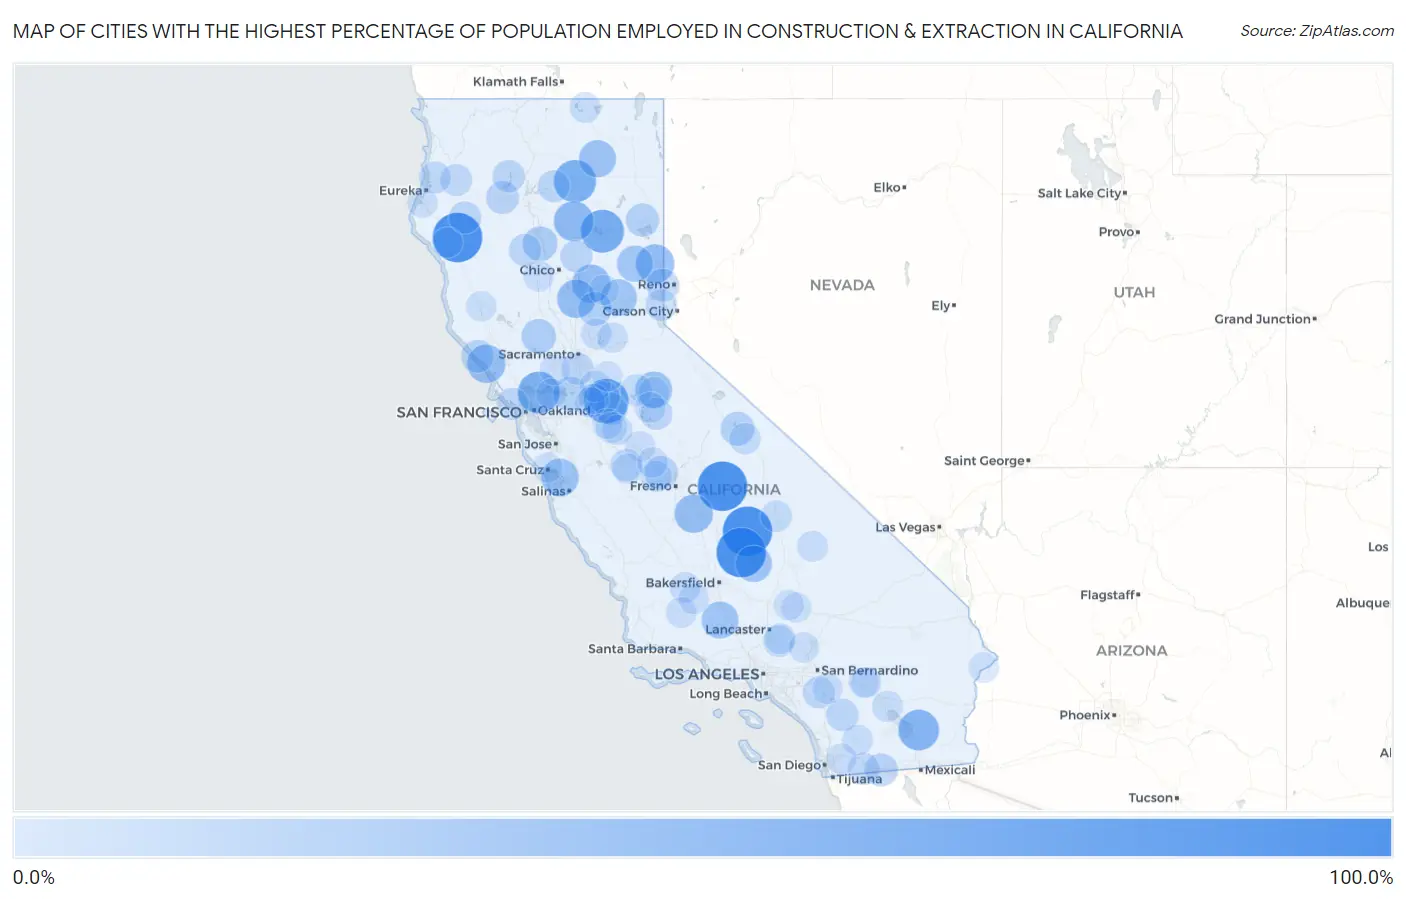
Map of Cities with the Highest Percentage of Population Employed in Construction & Extraction in California
0.0%
100.0%
Cities with the Highest Percentage of Population Employed in Construction & Extraction in California
| City | % Employed | vs State | vs National | |
| 1. | Alderpoint | 100.0% | 4.8%(+95.2)#1 | 5.0%(+95.0)#9 |
| 2. | Ponderosa | 100.0% | 4.8%(+95.2)#2 | 5.0%(+95.0)#19 |
| 3. | Panorama Heights | 100.0% | 4.8%(+95.2)#3 | 5.0%(+95.0)#23 |
| 4. | Wilsonia | 100.0% | 4.8%(+95.2)#4 | 5.0%(+95.0)#26 |
| 5. | Farmington | 77.6% | 4.8%(+72.8)#5 | 5.0%(+72.6)#54 |
| 6. | East Shore | 70.6% | 4.8%(+65.8)#6 | 5.0%(+65.6)#63 |
| 7. | Cassel | 67.4% | 4.8%(+62.6)#7 | 5.0%(+62.4)#68 |
| 8. | Port Costa | 65.2% | 4.8%(+60.4)#8 | 5.0%(+60.2)#80 |
| 9. | Niland | 60.3% | 4.8%(+55.5)#9 | 5.0%(+55.3)#94 |
| 10. | Mineral | 56.2% | 4.8%(+51.4)#10 | 5.0%(+51.3)#118 |
| 11. | Chilcoot Vinton | 51.3% | 4.8%(+46.5)#11 | 5.0%(+46.3)#155 |
| 12. | Forbestown | 50.0% | 4.8%(+45.2)#12 | 5.0%(+45.0)#165 |
| 13. | Honcut | 50.0% | 4.8%(+45.2)#13 | 5.0%(+45.0)#166 |
| 14. | Jenner | 50.0% | 4.8%(+45.2)#14 | 5.0%(+45.0)#184 |
| 15. | West Goshen | 49.7% | 4.8%(+44.9)#15 | 5.0%(+44.7)#188 |
| 16. | Pajaro Dunes | 46.7% | 4.8%(+41.8)#16 | 5.0%(+41.7)#202 |
| 17. | Lookout | 44.4% | 4.8%(+39.6)#17 | 5.0%(+39.5)#225 |
| 18. | Sierra Village | 44.2% | 4.8%(+39.4)#18 | 5.0%(+39.2)#228 |
| 19. | Lake Of The Woods | 43.4% | 4.8%(+38.6)#19 | 5.0%(+38.4)#235 |
| 20. | Washington | 42.1% | 4.8%(+37.3)#20 | 5.0%(+37.1)#252 |
| 21. | Mountain Mesa | 41.7% | 4.8%(+36.8)#21 | 5.0%(+36.7)#256 |
| 22. | Delleker | 40.6% | 4.8%(+35.8)#22 | 5.0%(+35.6)#270 |
| 23. | Proberta | 34.2% | 4.8%(+29.4)#23 | 5.0%(+29.2)#401 |
| 24. | Guinda | 33.0% | 4.8%(+28.2)#24 | 5.0%(+28.0)#440 |
| 25. | Spring Valley Cdp Lake County | 31.5% | 4.8%(+26.7)#25 | 5.0%(+26.5)#486 |
| 26. | Bethel Island | 30.4% | 4.8%(+25.6)#26 | 5.0%(+25.4)#530 |
| 27. | Aspen Springs | 30.3% | 4.8%(+25.5)#27 | 5.0%(+25.4)#532 |
| 28. | Penn Valley | 30.3% | 4.8%(+25.5)#28 | 5.0%(+25.3)#537 |
| 29. | Litchfield | 28.4% | 4.8%(+23.5)#29 | 5.0%(+23.4)#625 |
| 30. | Parkwood | 27.7% | 4.8%(+22.9)#30 | 5.0%(+22.7)#664 |
| 31. | Jacumba | 26.7% | 4.8%(+21.9)#31 | 5.0%(+21.7)#734 |
| 32. | Lewiston | 26.1% | 4.8%(+21.3)#32 | 5.0%(+21.1)#762 |
| 33. | Verdi | 25.9% | 4.8%(+21.1)#33 | 5.0%(+20.9)#775 |
| 34. | Timber Cove | 25.9% | 4.8%(+21.0)#34 | 5.0%(+20.9)#777 |
| 35. | Trinity Center | 24.4% | 4.8%(+19.6)#35 | 5.0%(+19.4)#886 |
| 36. | Aguanga | 24.2% | 4.8%(+19.3)#36 | 5.0%(+19.2)#904 |
| 37. | Mad River | 23.9% | 4.8%(+19.1)#37 | 5.0%(+18.9)#929 |
| 38. | Greeley Hill | 23.6% | 4.8%(+18.8)#38 | 5.0%(+18.6)#956 |
| 39. | Valley Home | 23.5% | 4.8%(+18.7)#39 | 5.0%(+18.5)#960 |
| 40. | Sage | 23.4% | 4.8%(+18.6)#40 | 5.0%(+18.4)#974 |
| 41. | Stirling City | 23.3% | 4.8%(+18.5)#41 | 5.0%(+18.3)#982 |
| 42. | Rancho Tehama Reserve | 23.2% | 4.8%(+18.4)#42 | 5.0%(+18.2)#992 |
| 43. | Peters | 23.0% | 4.8%(+18.1)#43 | 5.0%(+18.0)#1,019 |
| 44. | Hood | 22.9% | 4.8%(+18.1)#44 | 5.0%(+17.9)#1,027 |
| 45. | Montgomery Creek | 22.7% | 4.8%(+17.9)#45 | 5.0%(+17.7)#1,044 |
| 46. | Stinson Beach | 22.6% | 4.8%(+17.8)#46 | 5.0%(+17.6)#1,056 |
| 47. | Dos Palos Y | 22.2% | 4.8%(+17.4)#47 | 5.0%(+17.2)#1,098 |
| 48. | Campo | 22.1% | 4.8%(+17.3)#48 | 5.0%(+17.1)#1,124 |
| 49. | Good Hope | 22.0% | 4.8%(+17.2)#49 | 5.0%(+17.0)#1,135 |
| 50. | Willow Creek | 22.0% | 4.8%(+17.1)#50 | 5.0%(+17.0)#1,136 |
| 51. | Fieldbrook | 21.6% | 4.8%(+16.8)#51 | 5.0%(+16.6)#1,174 |
| 52. | Kings Beach | 21.3% | 4.8%(+16.5)#52 | 5.0%(+16.3)#1,209 |
| 53. | Vallecito | 20.8% | 4.8%(+16.0)#53 | 5.0%(+15.8)#1,263 |
| 54. | Littlerock | 20.7% | 4.8%(+15.9)#54 | 5.0%(+15.7)#1,286 |
| 55. | Cartago | 20.0% | 4.8%(+15.2)#55 | 5.0%(+15.0)#1,371 |
| 56. | Victor | 19.7% | 4.8%(+14.9)#56 | 5.0%(+14.7)#1,411 |
| 57. | Round Valley | 19.4% | 4.8%(+14.6)#57 | 5.0%(+14.4)#1,472 |
| 58. | La Vina | 19.1% | 4.8%(+14.3)#58 | 5.0%(+14.1)#1,523 |
| 59. | Keyes | 18.5% | 4.8%(+13.7)#59 | 5.0%(+13.5)#1,622 |
| 60. | Penryn | 18.0% | 4.8%(+13.2)#60 | 5.0%(+13.0)#1,733 |
| 61. | Sun Village | 17.9% | 4.8%(+13.1)#61 | 5.0%(+12.9)#1,761 |
| 62. | Mecca | 17.8% | 4.8%(+13.0)#62 | 5.0%(+12.8)#1,784 |
| 63. | Mi Wuk Village | 17.8% | 4.8%(+12.9)#63 | 5.0%(+12.8)#1,801 |
| 64. | Groveland | 17.6% | 4.8%(+12.8)#64 | 5.0%(+12.6)#1,827 |
| 65. | Woody | 17.5% | 4.8%(+12.7)#65 | 5.0%(+12.5)#1,832 |
| 66. | Mckittrick | 17.5% | 4.8%(+12.7)#66 | 5.0%(+12.5)#1,840 |
| 67. | Homewood Canyon | 17.4% | 4.8%(+12.6)#67 | 5.0%(+12.4)#1,865 |
| 68. | Salyer | 17.2% | 4.8%(+12.3)#68 | 5.0%(+12.2)#1,916 |
| 69. | Newell | 17.1% | 4.8%(+12.3)#69 | 5.0%(+12.1)#1,941 |
| 70. | Julian | 17.0% | 4.8%(+12.2)#70 | 5.0%(+12.0)#1,964 |
| 71. | New Cuyama | 16.8% | 4.8%(+12.0)#71 | 5.0%(+11.8)#2,001 |
| 72. | Casa Loma | 16.7% | 4.8%(+11.9)#72 | 5.0%(+11.7)#2,022 |
| 73. | Taft Heights | 16.7% | 4.8%(+11.8)#73 | 5.0%(+11.7)#2,029 |
| 74. | Bear Creek | 16.7% | 4.8%(+11.8)#74 | 5.0%(+11.7)#2,044 |
| 75. | Artois | 16.7% | 4.8%(+11.8)#75 | 5.0%(+11.7)#2,046 |
| 76. | Denair | 16.4% | 4.8%(+11.6)#76 | 5.0%(+11.4)#2,134 |
| 77. | Garnet | 16.3% | 4.8%(+11.5)#77 | 5.0%(+11.4)#2,138 |
| 78. | Lakeview | 16.3% | 4.8%(+11.5)#78 | 5.0%(+11.3)#2,145 |
| 79. | Elmira | 16.3% | 4.8%(+11.5)#79 | 5.0%(+11.3)#2,147 |
| 80. | Dos Palos | 16.3% | 4.8%(+11.5)#80 | 5.0%(+11.3)#2,148 |
| 81. | Fairmead | 16.1% | 4.8%(+11.3)#81 | 5.0%(+11.1)#2,218 |
| 82. | Coloma | 15.9% | 4.8%(+11.1)#82 | 5.0%(+10.9)#2,261 |
| 83. | Castella | 15.9% | 4.8%(+11.1)#83 | 5.0%(+10.9)#2,263 |
| 84. | Taft Mosswood | 15.9% | 4.8%(+11.1)#84 | 5.0%(+10.9)#2,274 |
| 85. | Calpella | 15.8% | 4.8%(+11.0)#85 | 5.0%(+10.8)#2,303 |
| 86. | Crest | 15.8% | 4.8%(+10.9)#86 | 5.0%(+10.8)#2,317 |
| 87. | Desert Edge | 15.7% | 4.8%(+10.9)#87 | 5.0%(+10.7)#2,325 |
| 88. | Phelan | 15.7% | 4.8%(+10.9)#88 | 5.0%(+10.7)#2,334 |
| 89. | Garden Acres | 15.5% | 4.8%(+10.7)#89 | 5.0%(+10.5)#2,375 |
| 90. | Boron | 15.4% | 4.8%(+10.6)#90 | 5.0%(+10.4)#2,400 |
| 91. | Garberville | 15.4% | 4.8%(+10.6)#91 | 5.0%(+10.4)#2,426 |
| 92. | Loleta | 15.3% | 4.8%(+10.5)#92 | 5.0%(+10.3)#2,437 |
| 93. | Parklawn | 15.3% | 4.8%(+10.5)#93 | 5.0%(+10.3)#2,451 |
| 94. | North Edwards | 15.2% | 4.8%(+10.4)#94 | 5.0%(+10.2)#2,490 |
| 95. | Big River | 15.1% | 4.8%(+10.3)#95 | 5.0%(+10.1)#2,510 |
| 96. | Camanche Village | 15.1% | 4.8%(+10.3)#96 | 5.0%(+10.1)#2,515 |
| 97. | Camptonville | 15.0% | 4.8%(+10.2)#97 | 5.0%(+10.0)#2,547 |
| 98. | Paradise Park | 14.8% | 4.8%(+10.0)#98 | 5.0%(+9.84)#2,608 |
| 99. | Bay Point | 14.8% | 4.8%(+9.98)#99 | 5.0%(+9.80)#2,630 |
| 100. | Camp Pendleton Mainside | 14.8% | 4.8%(+9.97)#100 | 5.0%(+9.79)#2,635 |
Common Questions
What are the Top 10 Cities with the Highest Percentage of Population Employed in Construction & Extraction in California?
Top 10 Cities with the Highest Percentage of Population Employed in Construction & Extraction in California are:
#1
100.0%
#2
100.0%
#3
100.0%
#4
100.0%
#5
77.6%
#6
70.6%
#7
67.4%
#8
65.2%
#9
60.3%
#10
56.2%
What city has the Highest Percentage of Population Employed in Construction & Extraction in California?
Alderpoint has the Highest Percentage of Population Employed in Construction & Extraction in California with 100.0%.
What is the Percentage of Population Employed in Construction & Extraction in the State of California?
Percentage of Population Employed in Construction & Extraction in California is 4.8%.
What is the Percentage of Population Employed in Construction & Extraction in the United States?
Percentage of Population Employed in Construction & Extraction in the United States is 5.0%.