Cities with the Highest Poverty Level Among Children Under the Age of 5 in California
RELATED REPORTS & OPTIONS
Highest Poverty | Child 0-5
California
Compare Cities
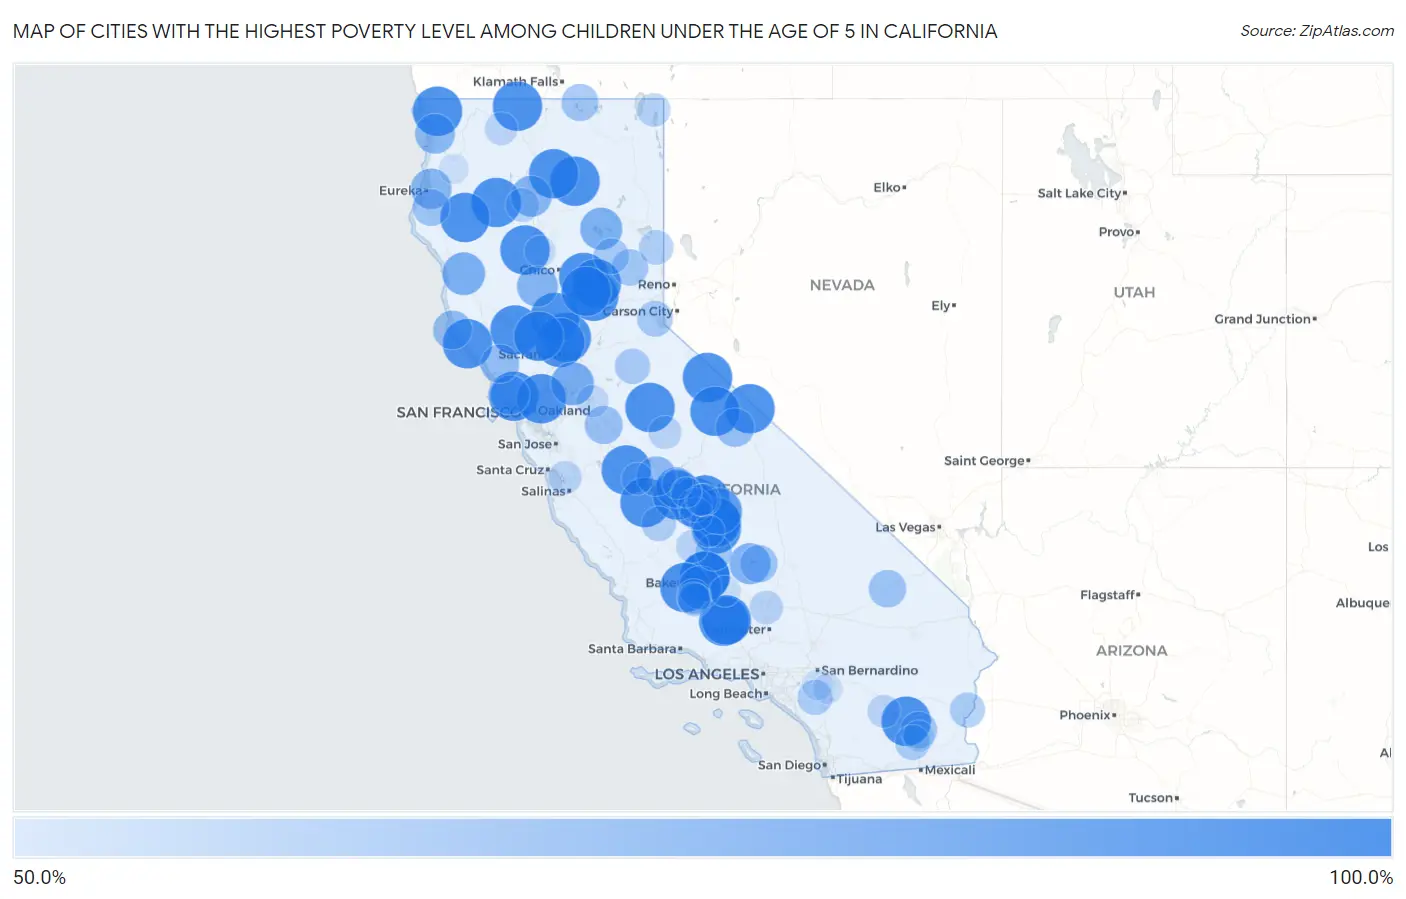
Map of Cities with the Highest Poverty Level Among Children Under the Age of 5 in California
0.0%
100.0%
Cities with the Highest Poverty Level Among Children Under the Age of 5 in California
| City | Child Poverty | vs State | vs National | |
| 1. | Strathmore | 100.0% | 15.6%(+84.4)#1 | 18.1%(+81.9)#22 |
| 2. | Frazier Park | 100.0% | 15.6%(+84.4)#2 | 18.1%(+81.9)#31 |
| 3. | South Dos Palos | 100.0% | 15.6%(+84.4)#3 | 18.1%(+81.9)#99 |
| 4. | Casa Loma | 100.0% | 15.6%(+84.4)#4 | 18.1%(+81.9)#103 |
| 5. | Woodacre | 100.0% | 15.6%(+84.4)#5 | 18.1%(+81.9)#107 |
| 6. | Lower Lake | 100.0% | 15.6%(+84.4)#6 | 18.1%(+81.9)#112 |
| 7. | Sea Ranch | 100.0% | 15.6%(+84.4)#7 | 18.1%(+81.9)#131 |
| 8. | Douglas City | 100.0% | 15.6%(+84.4)#8 | 18.1%(+81.9)#149 |
| 9. | Delft Colony | 100.0% | 15.6%(+84.4)#9 | 18.1%(+81.9)#159 |
| 10. | Berry Creek | 100.0% | 15.6%(+84.4)#10 | 18.1%(+81.9)#165 |
| 11. | Knights Landing | 100.0% | 15.6%(+84.4)#11 | 18.1%(+81.9)#173 |
| 12. | Alhambra Valley | 100.0% | 15.6%(+84.4)#12 | 18.1%(+81.9)#188 |
| 13. | Lebec | 100.0% | 15.6%(+84.4)#13 | 18.1%(+81.9)#190 |
| 14. | Rancho Tehama Reserve | 100.0% | 15.6%(+84.4)#14 | 18.1%(+81.9)#211 |
| 15. | Groveland | 100.0% | 15.6%(+84.4)#15 | 18.1%(+81.9)#277 |
| 16. | Cantua Creek | 100.0% | 15.6%(+84.4)#16 | 18.1%(+81.9)#305 |
| 17. | East Orosi | 100.0% | 15.6%(+84.4)#17 | 18.1%(+81.9)#357 |
| 18. | Dobbins | 100.0% | 15.6%(+84.4)#18 | 18.1%(+81.9)#358 |
| 19. | Bridgeport | 100.0% | 15.6%(+84.4)#19 | 18.1%(+81.9)#363 |
| 20. | Benton | 100.0% | 15.6%(+84.4)#20 | 18.1%(+81.9)#373 |
| 21. | Hornbrook | 100.0% | 15.6%(+84.4)#21 | 18.1%(+81.9)#382 |
| 22. | Gasquet | 100.0% | 15.6%(+84.4)#22 | 18.1%(+81.9)#394 |
| 23. | Grimes | 100.0% | 15.6%(+84.4)#23 | 18.1%(+81.9)#400 |
| 24. | Mad River | 100.0% | 15.6%(+84.4)#24 | 18.1%(+81.9)#429 |
| 25. | Clipper Mills | 100.0% | 15.6%(+84.4)#25 | 18.1%(+81.9)#437 |
| 26. | Tonyville | 100.0% | 15.6%(+84.4)#26 | 18.1%(+81.9)#439 |
| 27. | Mexican Colony | 100.0% | 15.6%(+84.4)#28 | 18.1%(+81.9)#449 |
| 28. | June Lake | 100.0% | 15.6%(+84.4)#29 | 18.1%(+81.9)#450 |
| 29. | Yolo | 100.0% | 15.6%(+84.4)#30 | 18.1%(+81.9)#474 |
| 30. | Bombay Beach | 100.0% | 15.6%(+84.4)#31 | 18.1%(+81.9)#512 |
| 31. | Cassel | 100.0% | 15.6%(+84.4)#32 | 18.1%(+81.9)#533 |
| 32. | Bowles | 100.0% | 15.6%(+84.4)#33 | 18.1%(+81.9)#537 |
| 33. | Rackerby | 100.0% | 15.6%(+84.4)#34 | 18.1%(+81.9)#544 |
| 34. | Guinda | 100.0% | 15.6%(+84.4)#35 | 18.1%(+81.9)#588 |
| 35. | Big Bend | 100.0% | 15.6%(+84.4)#36 | 18.1%(+81.9)#613 |
| 36. | Cherokee Strip | 100.0% | 15.6%(+84.4)#37 | 18.1%(+81.9)#618 |
| 37. | La Grange | 100.0% | 15.6%(+84.4)#38 | 18.1%(+81.9)#670 |
| 38. | Mckittrick | 100.0% | 15.6%(+84.4)#39 | 18.1%(+81.9)#775 |
| 39. | Weitchpec | 100.0% | 15.6%(+84.4)#40 | 18.1%(+81.9)#814 |
| 40. | El Rancho | 100.0% | 15.6%(+84.4)#41 | 18.1%(+81.9)#847 |
| 41. | North Fork | 95.1% | 15.6%(+79.5)#42 | 18.1%(+77.0)#935 |
| 42. | Lemon Cove | 93.0% | 15.6%(+77.4)#43 | 18.1%(+75.0)#966 |
| 43. | Isleton | 85.7% | 15.6%(+70.1)#44 | 18.1%(+67.7)#1,136 |
| 44. | Tupman | 85.7% | 15.6%(+70.1)#45 | 18.1%(+67.7)#1,145 |
| 45. | Laytonville | 84.6% | 15.6%(+69.0)#46 | 18.1%(+66.6)#1,165 |
| 46. | Hamilton Branch | 83.3% | 15.6%(+67.7)#47 | 18.1%(+65.3)#1,213 |
| 47. | Lake Isabella | 81.2% | 15.6%(+65.6)#48 | 18.1%(+63.2)#1,293 |
| 48. | Willows | 80.8% | 15.6%(+65.2)#49 | 18.1%(+62.7)#1,299 |
| 49. | Mountain Gate | 80.7% | 15.6%(+65.1)#50 | 18.1%(+62.6)#1,305 |
| 50. | Calwa | 80.3% | 15.6%(+64.6)#51 | 18.1%(+62.2)#1,313 |
| 51. | Indianola | 80.0% | 15.6%(+64.4)#52 | 18.1%(+61.9)#1,324 |
| 52. | Klamath | 78.4% | 15.6%(+62.8)#53 | 18.1%(+60.3)#1,393 |
| 53. | La Vina | 78.0% | 15.6%(+62.4)#54 | 18.1%(+59.9)#1,403 |
| 54. | Lagunitas Forest Knolls | 76.9% | 15.6%(+61.3)#55 | 18.1%(+58.9)#1,447 |
| 55. | Point Arena | 76.2% | 15.6%(+60.6)#56 | 18.1%(+58.1)#1,478 |
| 56. | Crowley Lake | 75.5% | 15.6%(+59.9)#57 | 18.1%(+57.5)#1,498 |
| 57. | Graton | 75.5% | 15.6%(+59.8)#58 | 18.1%(+57.4)#1,501 |
| 58. | Riverdale Park | 74.2% | 15.6%(+58.6)#59 | 18.1%(+56.2)#1,575 |
| 59. | Baker | 73.1% | 15.6%(+57.5)#60 | 18.1%(+55.0)#1,629 |
| 60. | Weldon | 73.0% | 15.6%(+57.4)#61 | 18.1%(+55.0)#1,633 |
| 61. | Tulelake | 72.2% | 15.6%(+56.6)#62 | 18.1%(+54.2)#1,665 |
| 62. | Hydesville | 72.0% | 15.6%(+56.4)#63 | 18.1%(+53.9)#1,671 |
| 63. | Niland | 71.2% | 15.6%(+55.6)#64 | 18.1%(+53.1)#1,729 |
| 64. | Clio | 71.0% | 15.6%(+55.4)#65 | 18.1%(+52.9)#1,732 |
| 65. | Richgrove | 70.9% | 15.6%(+55.3)#66 | 18.1%(+52.9)#1,734 |
| 66. | East Quincy | 69.5% | 15.6%(+53.9)#67 | 18.1%(+51.4)#1,809 |
| 67. | Tahoma | 69.4% | 15.6%(+53.8)#68 | 18.1%(+51.3)#1,819 |
| 68. | West Point | 68.4% | 15.6%(+52.8)#69 | 18.1%(+50.4)#1,876 |
| 69. | Westmorland | 67.7% | 15.6%(+52.1)#70 | 18.1%(+49.7)#1,912 |
| 70. | Ripley | 67.7% | 15.6%(+52.1)#71 | 18.1%(+49.6)#1,913 |
| 71. | Warm Springs | 67.7% | 15.6%(+52.0)#72 | 18.1%(+49.6)#1,916 |
| 72. | Huron | 67.0% | 15.6%(+51.4)#73 | 18.1%(+48.9)#1,955 |
| 73. | Doyle | 66.7% | 15.6%(+51.1)#74 | 18.1%(+48.6)#1,974 |
| 74. | Ford City | 66.0% | 15.6%(+50.3)#75 | 18.1%(+47.9)#2,056 |
| 75. | London | 65.4% | 15.6%(+49.8)#76 | 18.1%(+47.4)#2,088 |
| 76. | Shasta | 65.0% | 15.6%(+49.4)#77 | 18.1%(+46.9)#2,111 |
| 77. | Mojave | 64.3% | 15.6%(+48.7)#78 | 18.1%(+46.3)#2,159 |
| 78. | Fort Bidwell | 64.3% | 15.6%(+48.7)#79 | 18.1%(+46.2)#2,171 |
| 79. | Mariposa | 63.6% | 15.6%(+48.0)#80 | 18.1%(+45.6)#2,201 |
| 80. | Las Lomas | 63.6% | 15.6%(+48.0)#81 | 18.1%(+45.5)#2,222 |
| 81. | Taft | 63.5% | 15.6%(+47.9)#82 | 18.1%(+45.4)#2,226 |
| 82. | South Taft | 63.3% | 15.6%(+47.7)#83 | 18.1%(+45.3)#2,234 |
| 83. | Fort Jones | 63.0% | 15.6%(+47.4)#84 | 18.1%(+45.0)#2,255 |
| 84. | Oasis | 63.0% | 15.6%(+47.4)#85 | 18.1%(+44.9)#2,257 |
| 85. | Alpaugh | 62.9% | 15.6%(+47.2)#86 | 18.1%(+44.8)#2,269 |
| 86. | Goshen | 62.6% | 15.6%(+47.0)#87 | 18.1%(+44.6)#2,282 |
| 87. | Orosi | 62.6% | 15.6%(+46.9)#88 | 18.1%(+44.5)#2,287 |
| 88. | Kennedy | 61.7% | 15.6%(+46.0)#89 | 18.1%(+43.6)#2,365 |
| 89. | Sultana | 60.9% | 15.6%(+45.3)#90 | 18.1%(+42.9)#2,432 |
| 90. | Woodville | 60.9% | 15.6%(+45.3)#91 | 18.1%(+42.8)#2,439 |
| 91. | Firebaugh | 60.8% | 15.6%(+45.2)#92 | 18.1%(+42.8)#2,446 |
| 92. | Calipatria | 60.4% | 15.6%(+44.7)#93 | 18.1%(+42.3)#2,474 |
| 93. | Richfield | 60.0% | 15.6%(+44.4)#94 | 18.1%(+41.9)#2,539 |
| 94. | Rexland Acres | 58.8% | 15.6%(+43.2)#95 | 18.1%(+40.7)#2,627 |
| 95. | Weedpatch | 58.8% | 15.6%(+43.2)#96 | 18.1%(+40.7)#2,629 |
| 96. | March Arb | 58.1% | 15.6%(+42.5)#97 | 18.1%(+40.1)#2,683 |
| 97. | Mayfair | 57.6% | 15.6%(+42.0)#98 | 18.1%(+39.6)#2,718 |
| 98. | Del Rey | 57.6% | 15.6%(+42.0)#99 | 18.1%(+39.5)#2,720 |
| 99. | Lakeview | 57.4% | 15.6%(+41.8)#100 | 18.1%(+39.3)#2,736 |
| 100. | Hoopa | 57.1% | 15.6%(+41.5)#101 | 18.1%(+39.1)#2,747 |
Common Questions
What are the Top 10 Cities with the Highest Poverty Level Among Children Under the Age of 5 in California?
Top 10 Cities with the Highest Poverty Level Among Children Under the Age of 5 in California are:
#1
100.0%
#2
100.0%
#3
100.0%
#4
100.0%
#5
100.0%
#6
100.0%
#7
100.0%
#8
100.0%
#9
100.0%
#10
100.0%
What city has the Highest Poverty Level Among Children Under the Age of 5 in California?
Strathmore has the Highest Poverty Level Among Children Under the Age of 5 in California with 100.0%.
What is the Poverty Level Among Children Under the Age of 5 in the State of California?
Poverty Level Among Children Under the Age of 5 in California is 15.6%.
What is the Poverty Level Among Children Under the Age of 5 in the United States?
Poverty Level Among Children Under the Age of 5 in the United States is 18.1%.