Cities with the Highest Percentage of Immigrants from Chile in California
RELATED REPORTS & OPTIONS
Chile
California
Compare Cities
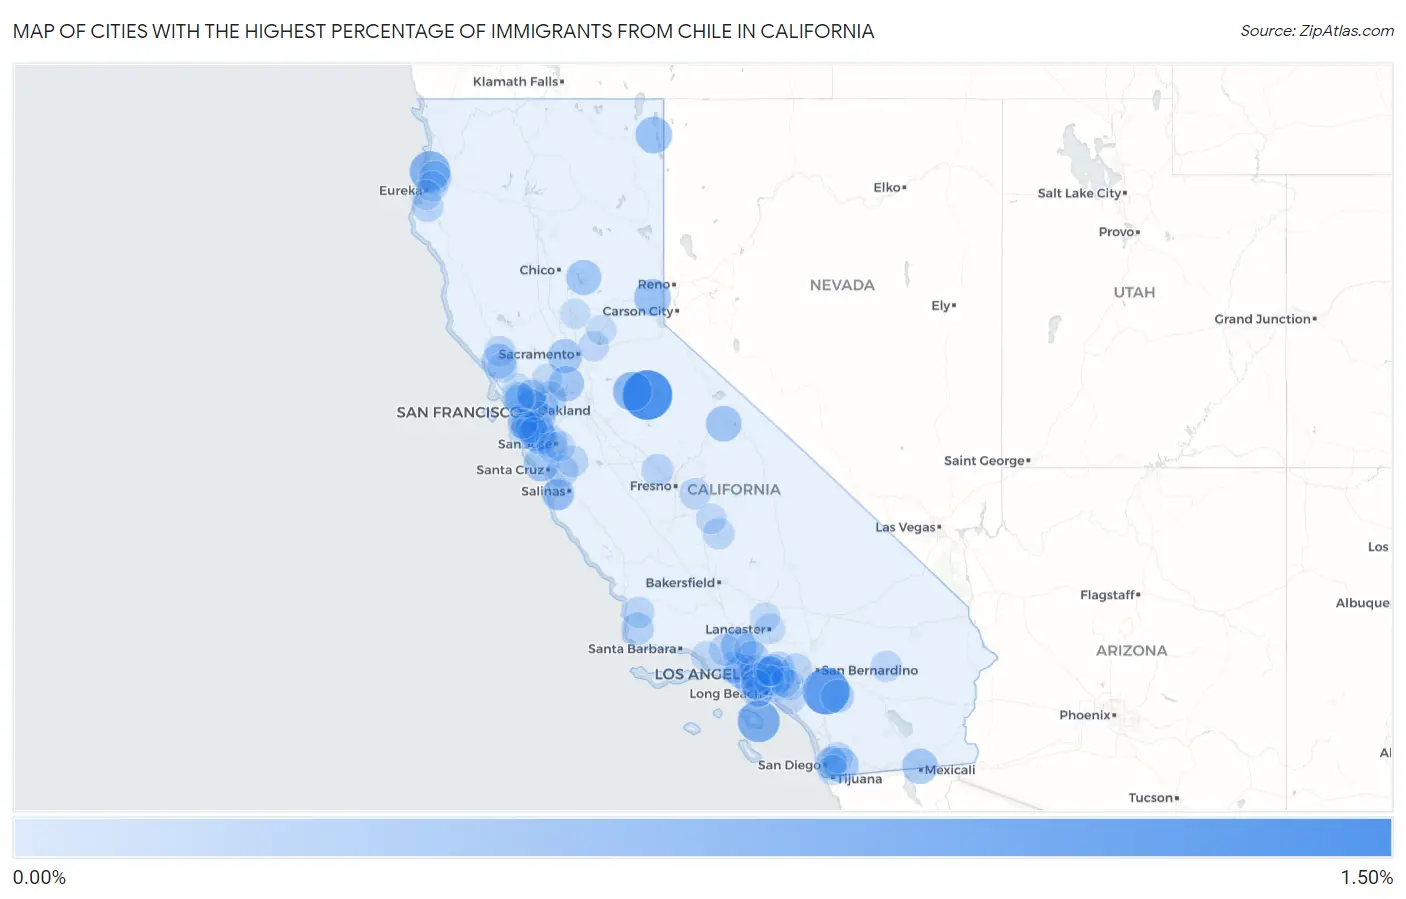
Map of Cities with the Highest Percentage of Immigrants from Chile in California
0.00%
1.50%
Cities with the Highest Percentage of Immigrants from Chile in California
| City | Chile | vs State | vs National | |
| 1. | Mono Vista | 1.41% | 0.039%(+1.37)#115 | 0.032%(+1.38)#951 |
| 2. | Nuevo | 1.19% | 0.039%(+1.15)#382 | 0.032%(+1.16)#2,993 |
| 3. | Avalon | 0.87% | 0.039%(+0.833)#383 | 0.032%(+0.840)#2,994 |
| 4. | Westhaven Moonstone | 0.77% | 0.039%(+0.731)#384 | 0.032%(+0.738)#2,995 |
| 5. | Angels | 0.67% | 0.039%(+0.634)#385 | 0.032%(+0.641)#2,996 |
| 6. | Strawberry Cdp Marin County | 0.57% | 0.039%(+0.529)#386 | 0.032%(+0.536)#2,997 |
| 7. | Truckee | 0.52% | 0.039%(+0.485)#387 | 0.032%(+0.492)#2,998 |
| 8. | Cedarville | 0.51% | 0.039%(+0.472)#388 | 0.032%(+0.479)#2,999 |
| 9. | Val Verde | 0.46% | 0.039%(+0.417)#389 | 0.032%(+0.423)#3,000 |
| 10. | Mammoth Lakes | 0.44% | 0.039%(+0.402)#390 | 0.032%(+0.409)#3,001 |
| 11. | Calexico | 0.42% | 0.039%(+0.383)#391 | 0.032%(+0.390)#3,002 |
| 12. | Bonny Doon | 0.42% | 0.039%(+0.381)#392 | 0.032%(+0.388)#3,003 |
| 13. | Rio Vista | 0.42% | 0.039%(+0.378)#393 | 0.032%(+0.385)#3,004 |
| 14. | Topanga | 0.40% | 0.039%(+0.363)#394 | 0.032%(+0.370)#3,005 |
| 15. | North Fair Oaks | 0.40% | 0.039%(+0.362)#395 | 0.032%(+0.369)#3,006 |
| 16. | Marina Del Rey | 0.40% | 0.039%(+0.360)#396 | 0.032%(+0.367)#3,007 |
| 17. | Berry Creek | 0.40% | 0.039%(+0.359)#397 | 0.032%(+0.365)#3,008 |
| 18. | Forestville | 0.39% | 0.039%(+0.346)#398 | 0.032%(+0.353)#3,009 |
| 19. | Jamul | 0.38% | 0.039%(+0.343)#399 | 0.032%(+0.350)#3,010 |
| 20. | Lake Shastina | 0.37% | 0.039%(+0.327)#400 | 0.032%(+0.334)#3,011 |
| 21. | Davis | 0.35% | 0.039%(+0.314)#401 | 0.032%(+0.320)#3,139 |
| 22. | Stanford | 0.31% | 0.039%(+0.274)#402 | 0.032%(+0.281)#3,140 |
| 23. | Burlingame | 0.30% | 0.039%(+0.261)#460 | 0.032%(+0.268)#3,702 |
| 24. | West Hollywood | 0.29% | 0.039%(+0.247)#461 | 0.032%(+0.253)#3,703 |
| 25. | East Hemet | 0.28% | 0.039%(+0.242)#462 | 0.032%(+0.249)#3,704 |
| 26. | San Fernando | 0.27% | 0.039%(+0.232)#463 | 0.032%(+0.239)#3,705 |
| 27. | Fieldbrook | 0.26% | 0.039%(+0.218)#464 | 0.032%(+0.225)#3,706 |
| 28. | Concord | 0.26% | 0.039%(+0.217)#465 | 0.032%(+0.224)#3,707 |
| 29. | Albany | 0.23% | 0.039%(+0.196)#466 | 0.032%(+0.202)#3,708 |
| 30. | Vandenberg Village | 0.22% | 0.039%(+0.185)#467 | 0.032%(+0.192)#3,709 |
| 31. | Colma | 0.22% | 0.039%(+0.179)#468 | 0.032%(+0.186)#3,710 |
| 32. | Agoura Hills | 0.21% | 0.039%(+0.175)#469 | 0.032%(+0.182)#3,711 |
| 33. | Moraga | 0.21% | 0.039%(+0.169)#470 | 0.032%(+0.175)#3,712 |
| 34. | East San Gabriel | 0.20% | 0.039%(+0.164)#471 | 0.032%(+0.171)#3,713 |
| 35. | Madera | 0.20% | 0.039%(+0.162)#472 | 0.032%(+0.168)#3,714 |
| 36. | Amesti | 0.20% | 0.039%(+0.158)#473 | 0.032%(+0.165)#3,715 |
| 37. | Fillmore | 0.19% | 0.039%(+0.155)#474 | 0.032%(+0.162)#3,716 |
| 38. | Seaside | 0.19% | 0.039%(+0.153)#475 | 0.032%(+0.160)#3,717 |
| 39. | Fortuna | 0.19% | 0.039%(+0.153)#476 | 0.032%(+0.159)#3,718 |
| 40. | Foster City | 0.19% | 0.039%(+0.148)#503 | 0.032%(+0.154)#4,088 |
| 41. | Monrovia | 0.19% | 0.039%(+0.147)#504 | 0.032%(+0.154)#4,089 |
| 42. | Santa Clara | 0.18% | 0.039%(+0.144)#505 | 0.032%(+0.151)#4,090 |
| 43. | San Martin | 0.17% | 0.039%(+0.136)#506 | 0.032%(+0.143)#4,091 |
| 44. | Lemon Grove | 0.17% | 0.039%(+0.132)#507 | 0.032%(+0.139)#4,092 |
| 45. | Cerritos | 0.17% | 0.039%(+0.126)#508 | 0.032%(+0.133)#4,093 |
| 46. | Porterville | 0.16% | 0.039%(+0.123)#509 | 0.032%(+0.129)#4,094 |
| 47. | San Anselmo | 0.16% | 0.039%(+0.118)#510 | 0.032%(+0.125)#4,095 |
| 48. | Reedley | 0.15% | 0.039%(+0.115)#511 | 0.032%(+0.122)#4,096 |
| 49. | Santa Maria | 0.15% | 0.039%(+0.113)#512 | 0.032%(+0.119)#4,097 |
| 50. | San Leandro | 0.15% | 0.039%(+0.111)#513 | 0.032%(+0.118)#4,098 |
| 51. | Millbrae | 0.15% | 0.039%(+0.110)#514 | 0.032%(+0.117)#4,099 |
| 52. | La Puente | 0.15% | 0.039%(+0.109)#515 | 0.032%(+0.116)#4,100 |
| 53. | Hacienda Heights | 0.15% | 0.039%(+0.107)#516 | 0.032%(+0.114)#4,101 |
| 54. | Monterey | 0.14% | 0.039%(+0.104)#517 | 0.032%(+0.111)#4,102 |
| 55. | San Mateo | 0.14% | 0.039%(+0.103)#518 | 0.032%(+0.110)#4,103 |
| 56. | Temple City | 0.14% | 0.039%(+0.102)#519 | 0.032%(+0.109)#4,104 |
| 57. | Upland | 0.14% | 0.039%(+0.097)#520 | 0.032%(+0.104)#4,105 |
| 58. | Twentynine Palms | 0.14% | 0.039%(+0.097)#521 | 0.032%(+0.103)#4,106 |
| 59. | Berkeley | 0.13% | 0.039%(+0.092)#522 | 0.032%(+0.099)#4,107 |
| 60. | Healdsburg | 0.13% | 0.039%(+0.092)#523 | 0.032%(+0.098)#4,108 |
| 61. | Bostonia | 0.13% | 0.039%(+0.092)#524 | 0.032%(+0.098)#4,109 |
| 62. | South Pasadena | 0.13% | 0.039%(+0.089)#525 | 0.032%(+0.096)#4,110 |
| 63. | Half Moon Bay | 0.12% | 0.039%(+0.081)#526 | 0.032%(+0.088)#4,111 |
| 64. | Irvine | 0.12% | 0.039%(+0.080)#527 | 0.032%(+0.086)#4,112 |
| 65. | South Whittier | 0.11% | 0.039%(+0.074)#528 | 0.032%(+0.081)#4,113 |
| 66. | San Carlos | 0.11% | 0.039%(+0.072)#529 | 0.032%(+0.079)#4,114 |
| 67. | Rolling Hills Estates | 0.11% | 0.039%(+0.071)#530 | 0.032%(+0.077)#4,115 |
| 68. | Orangevale | 0.11% | 0.039%(+0.070)#531 | 0.032%(+0.077)#4,229 |
| 69. | Lancaster | 0.11% | 0.039%(+0.069)#532 | 0.032%(+0.076)#4,230 |
| 70. | Arcata | 0.11% | 0.039%(+0.069)#533 | 0.032%(+0.076)#4,231 |
| 71. | Exeter | 0.11% | 0.039%(+0.067)#534 | 0.032%(+0.074)#4,232 |
| 72. | Lomita | 0.11% | 0.039%(+0.067)#535 | 0.032%(+0.074)#4,233 |
| 73. | Novato | 0.10% | 0.039%(+0.065)#536 | 0.032%(+0.071)#4,234 |
| 74. | Yorba Linda | 0.10% | 0.039%(+0.062)#537 | 0.032%(+0.069)#4,235 |
| 75. | Campbell | 0.10% | 0.039%(+0.062)#538 | 0.032%(+0.069)#4,236 |
| 76. | Downey | 0.096% | 0.039%(+0.057)#539 | 0.032%(+0.064)#4,237 |
| 77. | Kentfield | 0.094% | 0.039%(+0.055)#540 | 0.032%(+0.062)#4,238 |
| 78. | Sebastopol | 0.093% | 0.039%(+0.054)#541 | 0.032%(+0.061)#4,239 |
| 79. | Del Aire | 0.093% | 0.039%(+0.054)#542 | 0.032%(+0.061)#4,240 |
| 80. | San Buenaventura Ventura | 0.092% | 0.039%(+0.053)#543 | 0.032%(+0.059)#4,241 |
| 81. | San Jose | 0.090% | 0.039%(+0.051)#544 | 0.032%(+0.058)#4,242 |
| 82. | La Mesa | 0.090% | 0.039%(+0.051)#545 | 0.032%(+0.058)#4,295 |
| 83. | Ladera Heights | 0.089% | 0.039%(+0.050)#546 | 0.032%(+0.057)#4,296 |
| 84. | Chula Vista | 0.088% | 0.039%(+0.049)#547 | 0.032%(+0.056)#4,297 |
| 85. | Hercules | 0.088% | 0.039%(+0.049)#548 | 0.032%(+0.056)#4,298 |
| 86. | Pine Hills | 0.086% | 0.039%(+0.046)#549 | 0.032%(+0.053)#4,299 |
| 87. | Bell Gardens | 0.084% | 0.039%(+0.045)#550 | 0.032%(+0.052)#4,300 |
| 88. | Fairfield | 0.084% | 0.039%(+0.045)#551 | 0.032%(+0.052)#4,301 |
| 89. | Brea | 0.083% | 0.039%(+0.044)#552 | 0.032%(+0.051)#4,302 |
| 90. | Lawndale | 0.082% | 0.039%(+0.043)#553 | 0.032%(+0.050)#4,303 |
| 91. | Rosamond | 0.082% | 0.039%(+0.043)#554 | 0.032%(+0.050)#4,304 |
| 92. | Linda | 0.082% | 0.039%(+0.043)#555 | 0.032%(+0.049)#4,305 |
| 93. | Auburn | 0.080% | 0.039%(+0.041)#556 | 0.032%(+0.048)#4,306 |
| 94. | Pinole | 0.079% | 0.039%(+0.040)#557 | 0.032%(+0.047)#4,307 |
| 95. | Pacifica | 0.079% | 0.039%(+0.040)#558 | 0.032%(+0.047)#4,308 |
| 96. | University Of California-Santa Barbara | 0.079% | 0.039%(+0.040)#559 | 0.032%(+0.046)#4,309 |
| 97. | Santa Clarita | 0.078% | 0.039%(+0.039)#560 | 0.032%(+0.046)#4,310 |
| 98. | Alhambra | 0.078% | 0.039%(+0.039)#561 | 0.032%(+0.046)#4,311 |
| 99. | San Gabriel | 0.077% | 0.039%(+0.037)#562 | 0.032%(+0.044)#4,312 |
| 100. | San Rafael | 0.076% | 0.039%(+0.037)#563 | 0.032%(+0.043)#4,313 |
Common Questions
What are the Top 10 Cities with the Highest Percentage of Immigrants from Chile in California?
Top 10 Cities with the Highest Percentage of Immigrants from Chile in California are:
#1
1.41%
#2
1.19%
#3
0.87%
#4
0.77%
#5
0.67%
#6
0.52%
#7
0.51%
#8
0.46%
#9
0.44%
#10
0.42%
What city has the Highest Percentage of Immigrants from Chile in California?
Mono Vista has the Highest Percentage of Immigrants from Chile in California with 1.41%.
What is the Percentage of Immigrants from Chile in the State of California?
Percentage of Immigrants from Chile in California is 0.039%.
What is the Percentage of Immigrants from Chile in the United States?
Percentage of Immigrants from Chile in the United States is 0.032%.