Zip Codes with the Highest Percentage of Population Employed in Installation, Maintenance & Repair in Hesperia, CA
RELATED REPORTS & OPTIONS
Installation, Maintenance & Repair
Hesperia
Compare Zip Codes
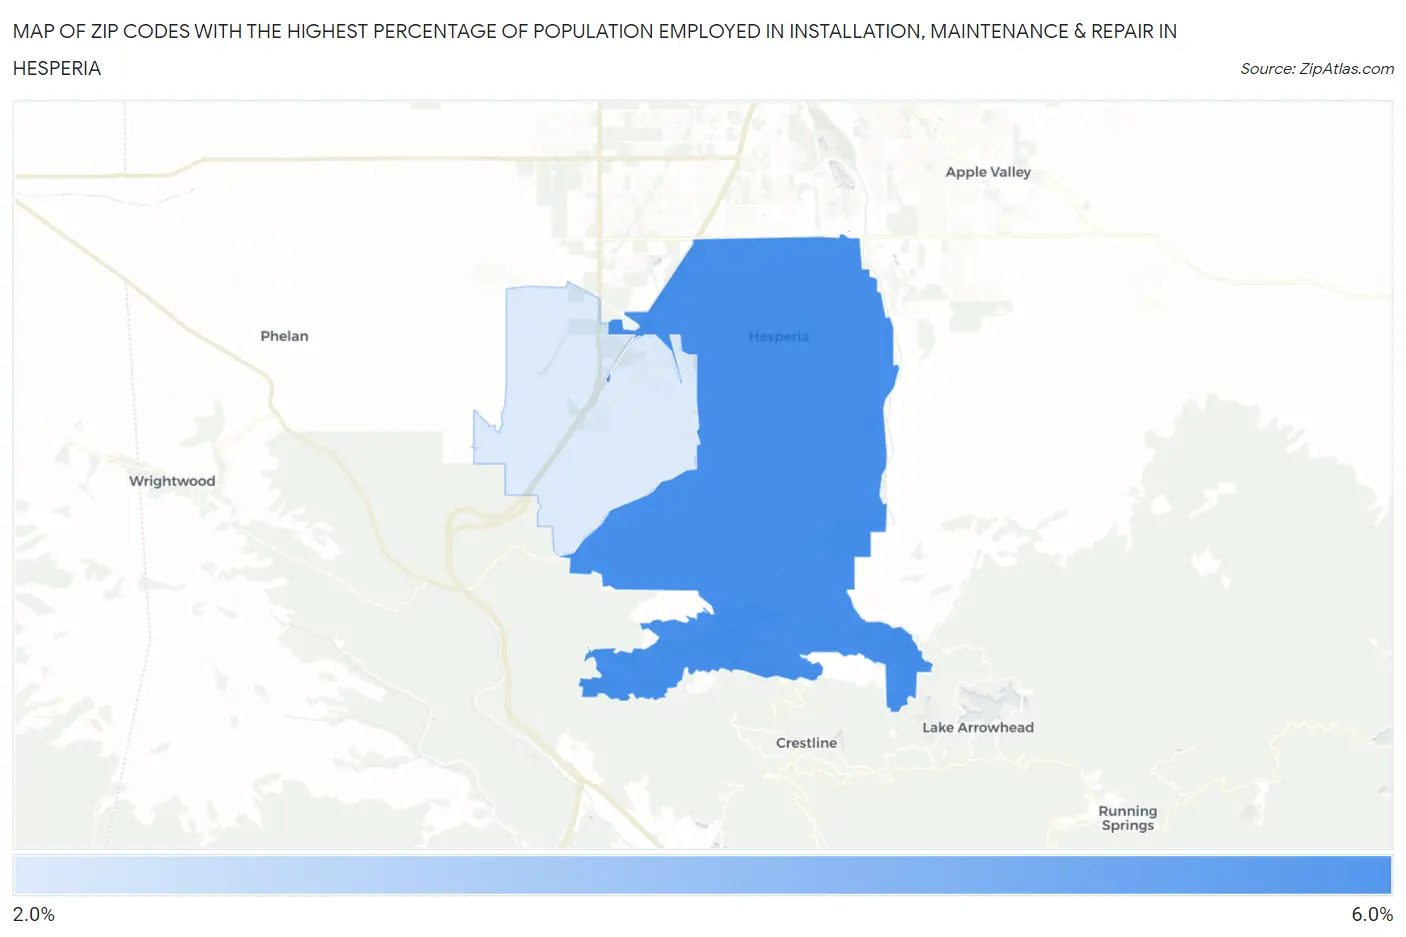
Map of Zip Codes with the Highest Percentage of Population Employed in Installation, Maintenance & Repair in Hesperia
2.8%
5.3%
Zip Codes with the Highest Percentage of Population Employed in Installation, Maintenance & Repair in Hesperia, CA
| Zip Code | % Employed | vs State | vs National | |
| 1. | 92345 | 5.3% | 2.6%(+2.73)#176 | 3.1%(+2.22)#7,841 |
| 2. | 92344 | 2.8% | 2.6%(+0.265)#658 | 3.1%(-0.246)#17,890 |
1
Common Questions
What are the Top Zip Codes with the Highest Percentage of Population Employed in Installation, Maintenance & Repair in Hesperia, CA?
Top Zip Codes with the Highest Percentage of Population Employed in Installation, Maintenance & Repair in Hesperia, CA are:
What zip code has the Highest Percentage of Population Employed in Installation, Maintenance & Repair in Hesperia, CA?
92345 has the Highest Percentage of Population Employed in Installation, Maintenance & Repair in Hesperia, CA with 5.3%.
What is the Percentage of Population Employed in Installation, Maintenance & Repair in Hesperia, CA?
Percentage of Population Employed in Installation, Maintenance & Repair in Hesperia is 5.0%.
What is the Percentage of Population Employed in Installation, Maintenance & Repair in California?
Percentage of Population Employed in Installation, Maintenance & Repair in California is 2.6%.
What is the Percentage of Population Employed in Installation, Maintenance & Repair in the United States?
Percentage of Population Employed in Installation, Maintenance & Repair in the United States is 3.1%.