Cities with the Largest West Indian Community in California
RELATED REPORTS & OPTIONS
West Indian
California
Compare Cities
Map of Cities with the Largest West Indian Community in California
0
1,500
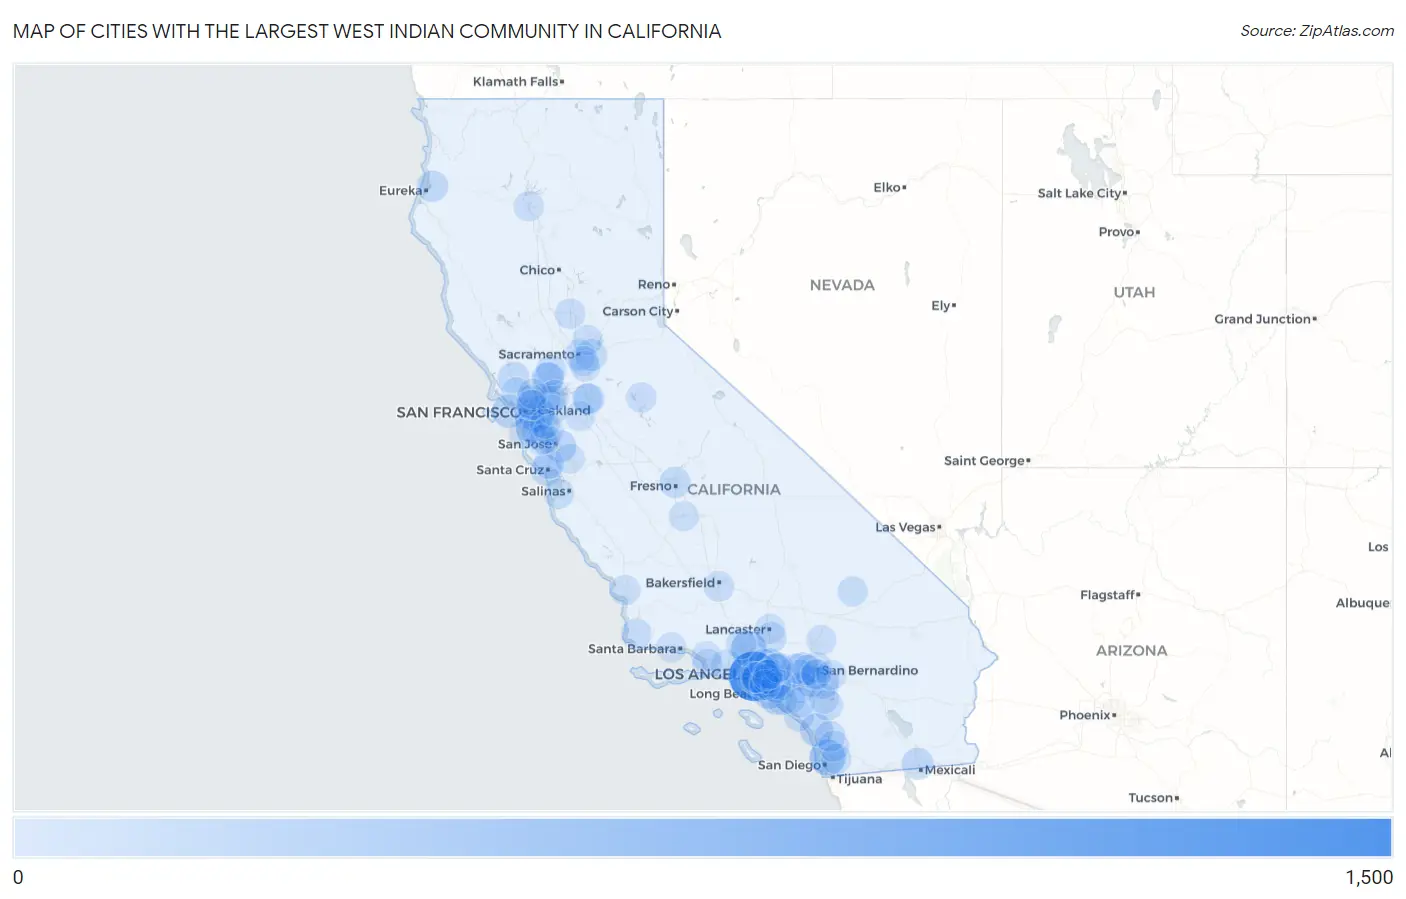
Cities with the Largest West Indian Community in California
| City | West Indian | vs State | vs National | |
| 1. | Los Angeles | 1,440 | 9,156(15.73%)#1 | 267,308(0.54%)#9 |
| 2. | San Diego | 440 | 9,156(4.81%)#2 | 267,308(0.16%)#55 |
| 3. | Oakland | 410 | 9,156(4.48%)#3 | 267,308(0.15%)#62 |
| 4. | Santa Clarita | 402 | 9,156(4.39%)#4 | 267,308(0.15%)#64 |
| 5. | Oceanside | 238 | 9,156(2.60%)#5 | 267,308(0.09%)#135 |
| 6. | San Francisco | 232 | 9,156(2.53%)#6 | 267,308(0.09%)#138 |
| 7. | Pasadena | 210 | 9,156(2.29%)#7 | 267,308(0.08%)#155 |
| 8. | Long Beach | 204 | 9,156(2.23%)#8 | 267,308(0.08%)#161 |
| 9. | Moreno Valley | 204 | 9,156(2.23%)#9 | 267,308(0.08%)#162 |
| 10. | San Jose | 176 | 9,156(1.92%)#10 | 267,308(0.07%)#193 |
| 11. | Rancho Cucamonga | 175 | 9,156(1.91%)#11 | 267,308(0.07%)#194 |
| 12. | Bellflower | 169 | 9,156(1.85%)#12 | 267,308(0.06%)#206 |
| 13. | Huntington Beach | 157 | 9,156(1.71%)#13 | 267,308(0.06%)#215 |
| 14. | Redwood City | 149 | 9,156(1.63%)#14 | 267,308(0.06%)#223 |
| 15. | Heber | 147 | 9,156(1.61%)#15 | 267,308(0.05%)#230 |
| 16. | Fairfield | 128 | 9,156(1.40%)#16 | 267,308(0.05%)#269 |
| 17. | Inglewood | 125 | 9,156(1.37%)#17 | 267,308(0.05%)#278 |
| 18. | Riverside | 124 | 9,156(1.35%)#18 | 267,308(0.05%)#282 |
| 19. | Rancho Cordova | 118 | 9,156(1.29%)#19 | 267,308(0.04%)#293 |
| 20. | Petaluma | 117 | 9,156(1.28%)#20 | 267,308(0.04%)#298 |
| 21. | Stockton | 114 | 9,156(1.25%)#21 | 267,308(0.04%)#307 |
| 22. | Culver City | 107 | 9,156(1.17%)#22 | 267,308(0.04%)#329 |
| 23. | Arcata | 107 | 9,156(1.17%)#23 | 267,308(0.04%)#332 |
| 24. | Santa Cruz | 102 | 9,156(1.11%)#24 | 267,308(0.04%)#345 |
| 25. | San Bernardino | 84 | 9,156(0.92%)#25 | 267,308(0.03%)#412 |
| 26. | Fresno | 83 | 9,156(0.91%)#26 | 267,308(0.03%)#417 |
| 27. | Sacramento | 74 | 9,156(0.81%)#27 | 267,308(0.03%)#451 |
| 28. | French Valley | 72 | 9,156(0.79%)#28 | 267,308(0.03%)#472 |
| 29. | Concord | 70 | 9,156(0.76%)#29 | 267,308(0.03%)#482 |
| 30. | Poway | 68 | 9,156(0.74%)#30 | 267,308(0.03%)#498 |
| 31. | Escondido | 63 | 9,156(0.69%)#31 | 267,308(0.02%)#524 |
| 32. | Pleasant Hill | 62 | 9,156(0.68%)#32 | 267,308(0.02%)#531 |
| 33. | Ontario | 59 | 9,156(0.64%)#33 | 267,308(0.02%)#550 |
| 34. | Palmdale | 59 | 9,156(0.64%)#34 | 267,308(0.02%)#551 |
| 35. | Lynwood | 59 | 9,156(0.64%)#35 | 267,308(0.02%)#554 |
| 36. | Thousand Oaks | 57 | 9,156(0.62%)#36 | 267,308(0.02%)#568 |
| 37. | Castaic | 55 | 9,156(0.60%)#37 | 267,308(0.02%)#593 |
| 38. | Bakersfield | 49 | 9,156(0.54%)#38 | 267,308(0.02%)#629 |
| 39. | Brisbane | 49 | 9,156(0.54%)#39 | 267,308(0.02%)#632 |
| 40. | Corona | 48 | 9,156(0.52%)#40 | 267,308(0.02%)#635 |
| 41. | Suisun City | 47 | 9,156(0.51%)#41 | 267,308(0.02%)#654 |
| 42. | View Park Windsor Hills | 46 | 9,156(0.50%)#42 | 267,308(0.02%)#669 |
| 43. | Yuba City | 45 | 9,156(0.49%)#43 | 267,308(0.02%)#676 |
| 44. | Arcadia | 45 | 9,156(0.49%)#44 | 267,308(0.02%)#678 |
| 45. | Ladera Heights | 44 | 9,156(0.48%)#45 | 267,308(0.02%)#689 |
| 46. | Elk Grove | 41 | 9,156(0.45%)#46 | 267,308(0.02%)#712 |
| 47. | San Mateo | 41 | 9,156(0.45%)#47 | 267,308(0.02%)#713 |
| 48. | San Clemente | 41 | 9,156(0.45%)#48 | 267,308(0.02%)#716 |
| 49. | Upland | 40 | 9,156(0.44%)#49 | 267,308(0.01%)#730 |
| 50. | Lompoc | 40 | 9,156(0.44%)#50 | 267,308(0.01%)#731 |
| 51. | El Cajon | 38 | 9,156(0.42%)#51 | 267,308(0.01%)#756 |
| 52. | Vacaville | 35 | 9,156(0.38%)#52 | 267,308(0.01%)#804 |
| 53. | Scotts Valley | 35 | 9,156(0.38%)#53 | 267,308(0.01%)#813 |
| 54. | Fort Irwin | 35 | 9,156(0.38%)#54 | 267,308(0.01%)#815 |
| 55. | Palo Alto | 34 | 9,156(0.37%)#55 | 267,308(0.01%)#821 |
| 56. | Seaside | 34 | 9,156(0.37%)#56 | 267,308(0.01%)#826 |
| 57. | East Richmond Heights | 34 | 9,156(0.37%)#57 | 267,308(0.01%)#835 |
| 58. | Mountain View | 33 | 9,156(0.36%)#58 | 267,308(0.01%)#839 |
| 59. | Berkeley | 32 | 9,156(0.35%)#59 | 267,308(0.01%)#852 |
| 60. | Mayflower Village | 31 | 9,156(0.34%)#60 | 267,308(0.01%)#883 |
| 61. | Irvine | 30 | 9,156(0.33%)#61 | 267,308(0.01%)#887 |
| 62. | Roseville | 30 | 9,156(0.33%)#62 | 267,308(0.01%)#889 |
| 63. | Sonora | 29 | 9,156(0.32%)#63 | 267,308(0.01%)#931 |
| 64. | Lucas Valley Marinwood | 28 | 9,156(0.31%)#64 | 267,308(0.01%)#950 |
| 65. | Glendale | 27 | 9,156(0.29%)#65 | 267,308(0.01%)#957 |
| 66. | Lancaster | 27 | 9,156(0.29%)#66 | 267,308(0.01%)#958 |
| 67. | San Buenaventura Ventura | 26 | 9,156(0.28%)#67 | 267,308(0.01%)#984 |
| 68. | Florin | 26 | 9,156(0.28%)#68 | 267,308(0.01%)#988 |
| 69. | Fontana | 25 | 9,156(0.27%)#69 | 267,308(0.01%)#1,003 |
| 70. | Fullerton | 25 | 9,156(0.27%)#70 | 267,308(0.01%)#1,005 |
| 71. | Half Moon Bay | 25 | 9,156(0.27%)#71 | 267,308(0.01%)#1,022 |
| 72. | Fremont | 24 | 9,156(0.26%)#72 | 267,308(0.01%)#1,028 |
| 73. | Buena Park | 24 | 9,156(0.26%)#73 | 267,308(0.01%)#1,031 |
| 74. | La Mirada | 24 | 9,156(0.26%)#74 | 267,308(0.01%)#1,036 |
| 75. | Danville | 24 | 9,156(0.26%)#75 | 267,308(0.01%)#1,037 |
| 76. | Bell | 24 | 9,156(0.26%)#76 | 267,308(0.01%)#1,041 |
| 77. | Costa Mesa | 23 | 9,156(0.25%)#77 | 267,308(0.01%)#1,061 |
| 78. | Tracy | 23 | 9,156(0.25%)#78 | 267,308(0.01%)#1,062 |
| 79. | Monterey Park | 23 | 9,156(0.25%)#79 | 267,308(0.01%)#1,066 |
| 80. | Grand Terrace | 23 | 9,156(0.25%)#80 | 267,308(0.01%)#1,078 |
| 81. | Compton | 22 | 9,156(0.24%)#81 | 267,308(0.01%)#1,096 |
| 82. | Rancho Santa Margarita | 22 | 9,156(0.24%)#82 | 267,308(0.01%)#1,102 |
| 83. | San Luis Obispo | 22 | 9,156(0.24%)#83 | 267,308(0.01%)#1,103 |
| 84. | Redding | 21 | 9,156(0.23%)#84 | 267,308(0.01%)#1,123 |
| 85. | Hanford | 21 | 9,156(0.23%)#85 | 267,308(0.01%)#1,126 |
| 86. | Monrovia | 21 | 9,156(0.23%)#86 | 267,308(0.01%)#1,131 |
| 87. | Spring Valley Cdp San Diego County | 21 | 9,156(0.23%)#87 | 267,308(0.01%)#1,132 |
| 88. | Menifee | 20 | 9,156(0.22%)#88 | 267,308(0.01%)#1,150 |
| 89. | Pittsburg | 20 | 9,156(0.22%)#89 | 267,308(0.01%)#1,151 |
| 90. | Colton | 20 | 9,156(0.22%)#90 | 267,308(0.01%)#1,158 |
| 91. | Albany | 20 | 9,156(0.22%)#91 | 267,308(0.01%)#1,168 |
| 92. | Oxnard | 19 | 9,156(0.21%)#92 | 267,308(0.01%)#1,185 |
| 93. | Goleta | 19 | 9,156(0.21%)#93 | 267,308(0.01%)#1,197 |
| 94. | East Los Angeles | 18 | 9,156(0.20%)#94 | 267,308(0.01%)#1,231 |
| 95. | Yucaipa | 18 | 9,156(0.20%)#95 | 267,308(0.01%)#1,235 |
| 96. | Hayward | 17 | 9,156(0.19%)#96 | 267,308(0.01%)#1,272 |
| 97. | Apple Valley | 17 | 9,156(0.19%)#97 | 267,308(0.01%)#1,275 |
| 98. | Morgan Hill | 17 | 9,156(0.19%)#98 | 267,308(0.01%)#1,278 |
| 99. | Hercules | 17 | 9,156(0.19%)#99 | 267,308(0.01%)#1,286 |
| 100. | Country Club | 17 | 9,156(0.19%)#100 | 267,308(0.01%)#1,296 |
Common Questions
What are the Top 10 Cities with the Largest West Indian Community in California?
Top 10 Cities with the Largest West Indian Community in California are:
#1
1,440
#2
440
#3
410
#4
402
#5
238
#6
232
#7
210
#8
204
#9
204
#10
176
What city has the Largest West Indian Community in California?
Los Angeles has the Largest West Indian Community in California with 1,440.
What is the Total West Indian Population in the State of California?
Total West Indian Population in California is 9,156.
What is the Total West Indian Population in the United States?
Total West Indian Population in the United States is 267,308.