Cities with the Highest Percentage of Immigrants from Liberia in California
RELATED REPORTS & OPTIONS
Liberia
California
Compare Cities
Map of Cities with the Highest Percentage of Immigrants from Liberia in California
0.00%
0.60%
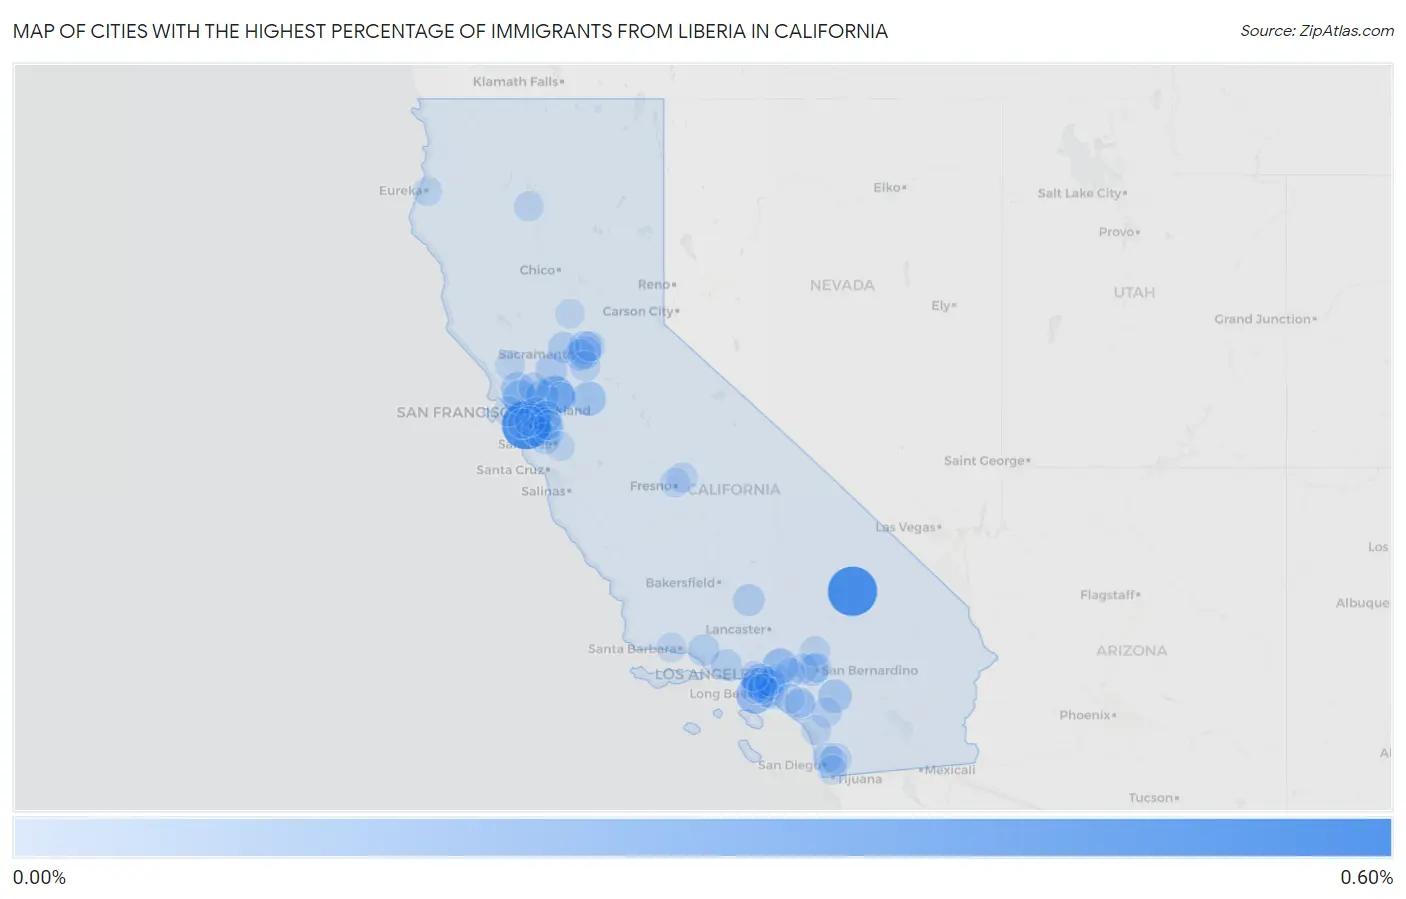
Cities with the Highest Percentage of Immigrants from Liberia in California
| City | Liberia | vs State | vs National | |
| 1. | Fort Irwin | 0.51% | 0.0081%(+0.505)#-1 | 0.030%(+0.483)#0 |
| 2. | Millbrae | 0.49% | 0.0081%(+0.483)#0 | 0.030%(+0.461)#1 |
| 3. | Pittsburg | 0.22% | 0.0081%(+0.210)#107 | 0.030%(+0.189)#992 |
| 4. | Rancho Palos Verdes | 0.20% | 0.0081%(+0.190)#108 | 0.030%(+0.169)#993 |
| 5. | Duarte | 0.15% | 0.0081%(+0.139)#109 | 0.030%(+0.118)#994 |
| 6. | Westmont | 0.12% | 0.0081%(+0.116)#110 | 0.030%(+0.095)#995 |
| 7. | San Rafael | 0.12% | 0.0081%(+0.108)#111 | 0.030%(+0.087)#996 |
| 8. | Stockton | 0.12% | 0.0081%(+0.107)#255 | 0.030%(+0.086)#2,019 |
| 9. | Hemet | 0.095% | 0.0081%(+0.087)#256 | 0.030%(+0.065)#2,020 |
| 10. | Novato | 0.087% | 0.0081%(+0.079)#257 | 0.030%(+0.057)#2,021 |
| 11. | Martinez | 0.084% | 0.0081%(+0.075)#258 | 0.030%(+0.054)#2,022 |
| 12. | North Highlands | 0.083% | 0.0081%(+0.075)#259 | 0.030%(+0.053)#2,023 |
| 13. | Oakland | 0.078% | 0.0081%(+0.070)#260 | 0.030%(+0.048)#2,024 |
| 14. | Arden Arcade | 0.073% | 0.0081%(+0.065)#261 | 0.030%(+0.043)#2,027 |
| 15. | Hayward | 0.068% | 0.0081%(+0.060)#271 | 0.030%(+0.038)#2,117 |
| 16. | Camp Pendleton Mainside | 0.063% | 0.0081%(+0.054)#272 | 0.030%(+0.033)#2,118 |
| 17. | Rialto | 0.062% | 0.0081%(+0.053)#273 | 0.030%(+0.032)#2,119 |
| 18. | Vacaville | 0.061% | 0.0081%(+0.053)#274 | 0.030%(+0.031)#2,120 |
| 19. | Tehachapi | 0.054% | 0.0081%(+0.046)#275 | 0.030%(+0.025)#2,121 |
| 20. | Willowbrook | 0.053% | 0.0081%(+0.045)#276 | 0.030%(+0.024)#2,122 |
| 21. | Hawthorne | 0.048% | 0.0081%(+0.040)#277 | 0.030%(+0.019)#2,123 |
| 22. | Sacramento | 0.047% | 0.0081%(+0.038)#278 | 0.030%(+0.017)#2,124 |
| 23. | Oak View | 0.046% | 0.0081%(+0.038)#279 | 0.030%(+0.017)#2,125 |
| 24. | Woodland | 0.046% | 0.0081%(+0.038)#280 | 0.030%(+0.016)#2,126 |
| 25. | La Canada Flintridge | 0.039% | 0.0081%(+0.031)#281 | 0.030%(+0.010)#2,127 |
| 26. | Thousand Oaks | 0.039% | 0.0081%(+0.031)#282 | 0.030%(+0.009)#2,128 |
| 27. | Castro Valley | 0.035% | 0.0081%(+0.027)#283 | 0.030%(+0.005)#2,129 |
| 28. | Coto De Caza | 0.032% | 0.0081%(+0.024)#284 | 0.030%(+0.002)#2,130 |
| 29. | Bellflower | 0.032% | 0.0081%(+0.024)#285 | 0.030%(+0.002)#2,131 |
| 30. | Fremont | 0.031% | 0.0081%(+0.023)#286 | 0.030%(+0.002)#2,132 |
| 31. | Mountain View | 0.029% | 0.0081%(+0.021)#287 | 0.030%(-0.001)#2,133 |
| 32. | Seal Beach | 0.028% | 0.0081%(+0.020)#288 | 0.030%(-0.002)#2,134 |
| 33. | El Cajon | 0.027% | 0.0081%(+0.019)#289 | 0.030%(-0.002)#2,135 |
| 34. | Antioch | 0.024% | 0.0081%(+0.016)#290 | 0.030%(-0.005)#2,136 |
| 35. | Redwood City | 0.020% | 0.0081%(+0.012)#291 | 0.030%(-0.009)#2,137 |
| 36. | Vallejo | 0.018% | 0.0081%(+0.010)#292 | 0.030%(-0.011)#2,138 |
| 37. | Clovis | 0.017% | 0.0081%(+0.009)#293 | 0.030%(-0.012)#2,139 |
| 38. | Whittier | 0.016% | 0.0081%(+0.008)#294 | 0.030%(-0.014)#2,140 |
| 39. | Rancho Cucamonga | 0.015% | 0.0081%(+0.007)#295 | 0.030%(-0.014)#2,141 |
| 40. | Rancho Santa Margarita | 0.015% | 0.0081%(+0.007)#296 | 0.030%(-0.015)#2,142 |
| 41. | Hesperia | 0.014% | 0.0081%(+0.006)#297 | 0.030%(-0.016)#2,143 |
| 42. | Elk Grove | 0.013% | 0.0081%(+0.005)#298 | 0.030%(-0.017)#2,144 |
| 43. | San Francisco | 0.013% | 0.0081%(+0.005)#299 | 0.030%(-0.017)#2,145 |
| 44. | Temecula | 0.013% | 0.0081%(+0.005)#300 | 0.030%(-0.017)#2,146 |
| 45. | Long Beach | 0.011% | 0.0081%(+0.003)#301 | 0.030%(-0.018)#2,147 |
| 46. | Torrance | 0.011% | 0.0081%(+0.003)#302 | 0.030%(-0.019)#2,148 |
| 47. | Oceanside | 0.0098% | 0.0081%(+0.002)#303 | 0.030%(-0.020)#2,149 |
| 48. | Santa Rosa | 0.0095% | 0.0081%(+0.001)#304 | 0.030%(-0.020)#2,150 |
| 49. | San Diego | 0.0094% | 0.0081%(+0.001)#305 | 0.030%(-0.020)#2,151 |
| 50. | Citrus Heights | 0.0092% | 0.0081%(+0.001)#306 | 0.030%(-0.021)#2,152 |
| 51. | Redding | 0.0086% | 0.0081%(+0.000)#307 | 0.030%(-0.021)#2,153 |
| 52. | San Bernardino | 0.0077% | 0.0081%(-0.000)#308 | 0.030%(-0.022)#2,154 |
| 53. | Downey | 0.0062% | 0.0081%(-0.002)#309 | 0.030%(-0.024)#2,155 |
| 54. | Fresno | 0.0052% | 0.0081%(-0.003)#310 | 0.030%(-0.025)#2,156 |
| 55. | Los Angeles | 0.0051% | 0.0081%(-0.003)#311 | 0.030%(-0.025)#2,157 |
| 56. | Eureka | 0.0038% | 0.0081%(-0.004)#312 | 0.030%(-0.026)#2,158 |
| 57. | Pomona | 0.0033% | 0.0081%(-0.005)#313 | 0.030%(-0.026)#2,159 |
| 58. | Goleta | 0.0031% | 0.0081%(-0.005)#314 | 0.030%(-0.027)#2,160 |
| 59. | South San Francisco | 0.0030% | 0.0081%(-0.005)#315 | 0.030%(-0.027)#2,161 |
| 60. | Pacifica | 0.0026% | 0.0081%(-0.006)#316 | 0.030%(-0.027)#2,162 |
| 61. | Irvine | 0.0023% | 0.0081%(-0.006)#317 | 0.030%(-0.027)#2,163 |
| 62. | La Mesa | 0.0016% | 0.0081%(-0.006)#318 | 0.030%(-0.028)#2,164 |
| 63. | Yuba City | 0.0014% | 0.0081%(-0.007)#319 | 0.030%(-0.028)#2,165 |
| 64. | Union City | 0.0014% | 0.0081%(-0.007)#320 | 0.030%(-0.028)#2,166 |
| 65. | Carson | 0.0011% | 0.0081%(-0.007)#321 | 0.030%(-0.029)#2,167 |
| 66. | San Jose | 0.00070% | 0.0081%(-0.007)#322 | 0.030%(-0.029)#2,168 |
| 67. | Chula Vista | 0.00036% | 0.0081%(-0.008)#323 | 0.030%(-0.029)#2,169 |
Common Questions
What are the Top 10 Cities with the Highest Percentage of Immigrants from Liberia in California?
Top 10 Cities with the Highest Percentage of Immigrants from Liberia in California are:
#1
0.51%
#2
0.49%
#3
0.22%
#4
0.20%
#5
0.15%
#6
0.12%
#7
0.12%
#8
0.12%
#9
0.095%
#10
0.087%
What city has the Highest Percentage of Immigrants from Liberia in California?
Fort Irwin has the Highest Percentage of Immigrants from Liberia in California with 0.51%.
What is the Percentage of Immigrants from Liberia in the State of California?
Percentage of Immigrants from Liberia in California is 0.0081%.
What is the Percentage of Immigrants from Liberia in the United States?
Percentage of Immigrants from Liberia in the United States is 0.030%.