Cities with the Highest Percentage of Zimbabwean Population in California
RELATED REPORTS & OPTIONS
Zimbabwean
California
Compare Cities
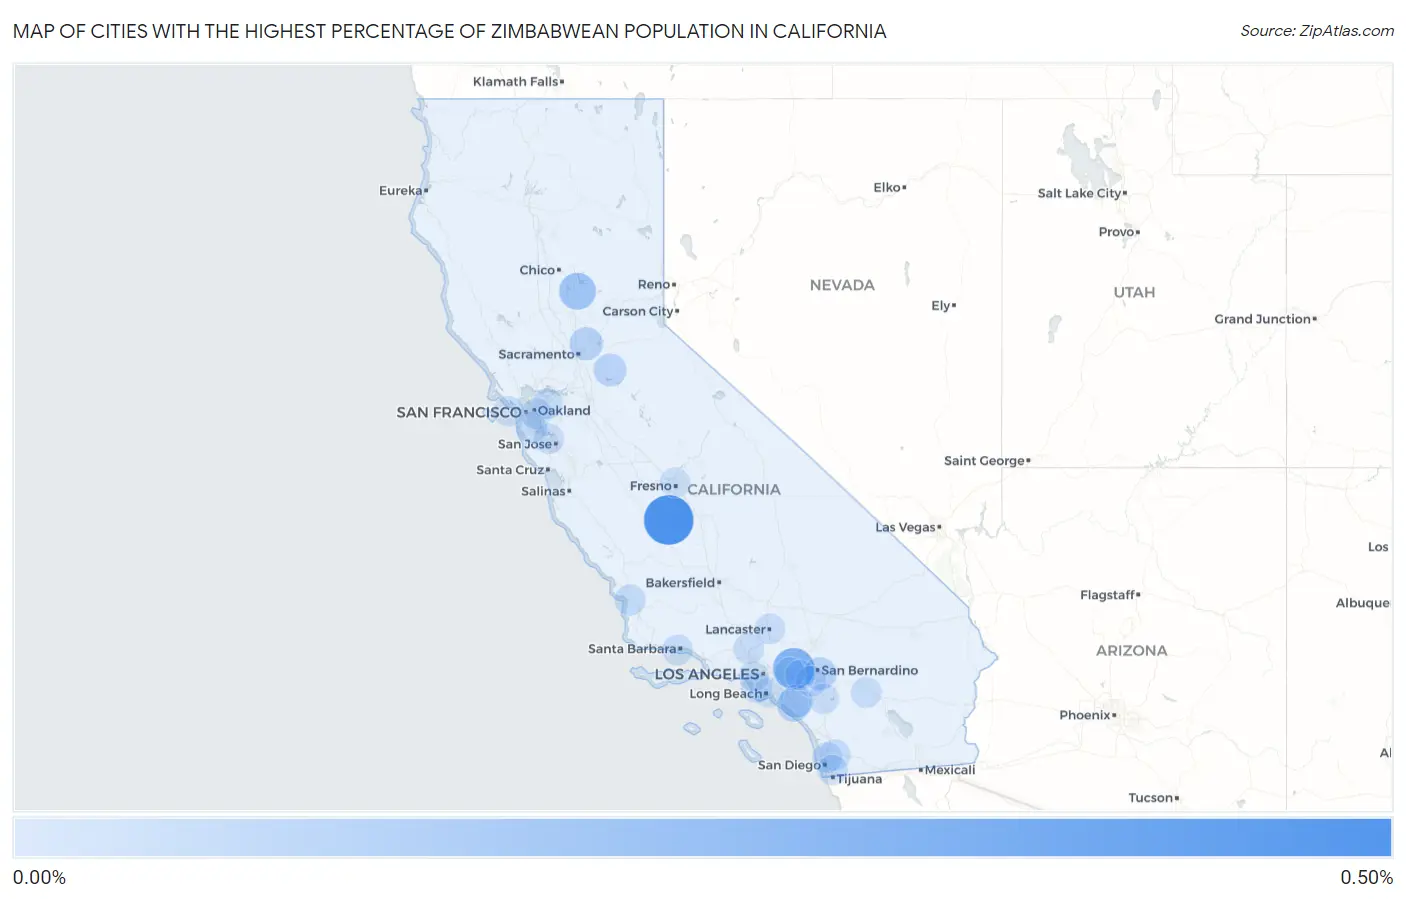
Map of Cities with the Highest Percentage of Zimbabwean Population in California
0.00%
0.50%
Cities with the Highest Percentage of Zimbabwean Population in California
| City | Zimbabwean | vs State | vs National | |
| 1. | Lemoore Station | 0.44% | 0.0020%(+0.435)#1 | 0.0038%(+0.433)#25 |
| 2. | Claremont | 0.25% | 0.0020%(+0.247)#2 | 0.0038%(+0.246)#32 |
| 3. | Pepperdine University | 0.15% | 0.0020%(+0.144)#3 | 0.0038%(+0.142)#65 |
| 4. | Palermo | 0.15% | 0.0020%(+0.143)#4 | 0.0038%(+0.141)#68 |
| 5. | Laguna Hills | 0.067% | 0.0020%(+0.065)#5 | 0.0038%(+0.064)#99 |
| 6. | Antelope | 0.067% | 0.0020%(+0.065)#6 | 0.0038%(+0.063)#100 |
| 7. | Loma Linda | 0.064% | 0.0020%(+0.062)#7 | 0.0038%(+0.060)#105 |
| 8. | Lake Forest | 0.062% | 0.0020%(+0.060)#8 | 0.0038%(+0.058)#106 |
| 9. | Ione | 0.056% | 0.0020%(+0.054)#9 | 0.0038%(+0.052)#111 |
| 10. | Santee | 0.024% | 0.0020%(+0.022)#10 | 0.0038%(+0.020)#164 |
| 11. | Arroyo Grande | 0.022% | 0.0020%(+0.020)#11 | 0.0038%(+0.018)#171 |
| 12. | Santa Clarita | 0.016% | 0.0020%(+0.014)#12 | 0.0038%(+0.013)#188 |
| 13. | Oakland | 0.016% | 0.0020%(+0.014)#13 | 0.0038%(+0.012)#189 |
| 14. | Walnut Creek | 0.016% | 0.0020%(+0.014)#14 | 0.0038%(+0.012)#191 |
| 15. | Redondo Beach | 0.016% | 0.0020%(+0.014)#15 | 0.0038%(+0.012)#192 |
| 16. | Santa Barbara | 0.015% | 0.0020%(+0.013)#16 | 0.0038%(+0.011)#195 |
| 17. | San Mateo | 0.014% | 0.0020%(+0.012)#17 | 0.0038%(+0.011)#199 |
| 18. | Rancho Mirage | 0.012% | 0.0020%(+0.010)#18 | 0.0038%(+0.008)#213 |
| 19. | Riverside | 0.0098% | 0.0020%(+0.008)#19 | 0.0038%(+0.006)#224 |
| 20. | Lancaster | 0.0093% | 0.0020%(+0.007)#20 | 0.0038%(+0.005)#229 |
| 21. | Sunnyvale | 0.0091% | 0.0020%(+0.007)#21 | 0.0038%(+0.005)#233 |
| 22. | San Diego | 0.0072% | 0.0020%(+0.005)#22 | 0.0038%(+0.003)#238 |
| 23. | Chula Vista | 0.0065% | 0.0020%(+0.004)#23 | 0.0038%(+0.003)#244 |
| 24. | San Francisco | 0.0053% | 0.0020%(+0.003)#24 | 0.0038%(+0.001)#250 |
| 25. | Menifee | 0.0048% | 0.0020%(+0.003)#25 | 0.0038%(+0.001)#253 |
| 26. | Long Beach | 0.0041% | 0.0020%(+0.002)#26 | 0.0038%(+0.000)#259 |
| 27. | Fresno | 0.0037% | 0.0020%(+0.002)#27 | 0.0038%(-0.000)#266 |
| 28. | Pomona | 0.0027% | 0.0020%(+0.001)#28 | 0.0038%(-0.001)#271 |
| 29. | Los Angeles | 0.0020% | 0.0020%(+0.000)#29 | 0.0038%(-0.002)#279 |
| 30. | Ontario | 0.00057% | 0.0020%(-0.001)#30 | 0.0038%(-0.003)#287 |
Common Questions
What are the Top 10 Cities with the Highest Percentage of Zimbabwean Population in California?
Top 10 Cities with the Highest Percentage of Zimbabwean Population in California are:
#1
0.44%
#2
0.25%
#3
0.15%
#4
0.067%
#5
0.067%
#6
0.064%
#7
0.062%
#8
0.056%
#9
0.024%
#10
0.022%
What city has the Highest Percentage of Zimbabwean Population in California?
Lemoore Station has the Highest Percentage of Zimbabwean Population in California with 0.44%.
What is the Percentage of Zimbabwean Population in the State of California?
Percentage of Zimbabwean Population in California is 0.0020%.
What is the Percentage of Zimbabwean Population in the United States?
Percentage of Zimbabwean Population in the United States is 0.0038%.