Cities with the Most Immigrants from Pakistan in California
RELATED REPORTS & OPTIONS
Pakistan
California
Compare Cities
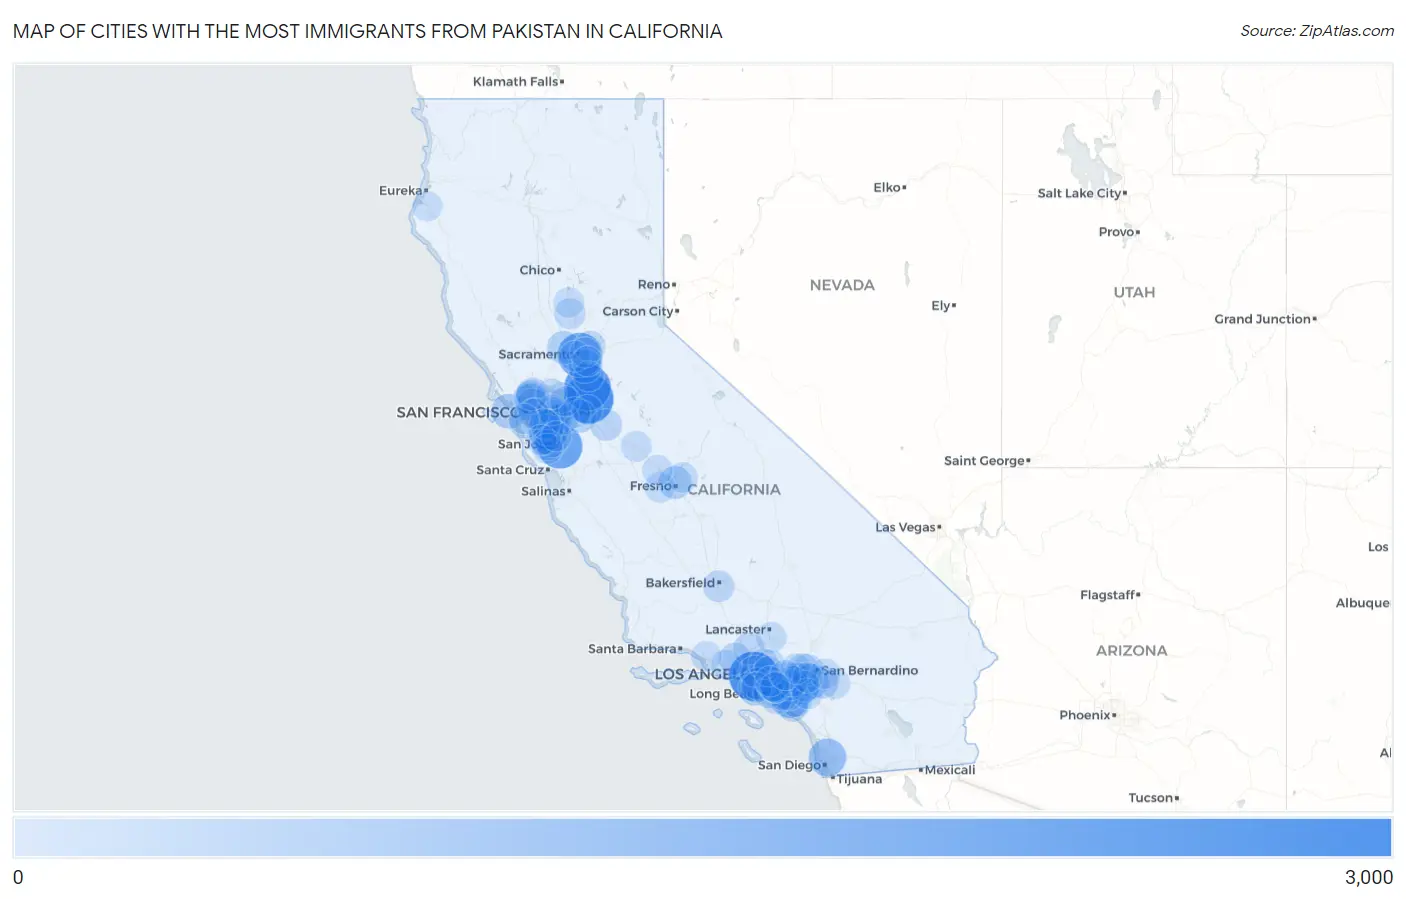
Map of Cities with the Most Immigrants from Pakistan in California
0
3,000
Cities with the Most Immigrants from Pakistan in California
| City | Pakistan | vs State | vs National | |
| 1. | Stockton | 2,913 | 49,399(5.90%)#1 | 393,877(0.74%)#6 |
| 2. | Los Angeles | 2,873 | 49,399(5.82%)#2 | 393,877(0.73%)#7 |
| 3. | Lodi | 2,462 | 49,399(4.98%)#3 | 393,877(0.63%)#10 |
| 4. | San Jose | 2,202 | 49,399(4.46%)#4 | 393,877(0.56%)#12 |
| 5. | Sacramento | 2,145 | 49,399(4.34%)#5 | 393,877(0.54%)#13 |
| 6. | Fremont | 1,528 | 49,399(3.09%)#6 | 393,877(0.39%)#19 |
| 7. | Irvine | 1,242 | 49,399(2.51%)#7 | 393,877(0.32%)#23 |
| 8. | San Diego | 1,162 | 49,399(2.35%)#8 | 393,877(0.30%)#26 |
| 9. | Riverside | 747 | 49,399(1.51%)#9 | 393,877(0.19%)#50 |
| 10. | San Francisco | 745 | 49,399(1.51%)#10 | 393,877(0.19%)#52 |
| 11. | Corona | 726 | 49,399(1.47%)#11 | 393,877(0.18%)#57 |
| 12. | Anaheim | 659 | 49,399(1.33%)#12 | 393,877(0.17%)#62 |
| 13. | Eastvale | 620 | 49,399(1.26%)#13 | 393,877(0.16%)#71 |
| 14. | Torrance | 595 | 49,399(1.20%)#14 | 393,877(0.15%)#77 |
| 15. | Richmond | 595 | 49,399(1.20%)#15 | 393,877(0.15%)#78 |
| 16. | San Ramon | 587 | 49,399(1.19%)#16 | 393,877(0.15%)#80 |
| 17. | Elk Grove | 579 | 49,399(1.17%)#17 | 393,877(0.15%)#84 |
| 18. | Woodland | 534 | 49,399(1.08%)#18 | 393,877(0.14%)#91 |
| 19. | Fresno | 515 | 49,399(1.04%)#19 | 393,877(0.13%)#94 |
| 20. | Tracy | 473 | 49,399(0.96%)#20 | 393,877(0.12%)#107 |
| 21. | Simi Valley | 410 | 49,399(0.83%)#21 | 393,877(0.10%)#129 |
| 22. | Berkeley | 408 | 49,399(0.83%)#22 | 393,877(0.10%)#131 |
| 23. | Sunnyvale | 404 | 49,399(0.82%)#23 | 393,877(0.10%)#132 |
| 24. | Dublin | 400 | 49,399(0.81%)#24 | 393,877(0.10%)#134 |
| 25. | Hercules | 389 | 49,399(0.79%)#25 | 393,877(0.10%)#144 |
| 26. | Pleasanton | 376 | 49,399(0.76%)#26 | 393,877(0.10%)#151 |
| 27. | Moreno Valley | 374 | 49,399(0.76%)#27 | 393,877(0.09%)#152 |
| 28. | Norwalk | 372 | 49,399(0.75%)#28 | 393,877(0.09%)#154 |
| 29. | Santa Clara | 366 | 49,399(0.74%)#29 | 393,877(0.09%)#159 |
| 30. | Union City | 363 | 49,399(0.73%)#30 | 393,877(0.09%)#161 |
| 31. | Livermore | 362 | 49,399(0.73%)#31 | 393,877(0.09%)#162 |
| 32. | Garden Grove | 357 | 49,399(0.72%)#32 | 393,877(0.09%)#163 |
| 33. | Modesto | 346 | 49,399(0.70%)#33 | 393,877(0.09%)#176 |
| 34. | Fontana | 345 | 49,399(0.70%)#34 | 393,877(0.09%)#177 |
| 35. | San Bruno | 324 | 49,399(0.66%)#35 | 393,877(0.08%)#190 |
| 36. | Bakersfield | 309 | 49,399(0.63%)#36 | 393,877(0.08%)#201 |
| 37. | Santa Clarita | 295 | 49,399(0.60%)#37 | 393,877(0.07%)#214 |
| 38. | Hawthorne | 292 | 49,399(0.59%)#38 | 393,877(0.07%)#220 |
| 39. | Beverly Hills | 280 | 49,399(0.57%)#39 | 393,877(0.07%)#231 |
| 40. | Lake Forest | 275 | 49,399(0.56%)#40 | 393,877(0.07%)#238 |
| 41. | Chino | 261 | 49,399(0.53%)#41 | 393,877(0.07%)#246 |
| 42. | Mountain View | 258 | 49,399(0.52%)#42 | 393,877(0.07%)#249 |
| 43. | Oakland | 250 | 49,399(0.51%)#43 | 393,877(0.06%)#253 |
| 44. | Newark | 250 | 49,399(0.51%)#44 | 393,877(0.06%)#254 |
| 45. | Citrus Heights | 248 | 49,399(0.50%)#45 | 393,877(0.06%)#257 |
| 46. | Aliso Viejo | 248 | 49,399(0.50%)#46 | 393,877(0.06%)#259 |
| 47. | Yuba City | 243 | 49,399(0.49%)#47 | 393,877(0.06%)#266 |
| 48. | Tustin | 238 | 49,399(0.48%)#48 | 393,877(0.06%)#275 |
| 49. | Long Beach | 210 | 49,399(0.43%)#49 | 393,877(0.05%)#323 |
| 50. | Artesia | 210 | 49,399(0.43%)#50 | 393,877(0.05%)#325 |
| 51. | Santa Ana | 209 | 49,399(0.42%)#51 | 393,877(0.05%)#327 |
| 52. | Diamond Bar | 208 | 49,399(0.42%)#52 | 393,877(0.05%)#331 |
| 53. | Yorba Linda | 206 | 49,399(0.42%)#53 | 393,877(0.05%)#334 |
| 54. | Antioch | 200 | 49,399(0.40%)#54 | 393,877(0.05%)#342 |
| 55. | Huntington Beach | 190 | 49,399(0.38%)#55 | 393,877(0.05%)#362 |
| 56. | Rancho Cucamonga | 190 | 49,399(0.38%)#56 | 393,877(0.05%)#363 |
| 57. | West Sacramento | 190 | 49,399(0.38%)#57 | 393,877(0.05%)#365 |
| 58. | San Pablo | 183 | 49,399(0.37%)#58 | 393,877(0.05%)#381 |
| 59. | Pinole | 182 | 49,399(0.37%)#59 | 393,877(0.05%)#382 |
| 60. | Home Gardens | 181 | 49,399(0.37%)#60 | 393,877(0.05%)#384 |
| 61. | Clovis | 179 | 49,399(0.36%)#61 | 393,877(0.05%)#389 |
| 62. | Merced | 179 | 49,399(0.36%)#62 | 393,877(0.05%)#390 |
| 63. | Buena Park | 178 | 49,399(0.36%)#63 | 393,877(0.05%)#394 |
| 64. | Danville | 176 | 49,399(0.36%)#64 | 393,877(0.04%)#404 |
| 65. | Palmdale | 172 | 49,399(0.35%)#65 | 393,877(0.04%)#414 |
| 66. | Chino Hills | 169 | 49,399(0.34%)#66 | 393,877(0.04%)#424 |
| 67. | El Sobrante Cdp Contra Costa County | 169 | 49,399(0.34%)#67 | 393,877(0.04%)#428 |
| 68. | Live Oak | 169 | 49,399(0.34%)#68 | 393,877(0.04%)#429 |
| 69. | Pasadena | 163 | 49,399(0.33%)#69 | 393,877(0.04%)#438 |
| 70. | Mountain House | 163 | 49,399(0.33%)#70 | 393,877(0.04%)#439 |
| 71. | Kerman | 158 | 49,399(0.32%)#71 | 393,877(0.04%)#457 |
| 72. | Thousand Oaks | 152 | 49,399(0.31%)#72 | 393,877(0.04%)#469 |
| 73. | Hayward | 150 | 49,399(0.30%)#73 | 393,877(0.04%)#473 |
| 74. | Madera | 149 | 49,399(0.30%)#74 | 393,877(0.04%)#477 |
| 75. | Alameda | 148 | 49,399(0.30%)#75 | 393,877(0.04%)#479 |
| 76. | Temescal Valley | 148 | 49,399(0.30%)#76 | 393,877(0.04%)#482 |
| 77. | Cerritos | 145 | 49,399(0.29%)#77 | 393,877(0.04%)#488 |
| 78. | San Buenaventura Ventura | 142 | 49,399(0.29%)#78 | 393,877(0.04%)#494 |
| 79. | Upland | 140 | 49,399(0.28%)#79 | 393,877(0.04%)#501 |
| 80. | Daly City | 139 | 49,399(0.28%)#80 | 393,877(0.04%)#506 |
| 81. | Cupertino | 139 | 49,399(0.28%)#81 | 393,877(0.04%)#507 |
| 82. | Bay Point | 136 | 49,399(0.28%)#82 | 393,877(0.03%)#517 |
| 83. | Palo Alto | 135 | 49,399(0.27%)#83 | 393,877(0.03%)#520 |
| 84. | Galt | 134 | 49,399(0.27%)#84 | 393,877(0.03%)#522 |
| 85. | Redlands | 132 | 49,399(0.27%)#85 | 393,877(0.03%)#529 |
| 86. | Glendale | 129 | 49,399(0.26%)#86 | 393,877(0.03%)#539 |
| 87. | Beaumont | 129 | 49,399(0.26%)#87 | 393,877(0.03%)#540 |
| 88. | Arden Arcade | 122 | 49,399(0.25%)#88 | 393,877(0.03%)#559 |
| 89. | Redondo Beach | 121 | 49,399(0.24%)#89 | 393,877(0.03%)#566 |
| 90. | Jurupa Valley | 120 | 49,399(0.24%)#90 | 393,877(0.03%)#572 |
| 91. | Alhambra | 118 | 49,399(0.24%)#91 | 393,877(0.03%)#584 |
| 92. | Brentwood | 117 | 49,399(0.24%)#92 | 393,877(0.03%)#588 |
| 93. | Downey | 116 | 49,399(0.23%)#93 | 393,877(0.03%)#593 |
| 94. | La Palma | 116 | 49,399(0.23%)#94 | 393,877(0.03%)#594 |
| 95. | Saratoga | 115 | 49,399(0.23%)#95 | 393,877(0.03%)#599 |
| 96. | Fortuna | 115 | 49,399(0.23%)#96 | 393,877(0.03%)#601 |
| 97. | Milpitas | 114 | 49,399(0.23%)#97 | 393,877(0.03%)#604 |
| 98. | Vineyard | 113 | 49,399(0.23%)#98 | 393,877(0.03%)#609 |
| 99. | Walnut | 111 | 49,399(0.22%)#99 | 393,877(0.03%)#615 |
| 100. | Lathrop | 110 | 49,399(0.22%)#100 | 393,877(0.03%)#617 |
Common Questions
What are the Top 10 Cities with the Most Immigrants from Pakistan in California?
Top 10 Cities with the Most Immigrants from Pakistan in California are:
#1
2,913
#2
2,873
#3
2,462
#4
2,202
#5
2,145
#6
1,528
#7
1,242
#8
1,162
#9
747
#10
745
What city has the Most Immigrants from Pakistan in California?
Stockton has the Most Immigrants from Pakistan in California with 2,913.
What is the Total Immigrants from Pakistan in the State of California?
Total Immigrants from Pakistan in California is 49,399.
What is the Total Immigrants from Pakistan in the United States?
Total Immigrants from Pakistan in the United States is 393,877.