Alpine Village, CA Map & Demographics
Alpine Village Map
Alpine Village Overview
$47,888
PER CAPITA INCOME
$106,250
AVG FAMILY INCOME
$68,333
AVG HOUSEHOLD INCOME
81.4%
WAGE / INCOME GAP [ % ]
18.6¢/ $1
WAGE / INCOME GAP [ $ ]
0.55
INEQUALITY / GINI INDEX
220
TOTAL POPULATION
149
MALE POPULATION
71
FEMALE POPULATION
209.86
MALES / 100 FEMALES
47.65
FEMALES / 100 MALES
56.7
MEDIAN AGE
3.5
AVG FAMILY SIZE
2.4
AVG HOUSEHOLD SIZE
113
LABOR FORCE [ PEOPLE ]
52.3%
PERCENT IN LABOR FORCE
4.4%
UNEMPLOYMENT RATE
Income in Alpine Village
Income Overview in Alpine Village
Per Capita Income in Alpine Village is $47,888, while median incomes of families and households are $106,250 and $68,333 respectively.
| Characteristic | Number | Measure |
| Per Capita Income | 220 | $47,888 |
| Median Family Income | 39 | $106,250 |
| Mean Family Income | 39 | $166,695 |
| Median Household Income | 92 | $68,333 |
| Mean Household Income | 92 | $112,807 |
| Income Deficit | 39 | $0 |
| Wage / Income Gap (%) | 220 | 81.38% |
| Wage / Income Gap ($) | 220 | 18.62¢ per $1 |
| Gini / Inequality Index | 220 | 0.55 |
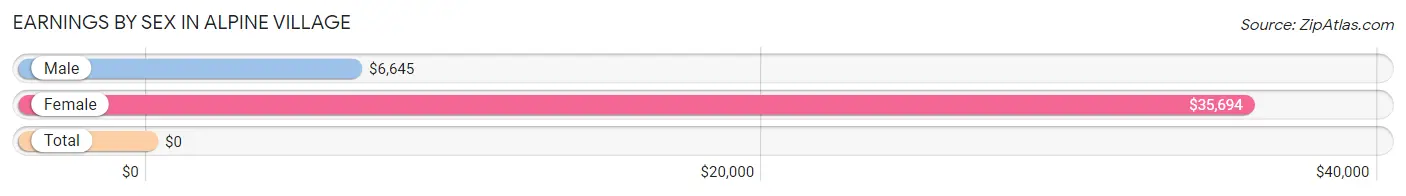
Earnings by Sex in Alpine Village
| Sex | Number | Average Earnings |
| Male | 91 (65.0%) | $6,645 |
| Female | 49 (35.0%) | $35,694 |
| Total | 140 (100.0%) | $0 |
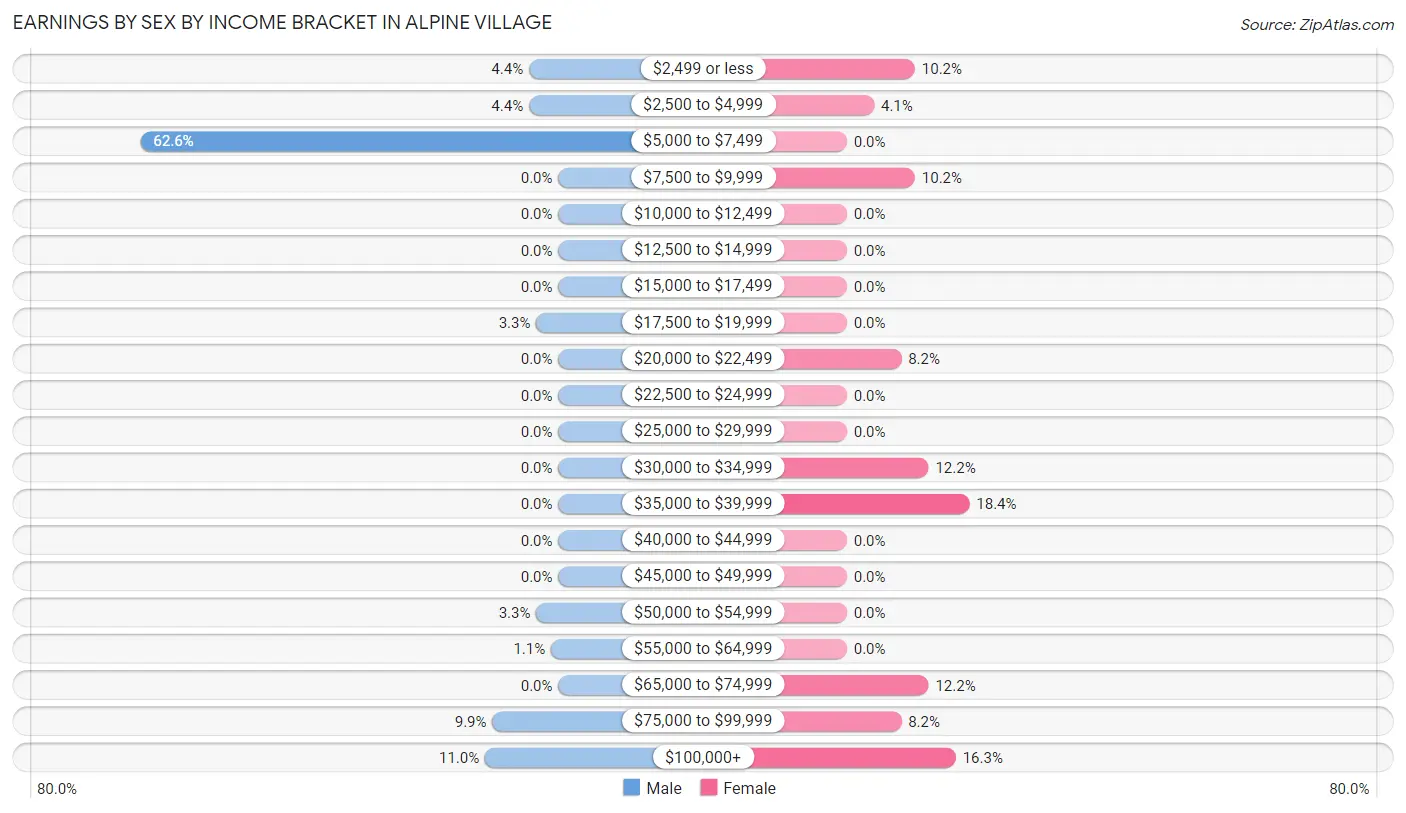
Earnings by Sex by Income Bracket in Alpine Village
The most common earnings brackets in Alpine Village are $5,000 to $7,499 for men (57 | 62.6%) and $35,000 to $39,999 for women (9 | 18.4%).
| Income | Male | Female |
| $2,499 or less | 4 (4.4%) | 5 (10.2%) |
| $2,500 to $4,999 | 4 (4.4%) | 2 (4.1%) |
| $5,000 to $7,499 | 57 (62.6%) | 0 (0.0%) |
| $7,500 to $9,999 | 0 (0.0%) | 5 (10.2%) |
| $10,000 to $12,499 | 0 (0.0%) | 0 (0.0%) |
| $12,500 to $14,999 | 0 (0.0%) | 0 (0.0%) |
| $15,000 to $17,499 | 0 (0.0%) | 0 (0.0%) |
| $17,500 to $19,999 | 3 (3.3%) | 0 (0.0%) |
| $20,000 to $22,499 | 0 (0.0%) | 4 (8.2%) |
| $22,500 to $24,999 | 0 (0.0%) | 0 (0.0%) |
| $25,000 to $29,999 | 0 (0.0%) | 0 (0.0%) |
| $30,000 to $34,999 | 0 (0.0%) | 6 (12.2%) |
| $35,000 to $39,999 | 0 (0.0%) | 9 (18.4%) |
| $40,000 to $44,999 | 0 (0.0%) | 0 (0.0%) |
| $45,000 to $49,999 | 0 (0.0%) | 0 (0.0%) |
| $50,000 to $54,999 | 3 (3.3%) | 0 (0.0%) |
| $55,000 to $64,999 | 1 (1.1%) | 0 (0.0%) |
| $65,000 to $74,999 | 0 (0.0%) | 6 (12.2%) |
| $75,000 to $99,999 | 9 (9.9%) | 4 (8.2%) |
| $100,000+ | 10 (11.0%) | 8 (16.3%) |
| Total | 91 (100.0%) | 49 (100.0%) |
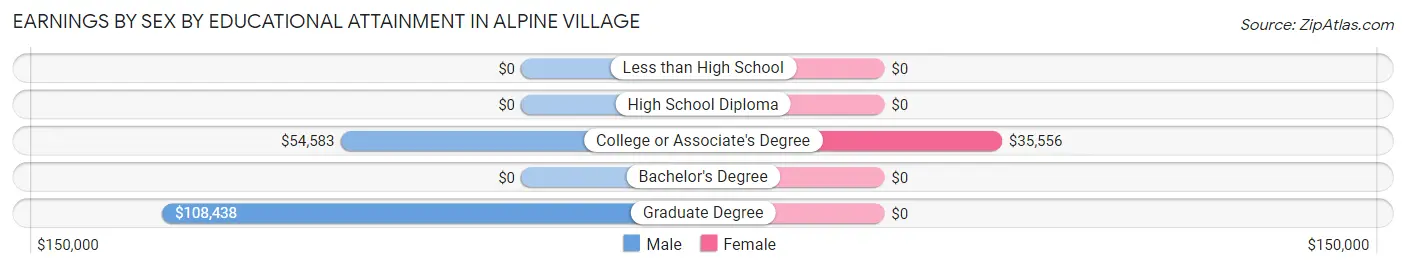
Earnings by Sex by Educational Attainment in Alpine Village
| Educational Attainment | Male Income | Female Income |
| Less than High School | - | - |
| High School Diploma | - | - |
| College or Associate's Degree | $54,583 | $35,556 |
| Bachelor's Degree | - | - |
| Graduate Degree | $108,438 | $0 |
| Total | - | - |
Family Income in Alpine Village
Family Income Brackets in Alpine Village
According to the Alpine Village family income data, there are 10 families falling into the $100,000 to $149,999 income range, which is the most common income bracket and makes up 25.6% of all families.
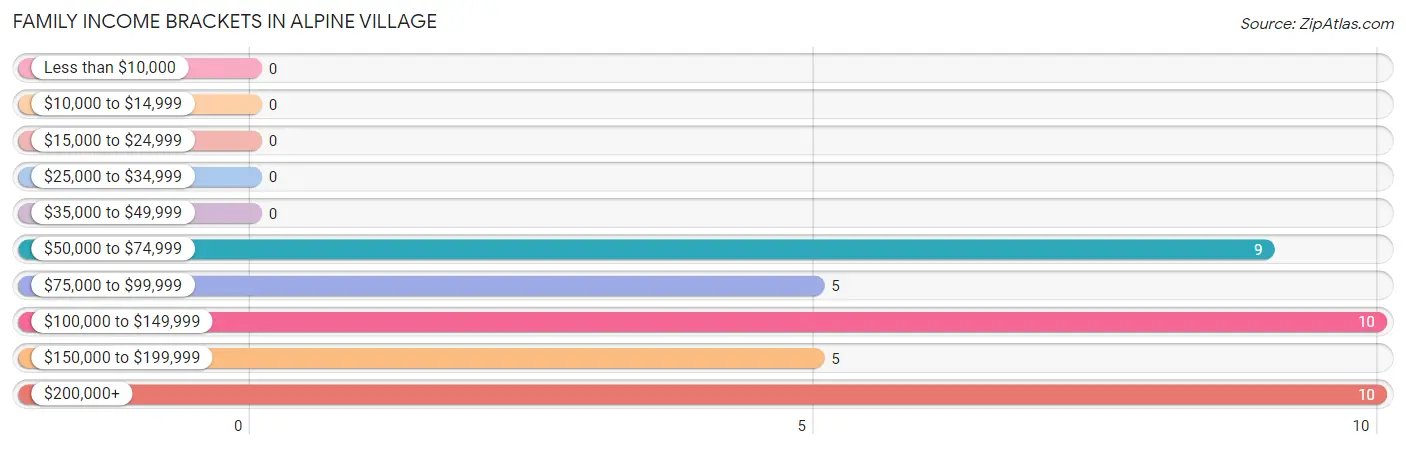
| Income Bracket | # Families | % Families |
| Less than $10,000 | 0 | 0.0% |
| $10,000 to $14,999 | 0 | 0.0% |
| $15,000 to $24,999 | 0 | 0.0% |
| $25,000 to $34,999 | 0 | 0.0% |
| $35,000 to $49,999 | 0 | 0.0% |
| $50,000 to $74,999 | 9 | 23.1% |
| $75,000 to $99,999 | 5 | 12.8% |
| $100,000 to $149,999 | 10 | 25.6% |
| $150,000 to $199,999 | 5 | 12.8% |
| $200,000+ | 10 | 25.6% |
Family Income by Famaliy Size in Alpine Village
2-person families (34 | 87.2%) account for the highest median family income in Alpine Village with $104,167 per family, while 2-person families (34 | 87.2%) have the highest median income of $52,084 per family member.
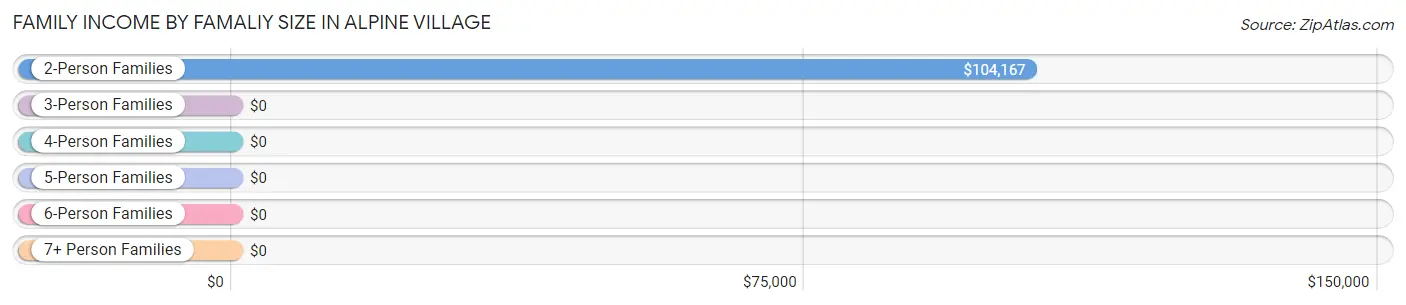
| Income Bracket | # Families | Median Income |
| 2-Person Families | 34 (87.2%) | $104,167 |
| 3-Person Families | 0 (0.0%) | $0 |
| 4-Person Families | 5 (12.8%) | $0 |
| 5-Person Families | 0 (0.0%) | $0 |
| 6-Person Families | 0 (0.0%) | $0 |
| 7+ Person Families | 0 (0.0%) | $0 |
| Total | 39 (100.0%) | $106,250 |
Family Income by Number of Earners in Alpine Village
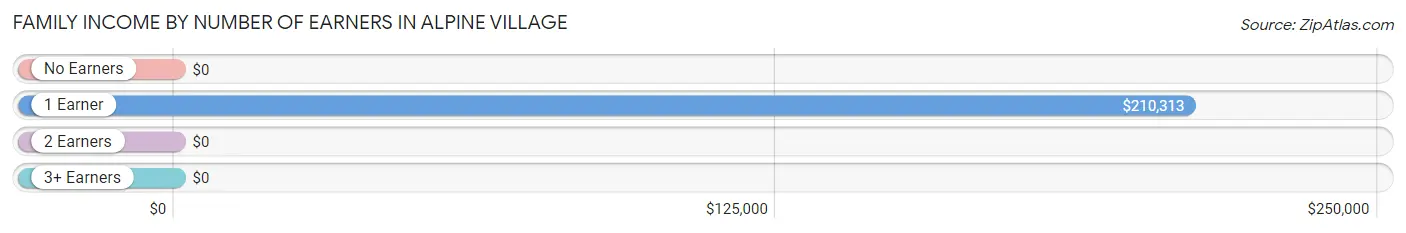
| Number of Earners | # Families | Median Income |
| No Earners | 8 (20.5%) | $0 |
| 1 Earner | 13 (33.3%) | $210,313 |
| 2 Earners | 13 (33.3%) | $0 |
| 3+ Earners | 5 (12.8%) | $0 |
| Total | 39 (100.0%) | $106,250 |
Household Income in Alpine Village
Household Income Brackets in Alpine Village
With 14 households falling in the category, the $100,000 to $149,999 income range is the most frequent in Alpine Village, accounting for 15.2% of all households. In contrast, only 3 households (3.3%) fall into the less than $10,000 income bracket, making it the least populous group.
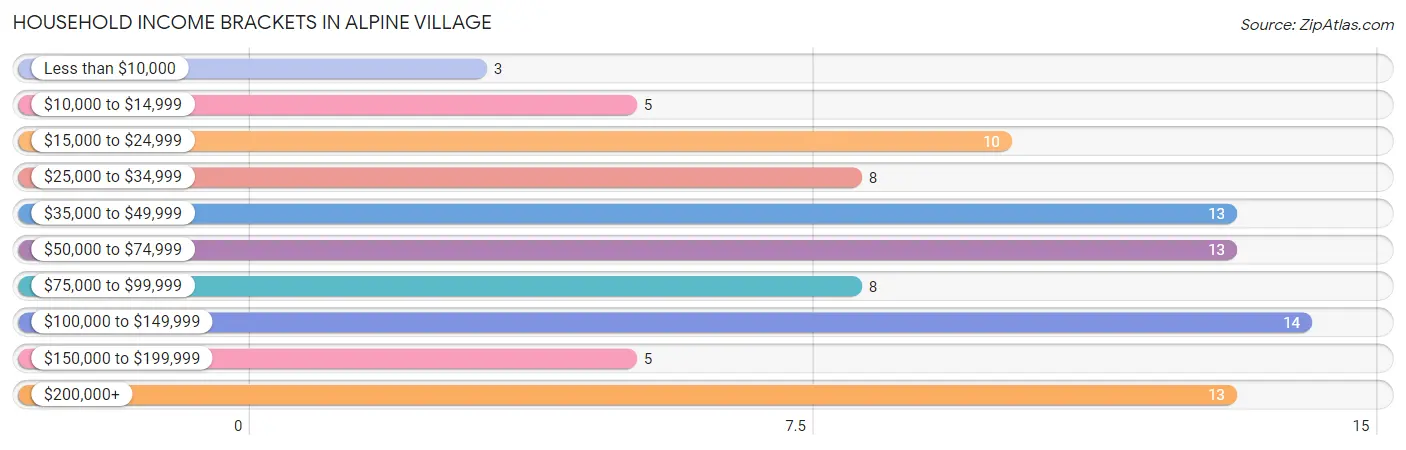
| Income Bracket | # Households | % Households |
| Less than $10,000 | 3 | 3.3% |
| $10,000 to $14,999 | 5 | 5.4% |
| $15,000 to $24,999 | 10 | 10.9% |
| $25,000 to $34,999 | 8 | 8.7% |
| $35,000 to $49,999 | 13 | 14.1% |
| $50,000 to $74,999 | 13 | 14.1% |
| $75,000 to $99,999 | 8 | 8.7% |
| $100,000 to $149,999 | 14 | 15.2% |
| $150,000 to $199,999 | 5 | 5.4% |
| $200,000+ | 13 | 14.1% |
Household Income by Householder Age in Alpine Village
The median household income in Alpine Village is $68,333, with the highest median household income of $250,001 found in the 25 to 44 years age bracket for the primary householder. A total of 10 households (10.9%) fall into this category.
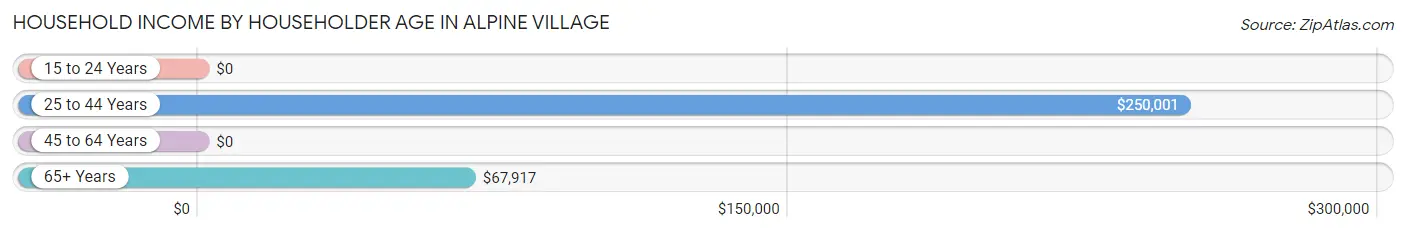
| Income Bracket | # Households | Median Income |
| 15 to 24 Years | 0 (0.0%) | $0 |
| 25 to 44 Years | 10 (10.9%) | $250,001 |
| 45 to 64 Years | 33 (35.9%) | $0 |
| 65+ Years | 49 (53.3%) | $67,917 |
| Total | 92 (100.0%) | $68,333 |
Poverty in Alpine Village
Income Below Poverty by Sex and Age in Alpine Village
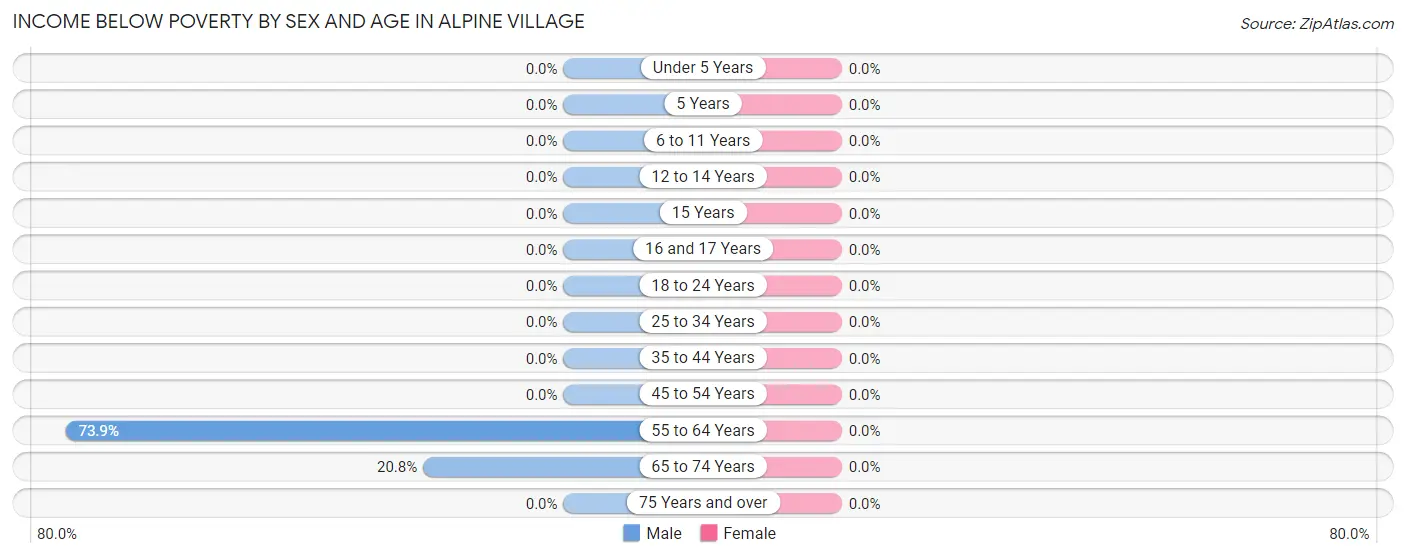
| Age Bracket | Male | Female |
| Under 5 Years | 0 (0.0%) | 0 (0.0%) |
| 5 Years | 0 (0.0%) | 0 (0.0%) |
| 6 to 11 Years | 0 (0.0%) | 0 (0.0%) |
| 12 to 14 Years | 0 (0.0%) | 0 (0.0%) |
| 15 Years | 0 (0.0%) | 0 (0.0%) |
| 16 and 17 Years | 0 (0.0%) | 0 (0.0%) |
| 18 to 24 Years | 0 (0.0%) | 0 (0.0%) |
| 25 to 34 Years | 0 (0.0%) | 0 (0.0%) |
| 35 to 44 Years | 0 (0.0%) | 0 (0.0%) |
| 45 to 54 Years | 0 (0.0%) | 0 (0.0%) |
| 55 to 64 Years | 34 (73.9%) | 0 (0.0%) |
| 65 to 74 Years | 5 (20.8%) | 0 (0.0%) |
| 75 Years and over | 0 (0.0%) | 0 (0.0%) |
| Total | 39 (26.2%) | 0 (0.0%) |
Income Above Poverty by Sex and Age in Alpine Village
According to the poverty statistics in Alpine Village, males aged 12 to 14 years and females aged 16 and 17 years are the age groups that are most secure financially, with 100.0% of males and 100.0% of females in these age groups living above the poverty line.
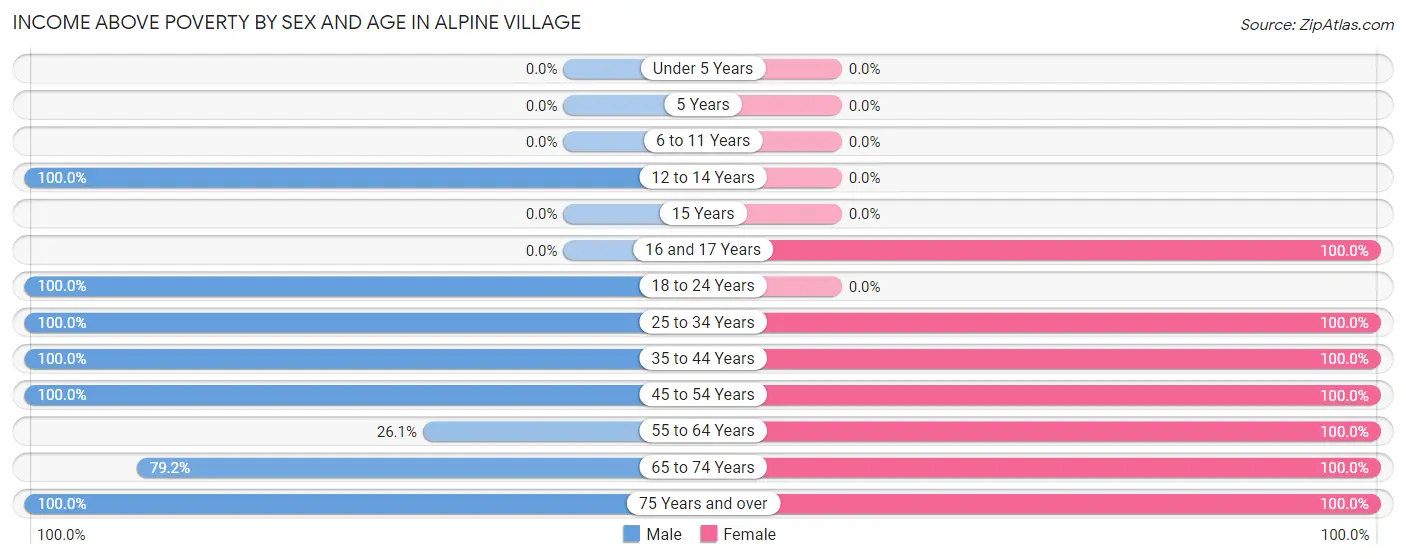
| Age Bracket | Male | Female |
| Under 5 Years | 0 (0.0%) | 0 (0.0%) |
| 5 Years | 0 (0.0%) | 0 (0.0%) |
| 6 to 11 Years | 0 (0.0%) | 0 (0.0%) |
| 12 to 14 Years | 4 (100.0%) | 0 (0.0%) |
| 15 Years | 0 (0.0%) | 0 (0.0%) |
| 16 and 17 Years | 0 (0.0%) | 5 (100.0%) |
| 18 to 24 Years | 54 (100.0%) | 0 (0.0%) |
| 25 to 34 Years | 6 (100.0%) | 6 (100.0%) |
| 35 to 44 Years | 4 (100.0%) | 1 (100.0%) |
| 45 to 54 Years | 3 (100.0%) | 3 (100.0%) |
| 55 to 64 Years | 12 (26.1%) | 23 (100.0%) |
| 65 to 74 Years | 19 (79.2%) | 24 (100.0%) |
| 75 Years and over | 8 (100.0%) | 9 (100.0%) |
| Total | 110 (73.8%) | 71 (100.0%) |
Income Below Poverty Among Married-Couple Families in Alpine Village
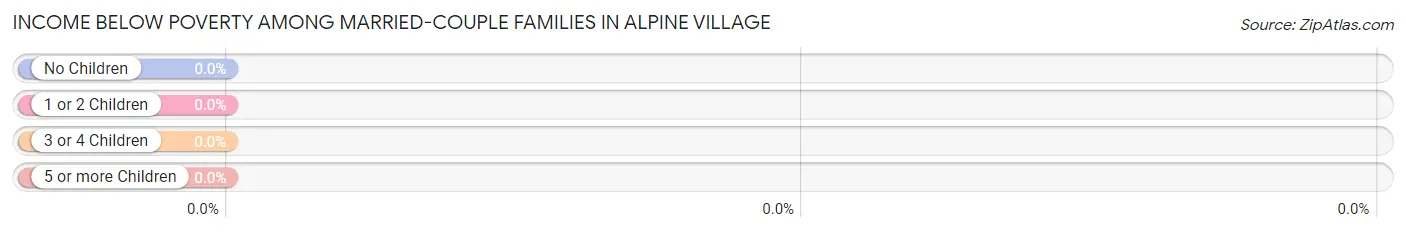
| Children | Above Poverty | Below Poverty |
| No Children | 33 (100.0%) | 0 (0.0%) |
| 1 or 2 Children | 5 (100.0%) | 0 (0.0%) |
| 3 or 4 Children | 0 (0.0%) | 0 (0.0%) |
| 5 or more Children | 0 (0.0%) | 0 (0.0%) |
| Total | 38 (100.0%) | 0 (0.0%) |
Income Below Poverty Among Single-Parent Households in Alpine Village
| Children | Single Father | Single Mother |
| No Children | 0 (0.0%) | 0 (0.0%) |
| 1 or 2 Children | 0 (0.0%) | 0 (0.0%) |
| 3 or 4 Children | 0 (0.0%) | 0 (0.0%) |
| 5 or more Children | 0 (0.0%) | 0 (0.0%) |
| Total | 0 (0.0%) | 0 (0.0%) |
Income Below Poverty Among Married-Couple vs Single-Parent Households in Alpine Village
| Children | Married-Couple Families | Single-Parent Households |
| No Children | 0 (0.0%) | 0 (0.0%) |
| 1 or 2 Children | 0 (0.0%) | 0 (0.0%) |
| 3 or 4 Children | 0 (0.0%) | 0 (0.0%) |
| 5 or more Children | 0 (0.0%) | 0 (0.0%) |
| Total | 0 (0.0%) | 0 (0.0%) |
Race in Alpine Village
The most populous races in Alpine Village are White / Caucasian (214 | 97.3%), Asian (3 | 1.4%), and Two or more Races (3 | 1.4%).
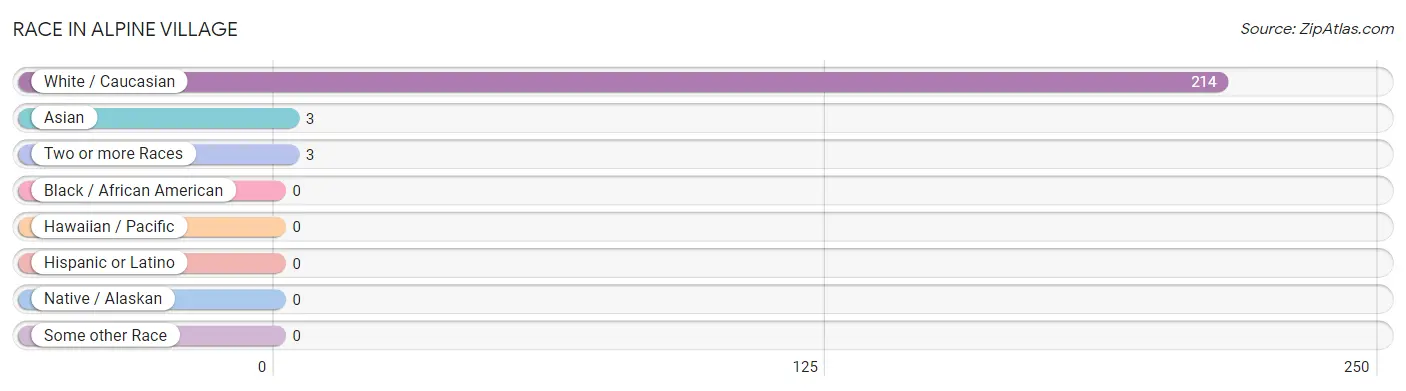
| Race | # Population | % Population |
| Asian | 3 | 1.4% |
| Black / African American | 0 | 0.0% |
| Hawaiian / Pacific | 0 | 0.0% |
| Hispanic or Latino | 0 | 0.0% |
| Native / Alaskan | 0 | 0.0% |
| White / Caucasian | 214 | 97.3% |
| Two or more Races | 3 | 1.4% |
| Some other Race | 0 | 0.0% |
| Total | 220 | 100.0% |
Ancestry in Alpine Village
The most populous ancestries reported in Alpine Village are German (93 | 42.3%), English (90 | 40.9%), Romanian (36 | 16.4%), Irish (28 | 12.7%), and Scottish (8 | 3.6%), together accounting for 115.9% of all Alpine Village residents.
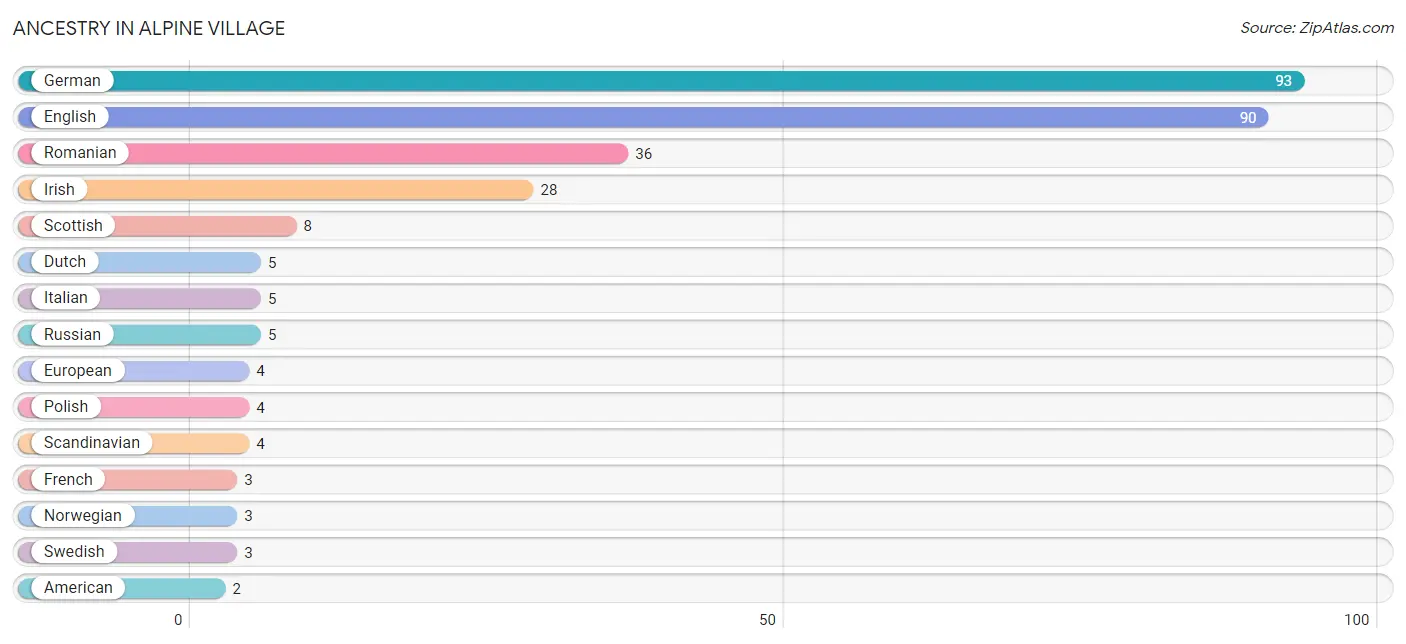
| Ancestry | # Population | % Population |
| American | 2 | 0.9% |
| Bhutanese | 2 | 0.9% |
| Burmese | 1 | 0.4% |
| Dutch | 5 | 2.3% |
| English | 90 | 40.9% |
| European | 4 | 1.8% |
| French | 3 | 1.4% |
| German | 93 | 42.3% |
| Greek | 1 | 0.4% |
| Irish | 28 | 12.7% |
| Italian | 5 | 2.3% |
| Norwegian | 3 | 1.4% |
| Polish | 4 | 1.8% |
| Romanian | 36 | 16.4% |
| Russian | 5 | 2.3% |
| Scandinavian | 4 | 1.8% |
| Scottish | 8 | 3.6% |
| Swedish | 3 | 1.4% | View All 18 Rows |
Immigrants in Alpine Village
The most numerous immigrant groups reported in Alpine Village came from Canada (3 | 1.4%), Asia (1 | 0.4%), Eastern Asia (1 | 0.4%), and Korea (1 | 0.4%), together accounting for 2.7% of all Alpine Village residents.
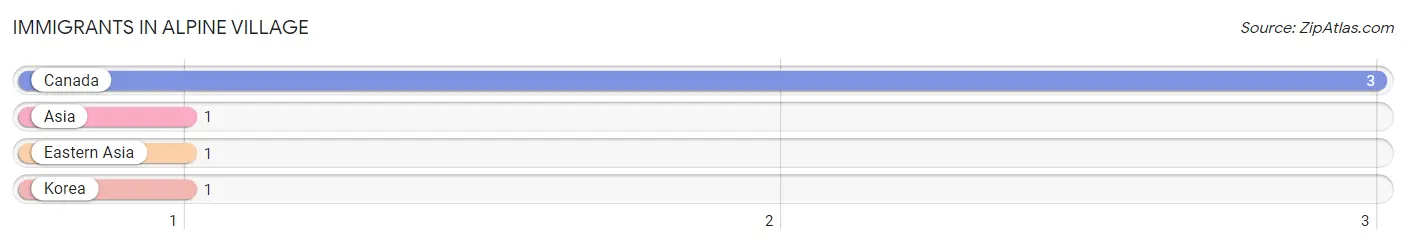
| Immigration Origin | # Population | % Population |
| Asia | 1 | 0.4% |
| Canada | 3 | 1.4% |
| Eastern Asia | 1 | 0.4% |
| Korea | 1 | 0.4% | View All 4 Rows |
Sex and Age in Alpine Village
Sex and Age in Alpine Village
The most populous age groups in Alpine Village are 15 to 19 Years (54 | 36.2%) for men and 55 to 59 Years (18 | 25.4%) for women.
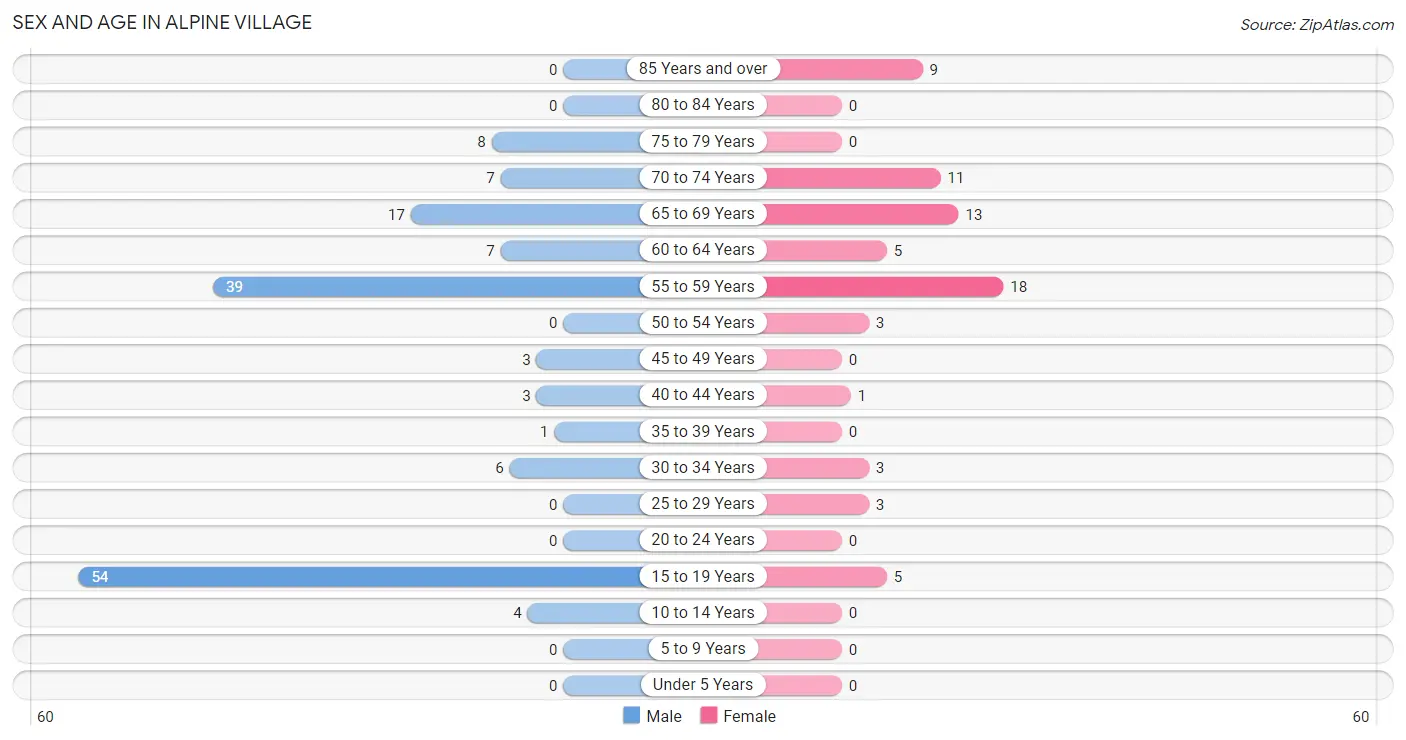
| Age Bracket | Male | Female |
| Under 5 Years | 0 (0.0%) | 0 (0.0%) |
| 5 to 9 Years | 0 (0.0%) | 0 (0.0%) |
| 10 to 14 Years | 4 (2.7%) | 0 (0.0%) |
| 15 to 19 Years | 54 (36.2%) | 5 (7.0%) |
| 20 to 24 Years | 0 (0.0%) | 0 (0.0%) |
| 25 to 29 Years | 0 (0.0%) | 3 (4.2%) |
| 30 to 34 Years | 6 (4.0%) | 3 (4.2%) |
| 35 to 39 Years | 1 (0.7%) | 0 (0.0%) |
| 40 to 44 Years | 3 (2.0%) | 1 (1.4%) |
| 45 to 49 Years | 3 (2.0%) | 0 (0.0%) |
| 50 to 54 Years | 0 (0.0%) | 3 (4.2%) |
| 55 to 59 Years | 39 (26.2%) | 18 (25.4%) |
| 60 to 64 Years | 7 (4.7%) | 5 (7.0%) |
| 65 to 69 Years | 17 (11.4%) | 13 (18.3%) |
| 70 to 74 Years | 7 (4.7%) | 11 (15.5%) |
| 75 to 79 Years | 8 (5.4%) | 0 (0.0%) |
| 80 to 84 Years | 0 (0.0%) | 0 (0.0%) |
| 85 Years and over | 0 (0.0%) | 9 (12.7%) |
| Total | 149 (100.0%) | 71 (100.0%) |
Families and Households in Alpine Village
Median Family Size in Alpine Village
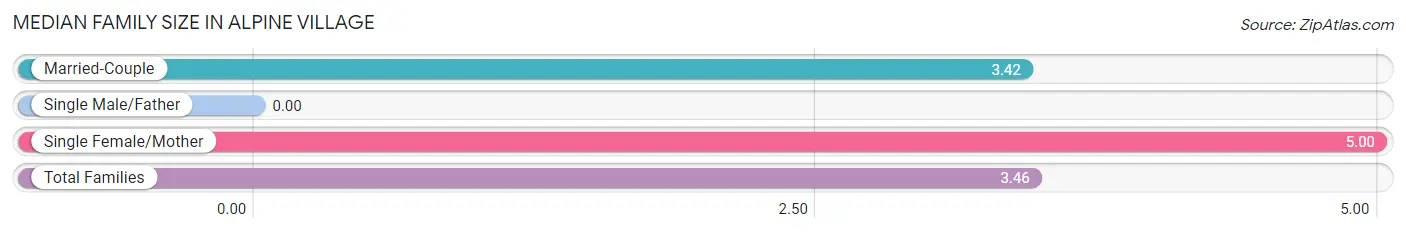
| Family Type | # Families | Family Size |
| Married-Couple | 38 (97.4%) | 3.42 |
| Single Male/Father | 0 (0.0%) | - |
| Single Female/Mother | 1 (2.6%) | 5.00 |
| Total Families | 39 (100.0%) | 3.46 |
Median Household Size in Alpine Village
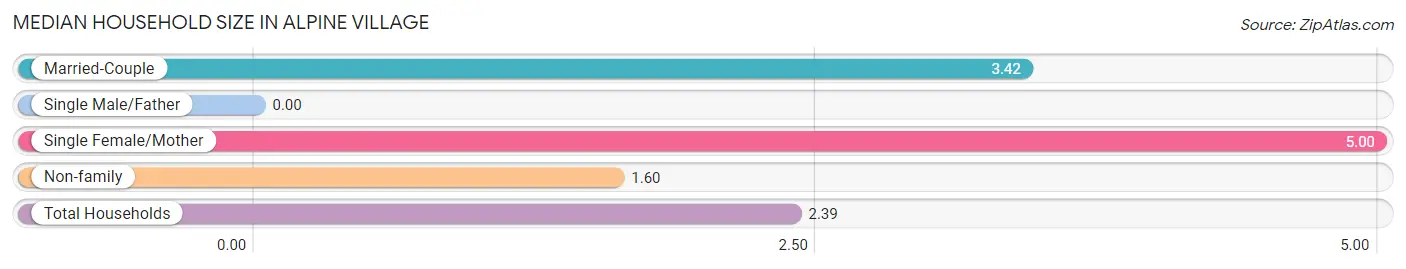
| Household Type | # Households | Household Size |
| Married-Couple | 38 (41.3%) | 3.42 |
| Single Male/Father | 0 (0.0%) | - |
| Single Female/Mother | 1 (1.1%) | 5.00 |
| Non-family | 53 (57.6%) | 1.60 |
| Total Households | 92 (100.0%) | 2.39 |
Household Size by Marriage Status in Alpine Village
Out of a total of 92 households in Alpine Village, 39 (42.4%) are family households, while 53 (57.6%) are nonfamily households. The most numerous type of family households are 2-person households, comprising 34, and the most common type of nonfamily households are 1-person households, comprising 45.
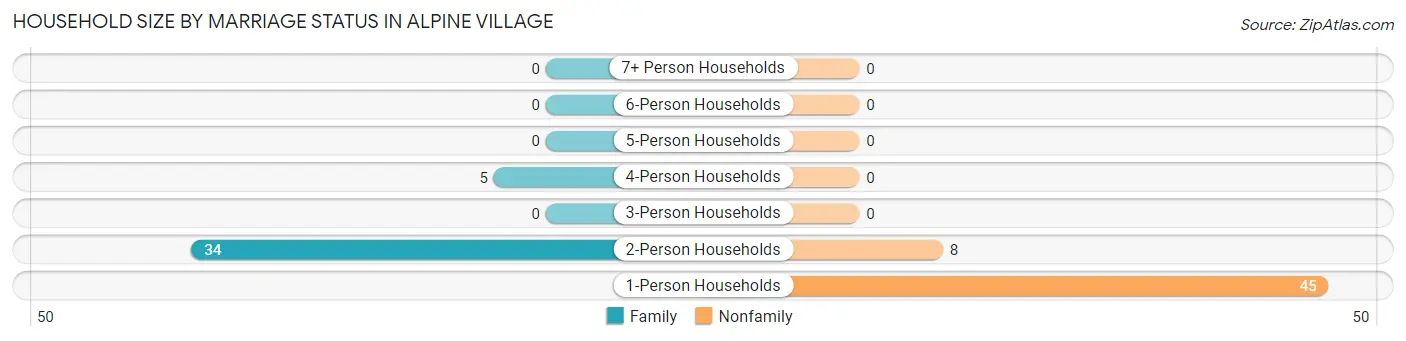
| Household Size | Family Households | Nonfamily Households |
| 1-Person Households | - | 45 (48.9%) |
| 2-Person Households | 34 (37.0%) | 8 (8.7%) |
| 3-Person Households | 0 (0.0%) | 0 (0.0%) |
| 4-Person Households | 5 (5.4%) | 0 (0.0%) |
| 5-Person Households | 0 (0.0%) | 0 (0.0%) |
| 6-Person Households | 0 (0.0%) | 0 (0.0%) |
| 7+ Person Households | 0 (0.0%) | 0 (0.0%) |
| Total | 39 (42.4%) | 53 (57.6%) |
Female Fertility in Alpine Village
Fertility by Age in Alpine Village
| Age Bracket | Women with Births | Births / 1,000 Women |
| 15 to 19 years | 0 (0.0%) | 0.0 |
| 20 to 34 years | 0 (0.0%) | 0.0 |
| 35 to 50 years | 0 (0.0%) | 0.0 |
| Total | 0 (0.0%) | 0.0 |
Fertility by Age by Marriage Status in Alpine Village
| Age Bracket | Married | Unmarried |
| 15 to 19 years | 0 (0.0%) | 0 (0.0%) |
| 20 to 34 years | 0 (0.0%) | 0 (0.0%) |
| 35 to 50 years | 0 (0.0%) | 0 (0.0%) |
| Total | 0 (0.0%) | 0 (0.0%) |
Fertility by Education in Alpine Village
| Educational Attainment | Women with Births | Births / 1,000 Women |
| Less than High School | 0 (0.0%) | 0.0 |
| High School Diploma | 0 (0.0%) | 0.0 |
| College or Associate's Degree | 0 (0.0%) | 0.0 |
| Bachelor's Degree | 0 (0.0%) | 0.0 |
| Graduate Degree | 0 (0.0%) | 0.0 |
| Total | 0 (0.0%) | 0.0 |
Fertility by Education by Marriage Status in Alpine Village
| Educational Attainment | Married | Unmarried |
| Less than High School | 0 (0.0%) | 0 (0.0%) |
| High School Diploma | 0 (0.0%) | 0 (0.0%) |
| College or Associate's Degree | 0 (0.0%) | 0 (0.0%) |
| Bachelor's Degree | 0 (0.0%) | 0 (0.0%) |
| Graduate Degree | 0 (0.0%) | 0 (0.0%) |
| Total | 0 (0.0%) | 0 (0.0%) |
Employment Characteristics in Alpine Village
Employment by Class of Employer in Alpine Village
Among the 108 employed individuals in Alpine Village, private company employees (75 | 69.4%), federal government employees (9 | 8.3%), and self-employed (incorporated) (8 | 7.4%) make up the most common classes of employment.
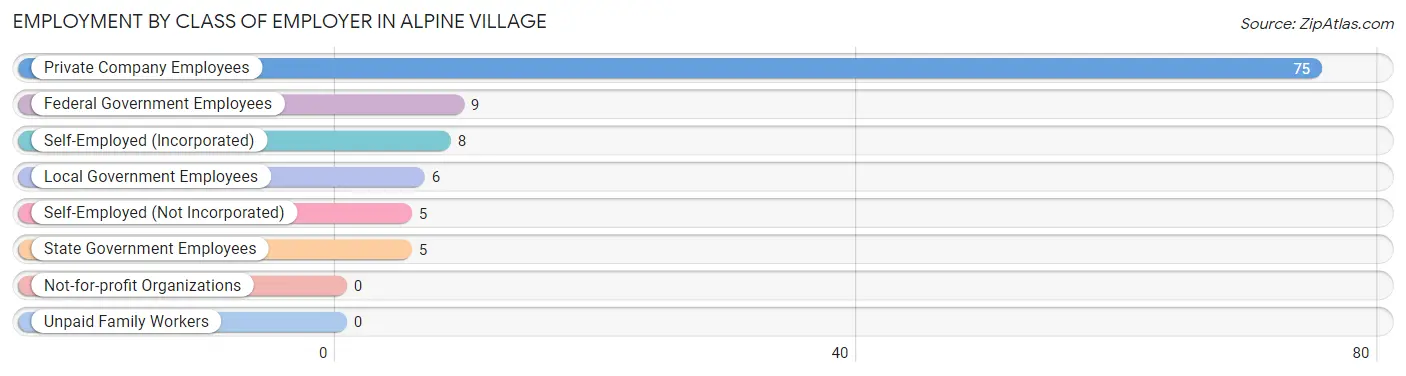
| Employer Class | # Employees | % Employees |
| Private Company Employees | 75 | 69.4% |
| Self-Employed (Incorporated) | 8 | 7.4% |
| Self-Employed (Not Incorporated) | 5 | 4.6% |
| Not-for-profit Organizations | 0 | 0.0% |
| Local Government Employees | 6 | 5.6% |
| State Government Employees | 5 | 4.6% |
| Federal Government Employees | 9 | 8.3% |
| Unpaid Family Workers | 0 | 0.0% |
| Total | 108 | 100.0% |
Employment Status by Age in Alpine Village
According to the labor force statistics for Alpine Village, out of the total population over 16 years of age (216), 52.3% or 113 individuals are in the labor force, with 4.4% or 5 of them unemployed. The age group with the highest labor force participation rate is 16 to 19 years, with 100.0% or 59 individuals in the labor force. Within the labor force, the 16 to 19 years age range has the highest percentage of unemployed individuals, with 8.5% or 5 of them being unemployed.
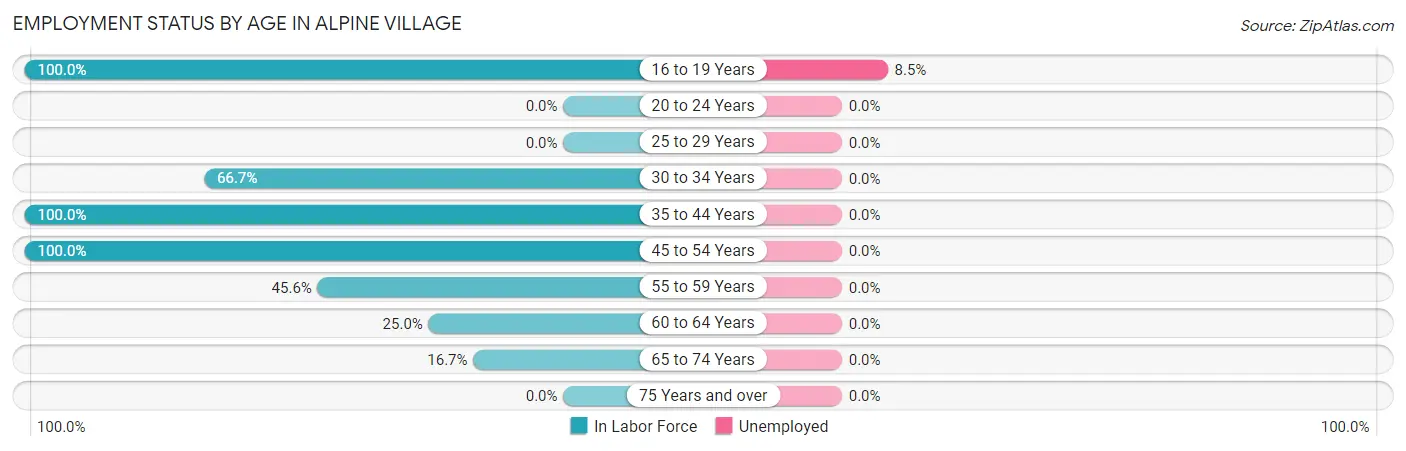
| Age Bracket | In Labor Force | Unemployed |
| 16 to 19 Years | 59 (100.0%) | 5 (8.5%) |
| 20 to 24 Years | 0 (0.0%) | 0 (0.0%) |
| 25 to 29 Years | 0 (0.0%) | 0 (0.0%) |
| 30 to 34 Years | 6 (66.7%) | 0 (0.0%) |
| 35 to 44 Years | 5 (100.0%) | 0 (0.0%) |
| 45 to 54 Years | 6 (100.0%) | 0 (0.0%) |
| 55 to 59 Years | 26 (45.6%) | 0 (0.0%) |
| 60 to 64 Years | 3 (25.0%) | 0 (0.0%) |
| 65 to 74 Years | 8 (16.7%) | 0 (0.0%) |
| 75 Years and over | 0 (0.0%) | 0 (0.0%) |
| Total | 113 (52.3%) | 5 (4.4%) |
Employment Status by Educational Attainment in Alpine Village
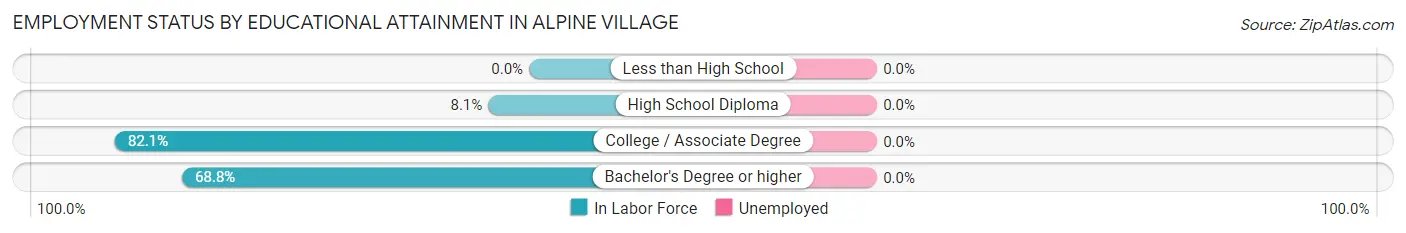
| Educational Attainment | In Labor Force | Unemployed |
| Less than High School | 0 (0.0%) | 0 (0.0%) |
| High School Diploma | 3 (8.1%) | 0 (0.0%) |
| College / Associate Degree | 32 (82.1%) | 0 (0.0%) |
| Bachelor's Degree or higher | 11 (68.8%) | 0 (0.0%) |
| Total | 46 (50.0%) | 0 (0.0%) |
Employment Occupations by Sex in Alpine Village
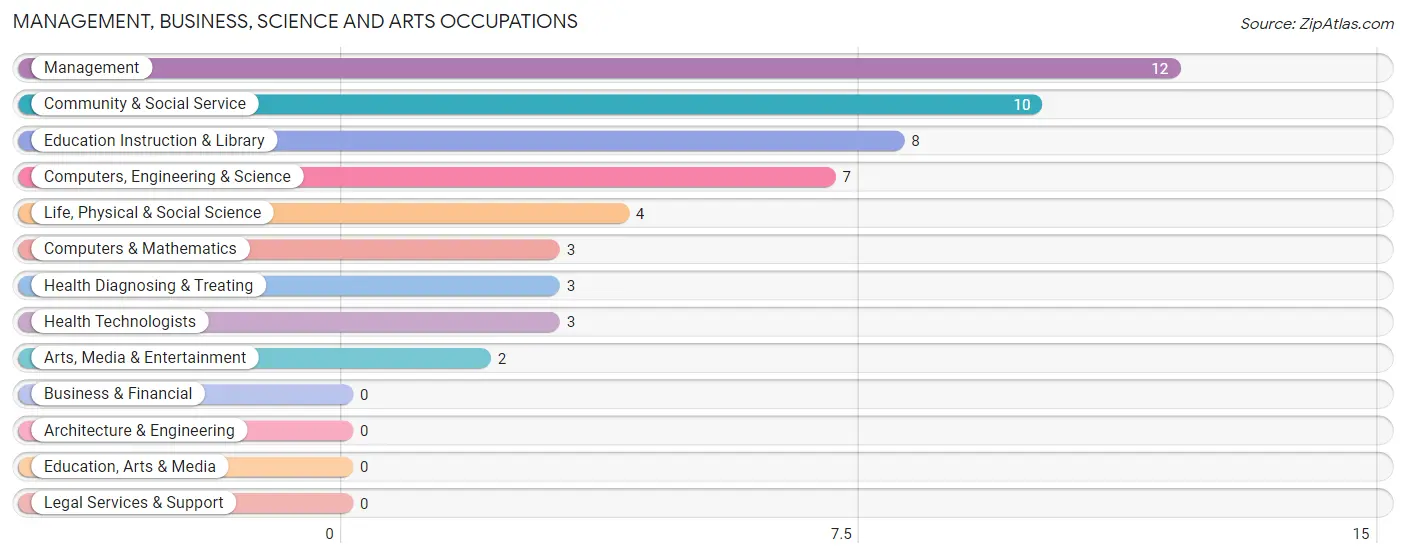
Management, Business, Science and Arts Occupations
The most common Management, Business, Science and Arts occupations in Alpine Village are Management (12 | 11.1%), Community & Social Service (10 | 9.3%), Education Instruction & Library (8 | 7.4%), Computers, Engineering & Science (7 | 6.5%), and Life, Physical & Social Science (4 | 3.7%).
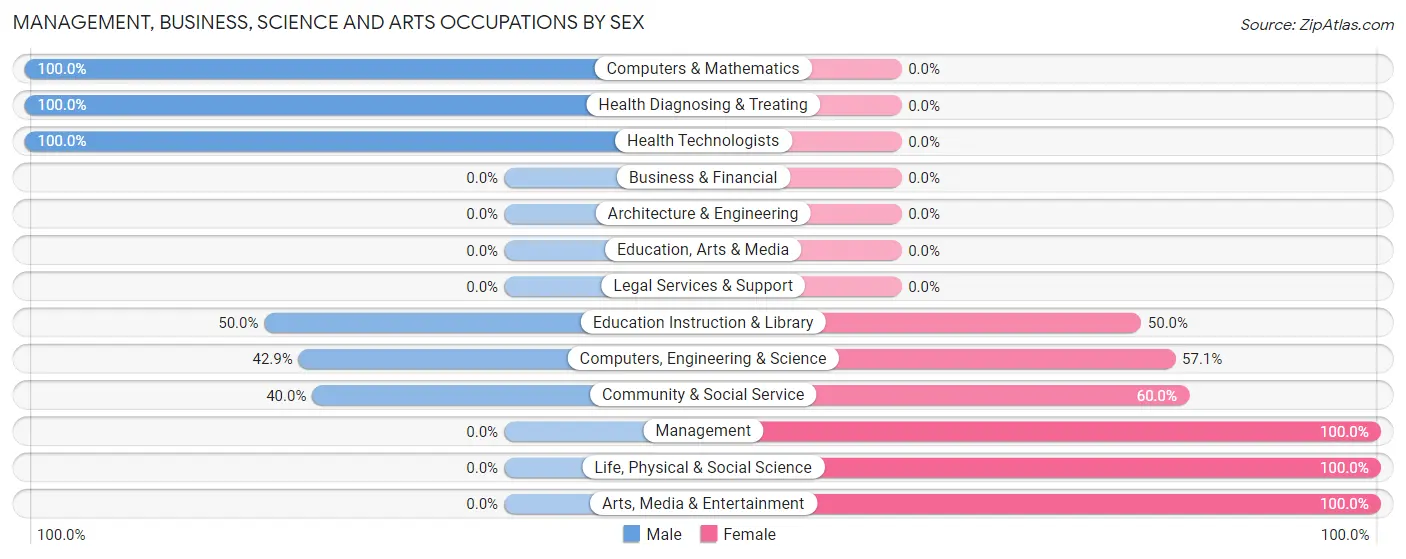
Management, Business, Science and Arts Occupations by Sex
Within the Management, Business, Science and Arts occupations in Alpine Village, the most male-oriented occupations are Computers & Mathematics (100.0%), Health Diagnosing & Treating (100.0%), and Health Technologists (100.0%), while the most female-oriented occupations are Management (100.0%), Life, Physical & Social Science (100.0%), and Arts, Media & Entertainment (100.0%).
| Occupation | Male | Female |
| Management | 0 (0.0%) | 12 (100.0%) |
| Business & Financial | 0 (0.0%) | 0 (0.0%) |
| Computers, Engineering & Science | 3 (42.9%) | 4 (57.1%) |
| Computers & Mathematics | 3 (100.0%) | 0 (0.0%) |
| Architecture & Engineering | 0 (0.0%) | 0 (0.0%) |
| Life, Physical & Social Science | 0 (0.0%) | 4 (100.0%) |
| Community & Social Service | 4 (40.0%) | 6 (60.0%) |
| Education, Arts & Media | 0 (0.0%) | 0 (0.0%) |
| Legal Services & Support | 0 (0.0%) | 0 (0.0%) |
| Education Instruction & Library | 4 (50.0%) | 4 (50.0%) |
| Arts, Media & Entertainment | 0 (0.0%) | 2 (100.0%) |
| Health Diagnosing & Treating | 3 (100.0%) | 0 (0.0%) |
| Health Technologists | 3 (100.0%) | 0 (0.0%) |
| Total (Category) | 10 (31.2%) | 22 (68.8%) |
| Total (Overall) | 76 (70.4%) | 32 (29.6%) |
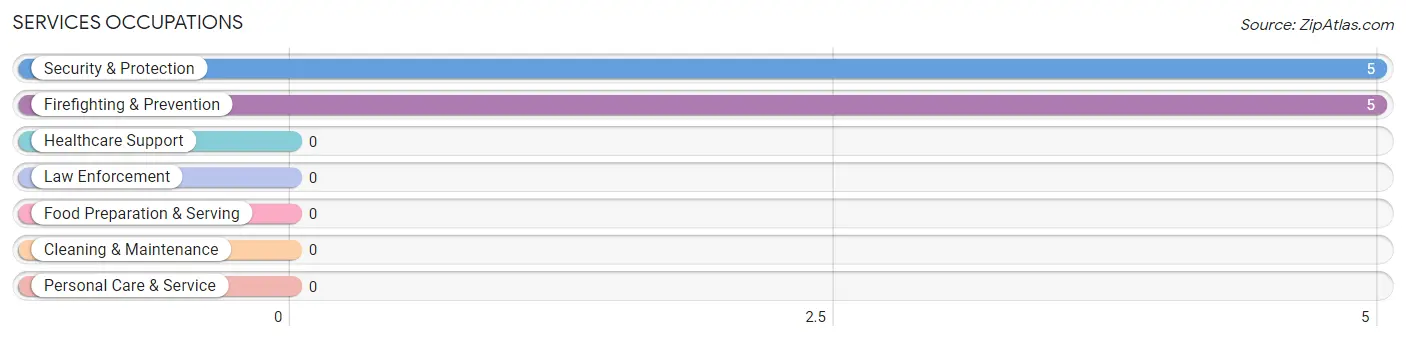
Services Occupations
The most common Services occupations in Alpine Village are Security & Protection (5 | 4.6%), and Firefighting & Prevention (5 | 4.6%).
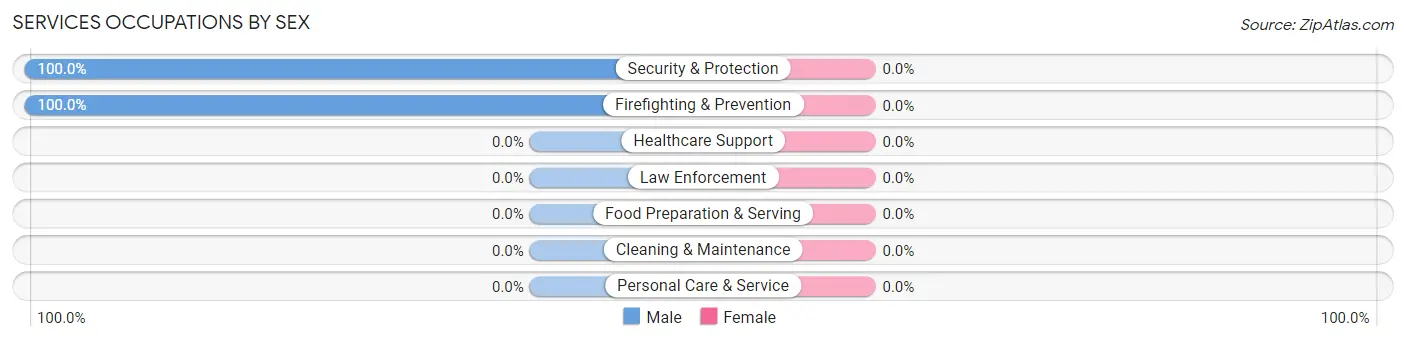
Services Occupations by Sex
| Occupation | Male | Female |
| Healthcare Support | 0 (0.0%) | 0 (0.0%) |
| Security & Protection | 5 (100.0%) | 0 (0.0%) |
| Firefighting & Prevention | 5 (100.0%) | 0 (0.0%) |
| Law Enforcement | 0 (0.0%) | 0 (0.0%) |
| Food Preparation & Serving | 0 (0.0%) | 0 (0.0%) |
| Cleaning & Maintenance | 0 (0.0%) | 0 (0.0%) |
| Personal Care & Service | 0 (0.0%) | 0 (0.0%) |
| Total (Category) | 5 (100.0%) | 0 (0.0%) |
| Total (Overall) | 76 (70.4%) | 32 (29.6%) |
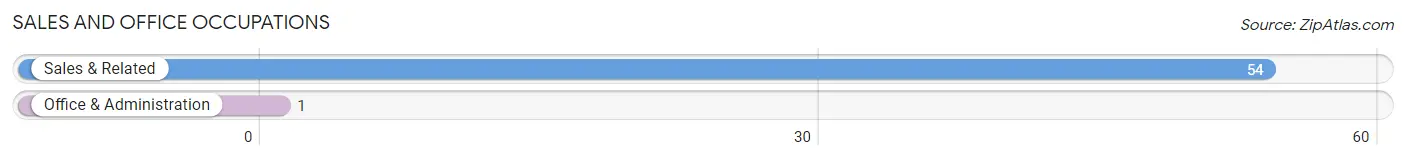
Sales and Office Occupations
The most common Sales and Office occupations in Alpine Village are Sales & Related (54 | 50.0%), and Office & Administration (1 | 0.9%).
Sales and Office Occupations by Sex
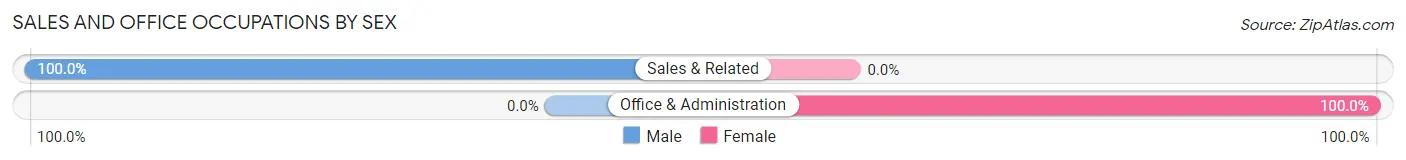
| Occupation | Male | Female |
| Sales & Related | 54 (100.0%) | 0 (0.0%) |
| Office & Administration | 0 (0.0%) | 1 (100.0%) |
| Total (Category) | 54 (98.2%) | 1 (1.8%) |
| Total (Overall) | 76 (70.4%) | 32 (29.6%) |
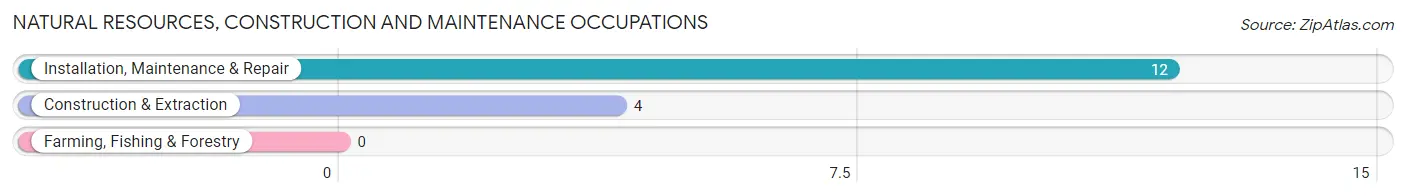
Natural Resources, Construction and Maintenance Occupations
The most common Natural Resources, Construction and Maintenance occupations in Alpine Village are Installation, Maintenance & Repair (12 | 11.1%), and Construction & Extraction (4 | 3.7%).
Natural Resources, Construction and Maintenance Occupations by Sex
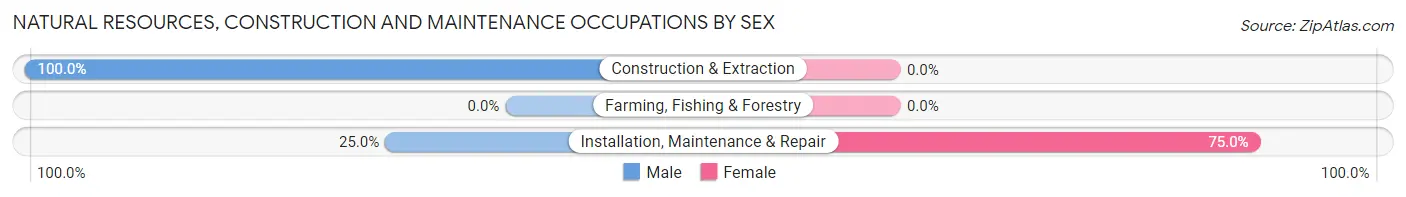
| Occupation | Male | Female |
| Farming, Fishing & Forestry | 0 (0.0%) | 0 (0.0%) |
| Construction & Extraction | 4 (100.0%) | 0 (0.0%) |
| Installation, Maintenance & Repair | 3 (25.0%) | 9 (75.0%) |
| Total (Category) | 7 (43.8%) | 9 (56.2%) |
| Total (Overall) | 76 (70.4%) | 32 (29.6%) |
Production, Transportation and Moving Occupations
Production, Transportation and Moving Occupations by Sex
| Occupation | Male | Female |
| Production | 0 (0.0%) | 0 (0.0%) |
| Transportation | 0 (0.0%) | 0 (0.0%) |
| Material Moving | 0 (0.0%) | 0 (0.0%) |
| Total (Category) | 0 (0.0%) | 0 (0.0%) |
| Total (Overall) | 76 (70.4%) | 32 (29.6%) |
Employment Industries by Sex in Alpine Village
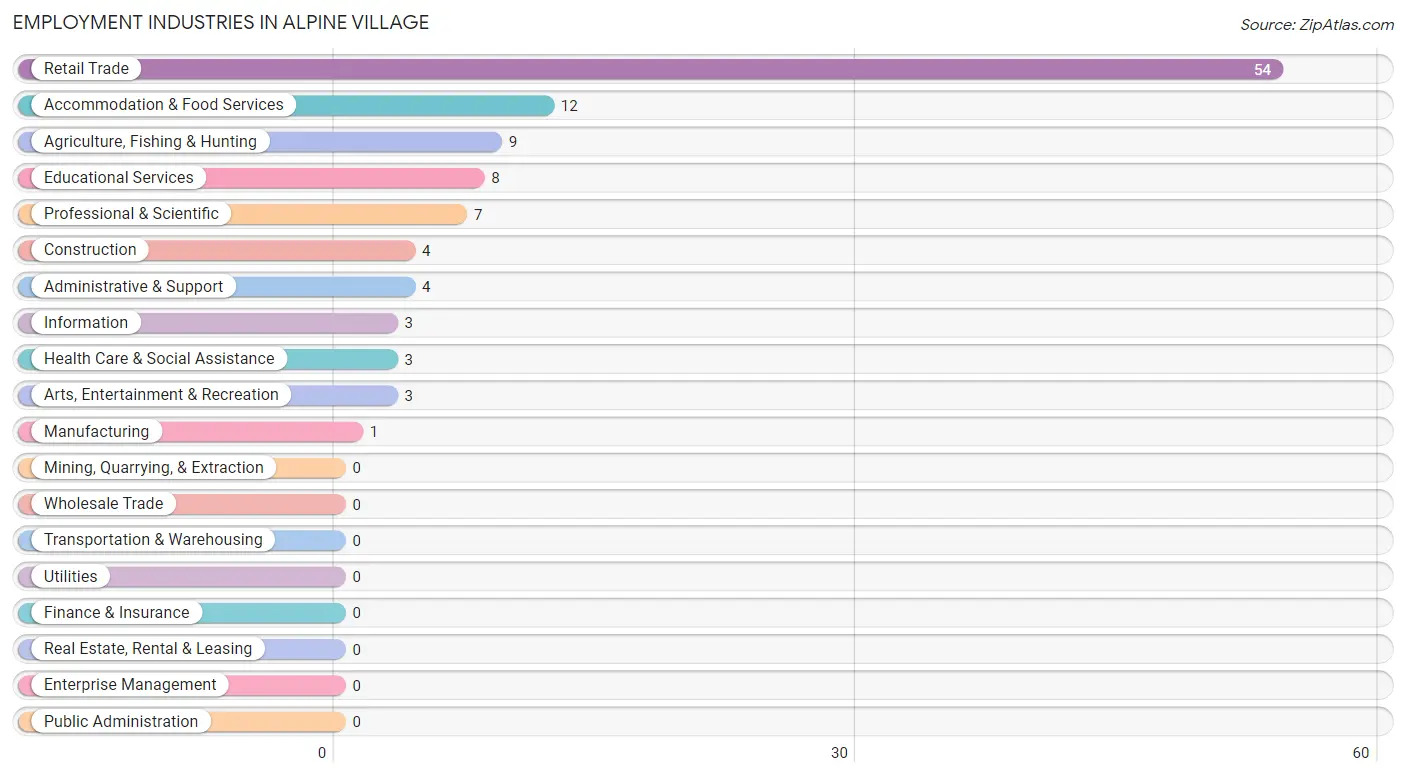
Employment Industries in Alpine Village
The major employment industries in Alpine Village include Retail Trade (54 | 50.0%), Accommodation & Food Services (12 | 11.1%), Agriculture, Fishing & Hunting (9 | 8.3%), Educational Services (8 | 7.4%), and Professional & Scientific (7 | 6.5%).
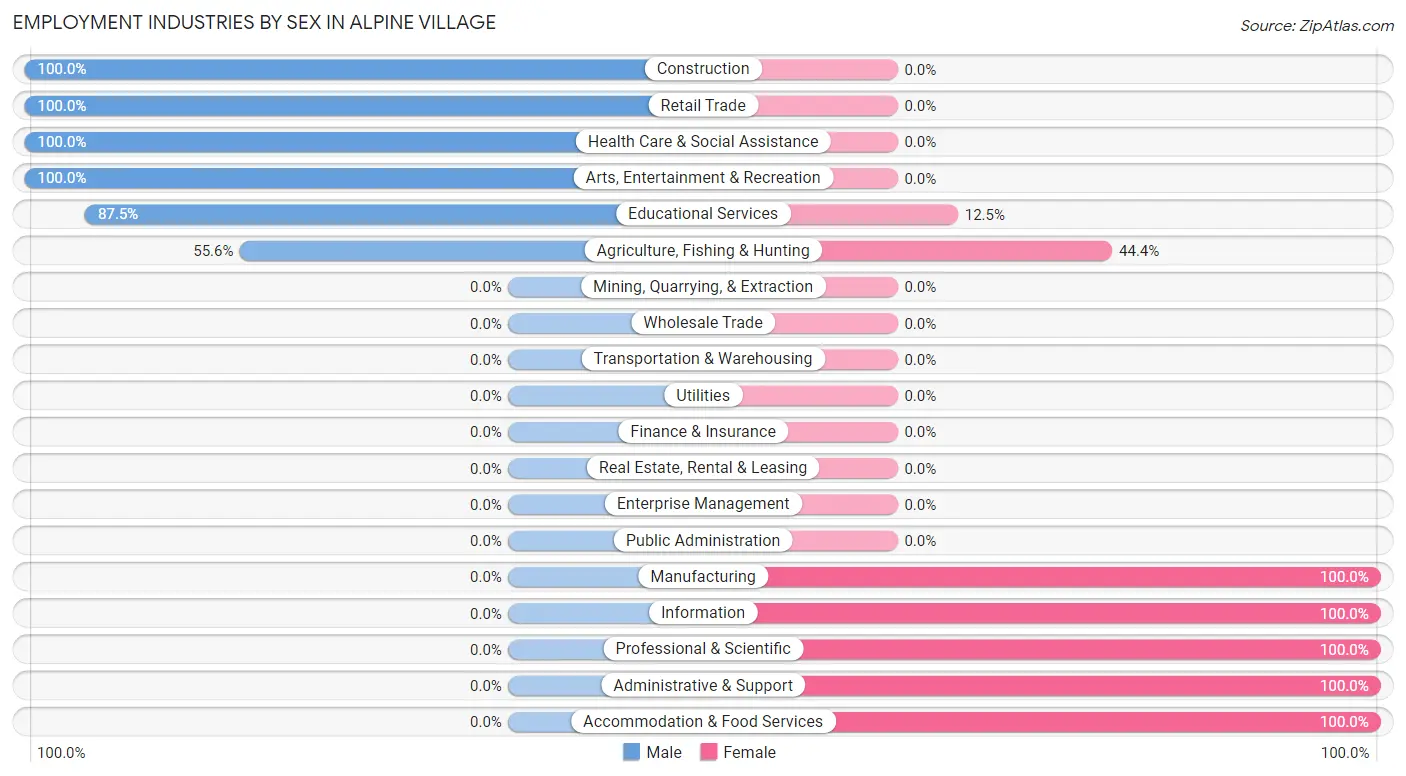
Employment Industries by Sex in Alpine Village
The Alpine Village industries that see more men than women are Construction (100.0%), Retail Trade (100.0%), and Health Care & Social Assistance (100.0%), whereas the industries that tend to have a higher number of women are Manufacturing (100.0%), Information (100.0%), and Professional & Scientific (100.0%).
| Industry | Male | Female |
| Agriculture, Fishing & Hunting | 5 (55.6%) | 4 (44.4%) |
| Mining, Quarrying, & Extraction | 0 (0.0%) | 0 (0.0%) |
| Construction | 4 (100.0%) | 0 (0.0%) |
| Manufacturing | 0 (0.0%) | 1 (100.0%) |
| Wholesale Trade | 0 (0.0%) | 0 (0.0%) |
| Retail Trade | 54 (100.0%) | 0 (0.0%) |
| Transportation & Warehousing | 0 (0.0%) | 0 (0.0%) |
| Utilities | 0 (0.0%) | 0 (0.0%) |
| Information | 0 (0.0%) | 3 (100.0%) |
| Finance & Insurance | 0 (0.0%) | 0 (0.0%) |
| Real Estate, Rental & Leasing | 0 (0.0%) | 0 (0.0%) |
| Professional & Scientific | 0 (0.0%) | 7 (100.0%) |
| Enterprise Management | 0 (0.0%) | 0 (0.0%) |
| Administrative & Support | 0 (0.0%) | 4 (100.0%) |
| Educational Services | 7 (87.5%) | 1 (12.5%) |
| Health Care & Social Assistance | 3 (100.0%) | 0 (0.0%) |
| Arts, Entertainment & Recreation | 3 (100.0%) | 0 (0.0%) |
| Accommodation & Food Services | 0 (0.0%) | 12 (100.0%) |
| Public Administration | 0 (0.0%) | 0 (0.0%) |
| Total | 76 (70.4%) | 32 (29.6%) |
Education in Alpine Village
School Enrollment in Alpine Village
The most common levels of schooling among the 67 students in Alpine Village are college / undergraduate (58 | 86.6%), high school (5 | 7.5%), and middle school (4 | 6.0%).
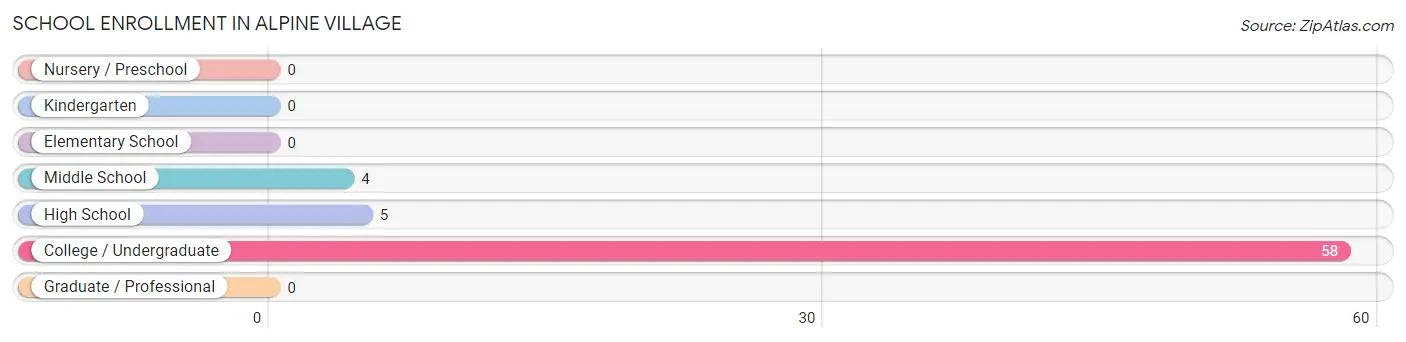
| School Level | # Students | % Students |
| Nursery / Preschool | 0 | 0.0% |
| Kindergarten | 0 | 0.0% |
| Elementary School | 0 | 0.0% |
| Middle School | 4 | 6.0% |
| High School | 5 | 7.5% |
| College / Undergraduate | 58 | 86.6% |
| Graduate / Professional | 0 | 0.0% |
| Total | 67 | 100.0% |
School Enrollment by Age by Funding Source in Alpine Village
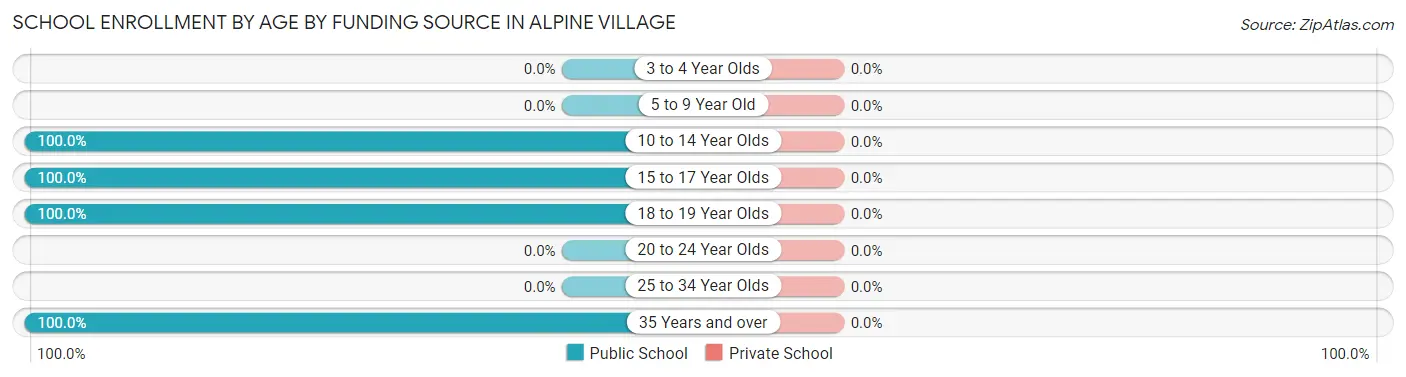
| Age Bracket | Public School | Private School |
| 3 to 4 Year Olds | 0 (0.0%) | 0 (0.0%) |
| 5 to 9 Year Old | 0 (0.0%) | 0 (0.0%) |
| 10 to 14 Year Olds | 4 (100.0%) | 0 (0.0%) |
| 15 to 17 Year Olds | 5 (100.0%) | 0 (0.0%) |
| 18 to 19 Year Olds | 54 (100.0%) | 0 (0.0%) |
| 20 to 24 Year Olds | 0 (0.0%) | 0 (0.0%) |
| 25 to 34 Year Olds | 0 (0.0%) | 0 (0.0%) |
| 35 Years and over | 4 (100.0%) | 0 (0.0%) |
| Total | 67 (100.0%) | 0 (0.0%) |
Educational Attainment by Field of Study in Alpine Village
Bio, nature & agricultural (10 | 15.9%), education (9 | 14.3%), psychology (8 | 12.7%), social sciences (8 | 12.7%), and liberal arts & history (6 | 9.5%) are the most common fields of study among 63 individuals in Alpine Village who have obtained a bachelor's degree or higher.
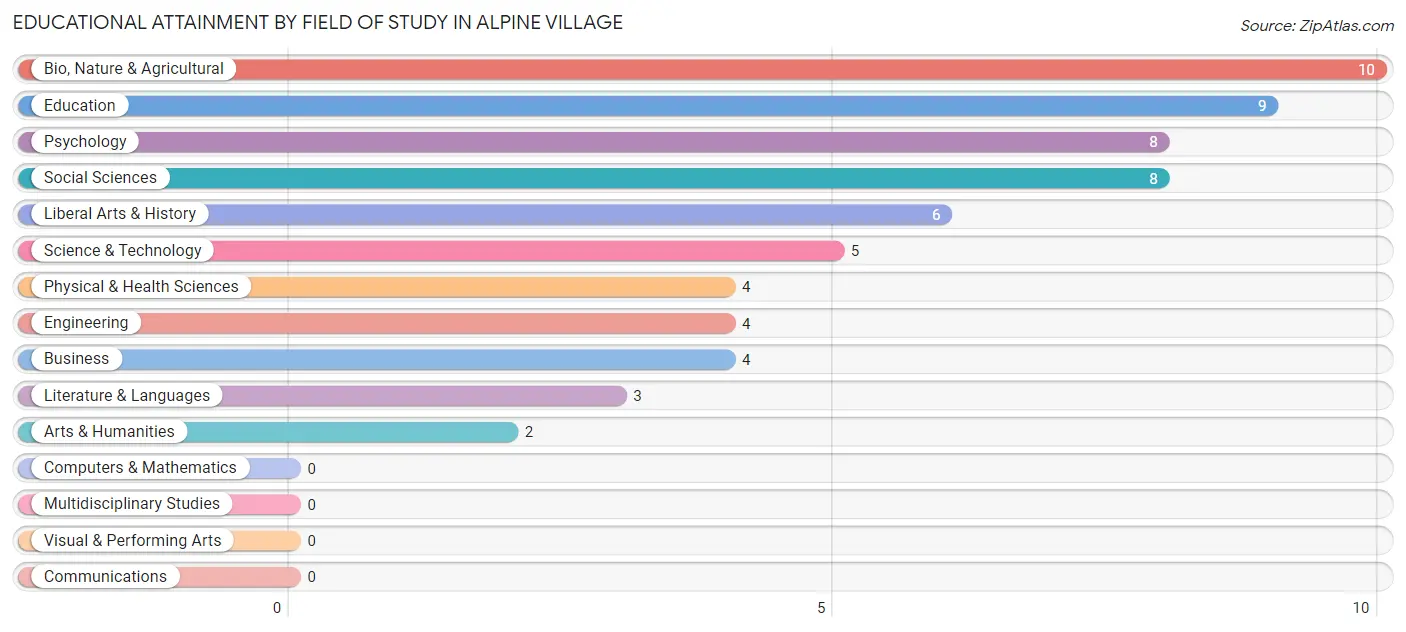
| Field of Study | # Graduates | % Graduates |
| Computers & Mathematics | 0 | 0.0% |
| Bio, Nature & Agricultural | 10 | 15.9% |
| Physical & Health Sciences | 4 | 6.4% |
| Psychology | 8 | 12.7% |
| Social Sciences | 8 | 12.7% |
| Engineering | 4 | 6.4% |
| Multidisciplinary Studies | 0 | 0.0% |
| Science & Technology | 5 | 7.9% |
| Business | 4 | 6.4% |
| Education | 9 | 14.3% |
| Literature & Languages | 3 | 4.8% |
| Liberal Arts & History | 6 | 9.5% |
| Visual & Performing Arts | 0 | 0.0% |
| Communications | 0 | 0.0% |
| Arts & Humanities | 2 | 3.2% |
| Total | 63 | 100.0% |
Transportation & Commute in Alpine Village
Vehicle Availability by Sex in Alpine Village
The most prevalent vehicle ownership categories in Alpine Village are males with 4 vehicles (62, accounting for 81.6%) and females with 4 vehicles (5, making up 193.8%).
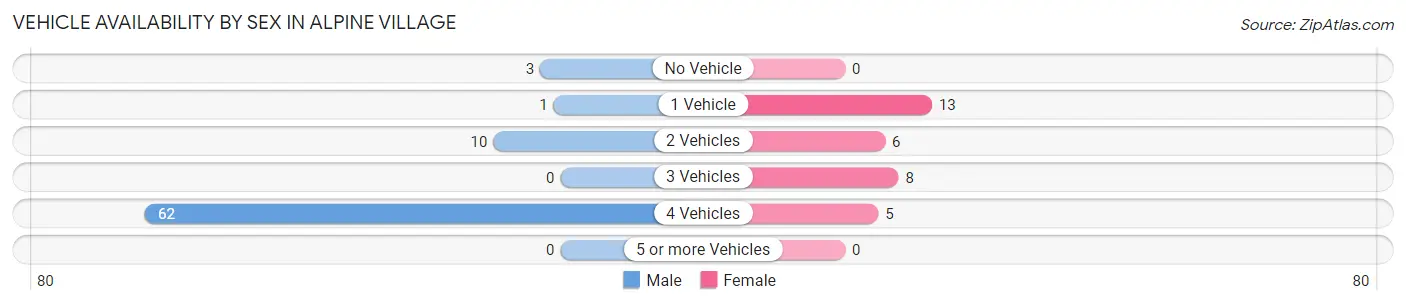
| Vehicles Available | Male | Female |
| No Vehicle | 3 (4.0%) | 0 (0.0%) |
| 1 Vehicle | 1 (1.3%) | 13 (40.6%) |
| 2 Vehicles | 10 (13.2%) | 6 (18.8%) |
| 3 Vehicles | 0 (0.0%) | 8 (25.0%) |
| 4 Vehicles | 62 (81.6%) | 5 (15.6%) |
| 5 or more Vehicles | 0 (0.0%) | 0 (0.0%) |
| Total | 76 (100.0%) | 32 (100.0%) |
Commute Time in Alpine Village
The most frequently occuring commute durations in Alpine Village are 5 to 9 minutes (60 commuters, 61.9%), 10 to 14 minutes (9 commuters, 9.3%), and 40 to 44 minutes (7 commuters, 7.2%).
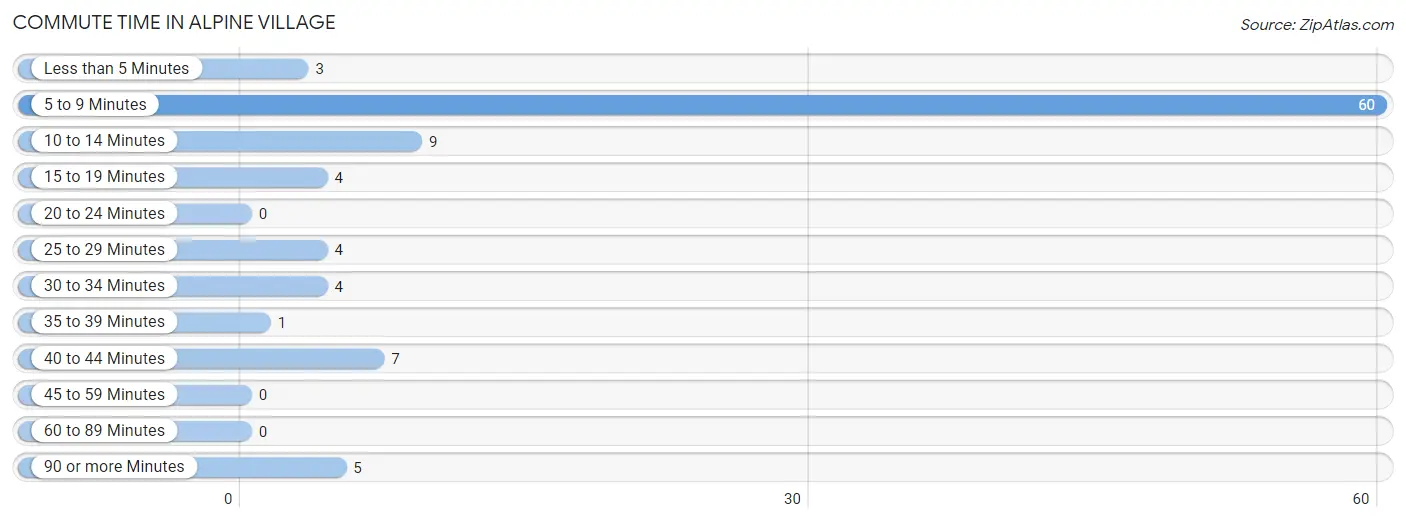
| Commute Time | # Commuters | % Commuters |
| Less than 5 Minutes | 3 | 3.1% |
| 5 to 9 Minutes | 60 | 61.9% |
| 10 to 14 Minutes | 9 | 9.3% |
| 15 to 19 Minutes | 4 | 4.1% |
| 20 to 24 Minutes | 0 | 0.0% |
| 25 to 29 Minutes | 4 | 4.1% |
| 30 to 34 Minutes | 4 | 4.1% |
| 35 to 39 Minutes | 1 | 1.0% |
| 40 to 44 Minutes | 7 | 7.2% |
| 45 to 59 Minutes | 0 | 0.0% |
| 60 to 89 Minutes | 0 | 0.0% |
| 90 or more Minutes | 5 | 5.1% |
Commute Time by Sex in Alpine Village
The most common commute times in Alpine Village are 5 to 9 minutes (57 commuters, 75.0%) for males and 10 to 14 minutes (9 commuters, 42.9%) for females.
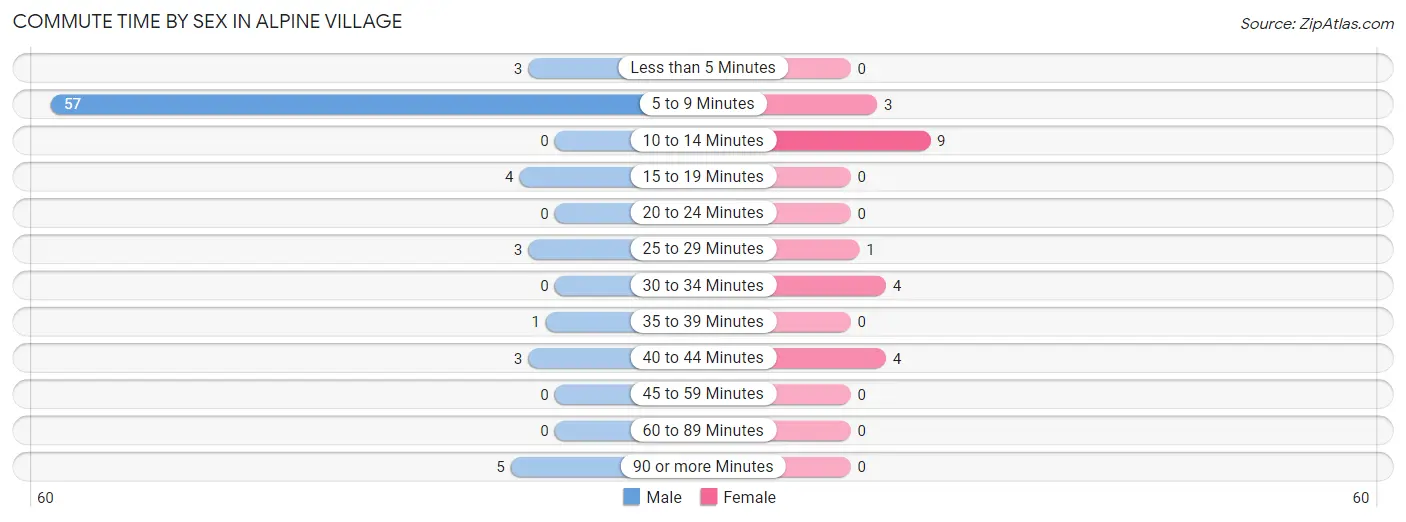
| Commute Time | Male | Female |
| Less than 5 Minutes | 3 (4.0%) | 0 (0.0%) |
| 5 to 9 Minutes | 57 (75.0%) | 3 (14.3%) |
| 10 to 14 Minutes | 0 (0.0%) | 9 (42.9%) |
| 15 to 19 Minutes | 4 (5.3%) | 0 (0.0%) |
| 20 to 24 Minutes | 0 (0.0%) | 0 (0.0%) |
| 25 to 29 Minutes | 3 (4.0%) | 1 (4.8%) |
| 30 to 34 Minutes | 0 (0.0%) | 4 (19.1%) |
| 35 to 39 Minutes | 1 (1.3%) | 0 (0.0%) |
| 40 to 44 Minutes | 3 (4.0%) | 4 (19.1%) |
| 45 to 59 Minutes | 0 (0.0%) | 0 (0.0%) |
| 60 to 89 Minutes | 0 (0.0%) | 0 (0.0%) |
| 90 or more Minutes | 5 (6.6%) | 0 (0.0%) |
Time of Departure to Work by Sex in Alpine Village
The most frequent times of departure to work in Alpine Village are 7:00 AM to 7:29 AM (63, 82.9%) for males and 8:30 AM to 8:59 AM (12, 57.1%) for females.
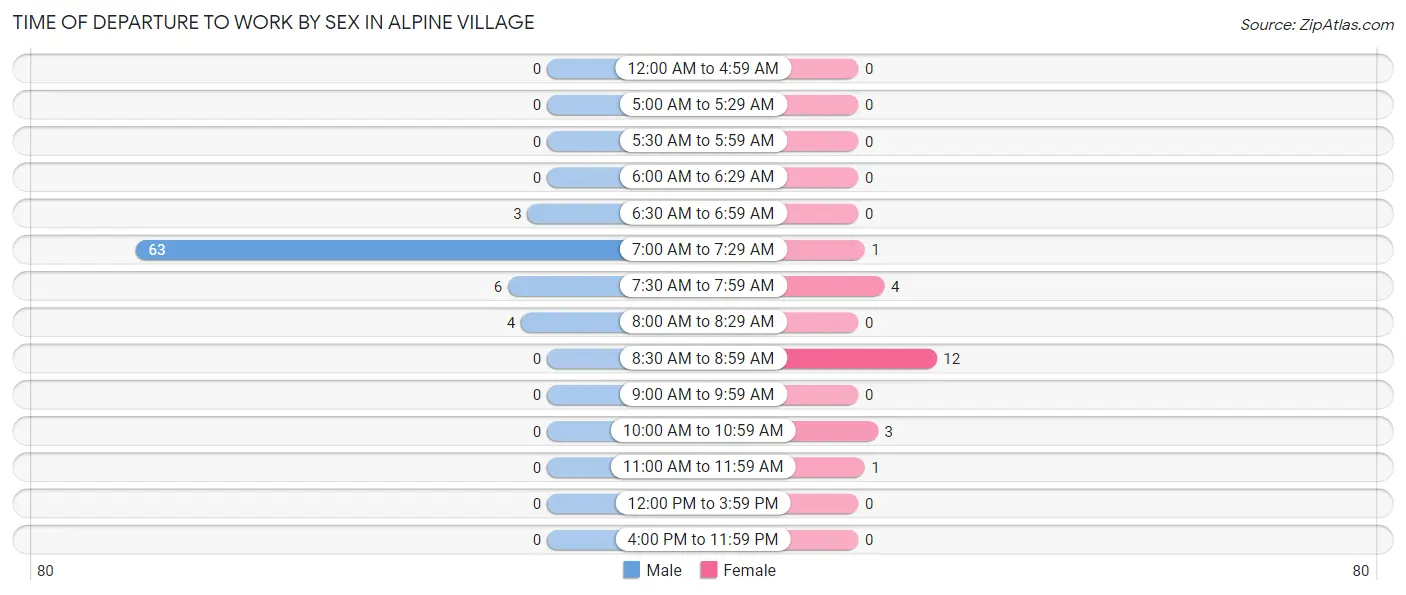
| Time of Departure | Male | Female |
| 12:00 AM to 4:59 AM | 0 (0.0%) | 0 (0.0%) |
| 5:00 AM to 5:29 AM | 0 (0.0%) | 0 (0.0%) |
| 5:30 AM to 5:59 AM | 0 (0.0%) | 0 (0.0%) |
| 6:00 AM to 6:29 AM | 0 (0.0%) | 0 (0.0%) |
| 6:30 AM to 6:59 AM | 3 (4.0%) | 0 (0.0%) |
| 7:00 AM to 7:29 AM | 63 (82.9%) | 1 (4.8%) |
| 7:30 AM to 7:59 AM | 6 (7.9%) | 4 (19.1%) |
| 8:00 AM to 8:29 AM | 4 (5.3%) | 0 (0.0%) |
| 8:30 AM to 8:59 AM | 0 (0.0%) | 12 (57.1%) |
| 9:00 AM to 9:59 AM | 0 (0.0%) | 0 (0.0%) |
| 10:00 AM to 10:59 AM | 0 (0.0%) | 3 (14.3%) |
| 11:00 AM to 11:59 AM | 0 (0.0%) | 1 (4.8%) |
| 12:00 PM to 3:59 PM | 0 (0.0%) | 0 (0.0%) |
| 4:00 PM to 11:59 PM | 0 (0.0%) | 0 (0.0%) |
| Total | 76 (100.0%) | 21 (100.0%) |
Housing Occupancy in Alpine Village
Occupancy by Ownership in Alpine Village
Of the total 92 dwellings in Alpine Village, owner-occupied units account for 85 (92.4%), while renter-occupied units make up 7 (7.6%).
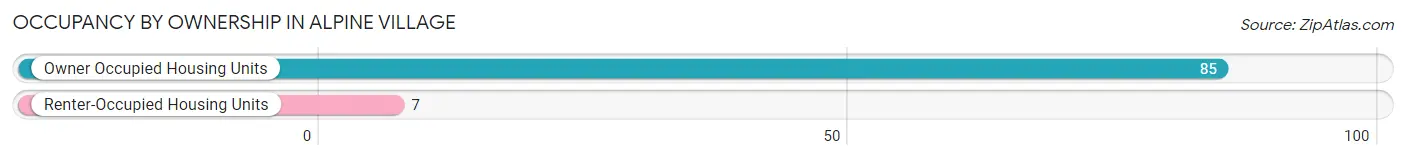
| Occupancy | # Housing Units | % Housing Units |
| Owner Occupied Housing Units | 85 | 92.4% |
| Renter-Occupied Housing Units | 7 | 7.6% |
| Total Occupied Housing Units | 92 | 100.0% |
Occupancy by Household Size in Alpine Village
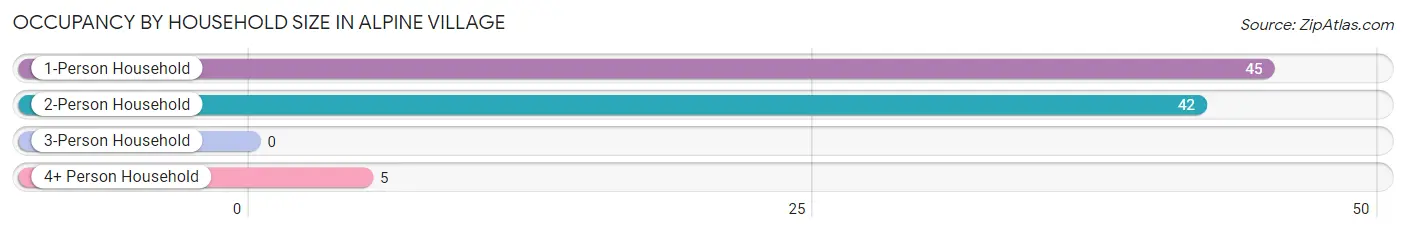
| Household Size | # Housing Units | % Housing Units |
| 1-Person Household | 45 | 48.9% |
| 2-Person Household | 42 | 45.7% |
| 3-Person Household | 0 | 0.0% |
| 4+ Person Household | 5 | 5.4% |
| Total Housing Units | 92 | 100.0% |
Occupancy by Ownership by Household Size in Alpine Village
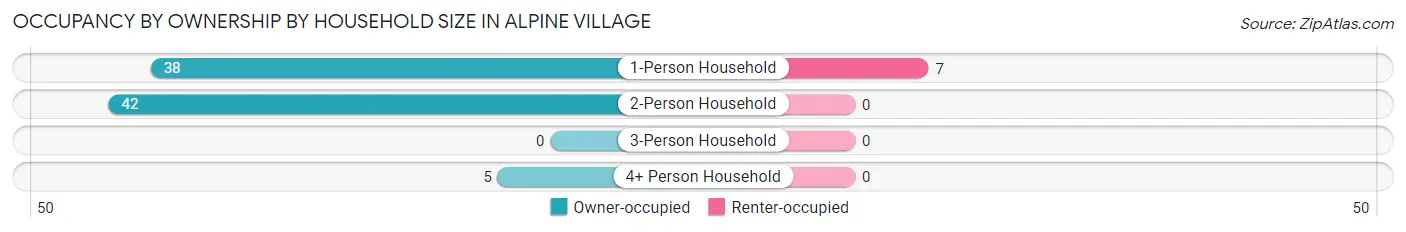
| Household Size | Owner-occupied | Renter-occupied |
| 1-Person Household | 38 (84.4%) | 7 (15.6%) |
| 2-Person Household | 42 (100.0%) | 0 (0.0%) |
| 3-Person Household | 0 (0.0%) | 0 (0.0%) |
| 4+ Person Household | 5 (100.0%) | 0 (0.0%) |
| Total Housing Units | 85 (92.4%) | 7 (7.6%) |
Occupancy by Educational Attainment in Alpine Village
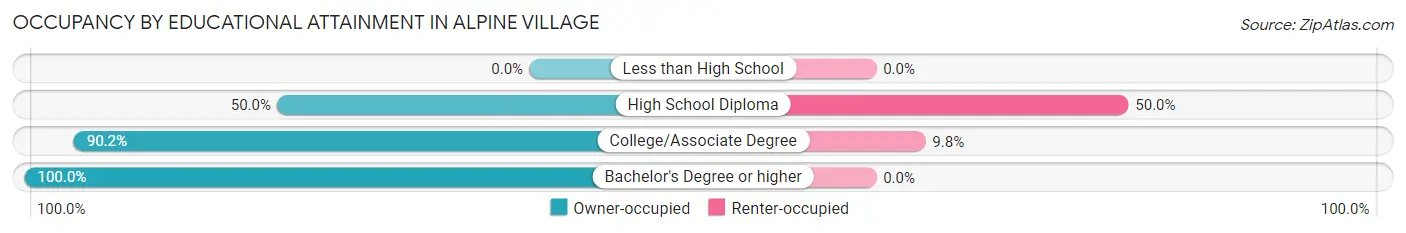
| Household Size | Owner-occupied | Renter-occupied |
| Less than High School | 0 (0.0%) | 0 (0.0%) |
| High School Diploma | 3 (50.0%) | 3 (50.0%) |
| College/Associate Degree | 37 (90.2%) | 4 (9.8%) |
| Bachelor's Degree or higher | 45 (100.0%) | 0 (0.0%) |
Occupancy by Age of Householder in Alpine Village
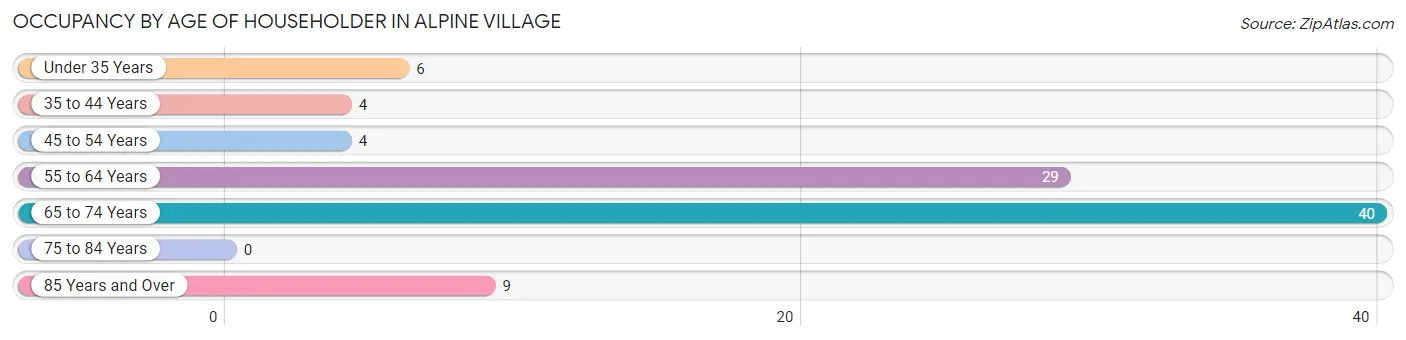
| Age Bracket | # Households | % Households |
| Under 35 Years | 6 | 6.5% |
| 35 to 44 Years | 4 | 4.3% |
| 45 to 54 Years | 4 | 4.3% |
| 55 to 64 Years | 29 | 31.5% |
| 65 to 74 Years | 40 | 43.5% |
| 75 to 84 Years | 0 | 0.0% |
| 85 Years and Over | 9 | 9.8% |
| Total | 92 | 100.0% |
Housing Finances in Alpine Village
Median Income by Occupancy in Alpine Village
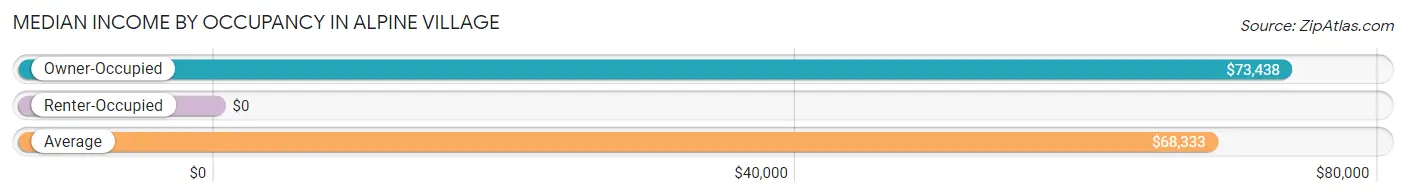
| Occupancy Type | # Households | Median Income |
| Owner-Occupied | 85 (92.4%) | $73,438 |
| Renter-Occupied | 7 (7.6%) | $0 |
| Average | 92 (100.0%) | $68,333 |
Occupancy by Householder Income Bracket in Alpine Village
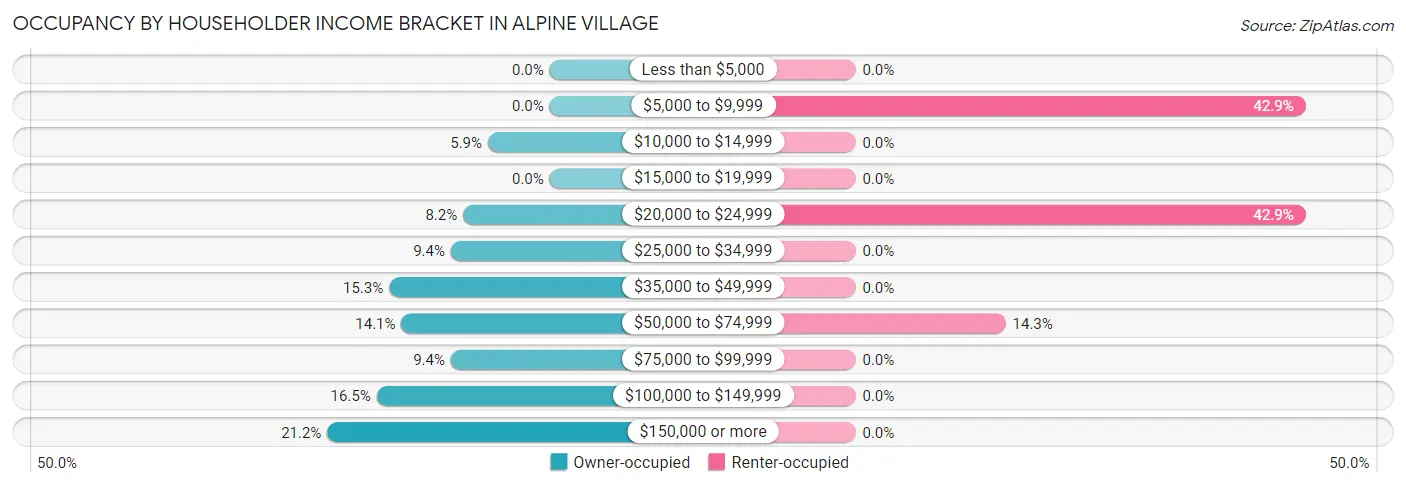
| Income Bracket | Owner-occupied | Renter-occupied |
| Less than $5,000 | 0 (0.0%) | 0 (0.0%) |
| $5,000 to $9,999 | 0 (0.0%) | 3 (42.9%) |
| $10,000 to $14,999 | 5 (5.9%) | 0 (0.0%) |
| $15,000 to $19,999 | 0 (0.0%) | 0 (0.0%) |
| $20,000 to $24,999 | 7 (8.2%) | 3 (42.9%) |
| $25,000 to $34,999 | 8 (9.4%) | 0 (0.0%) |
| $35,000 to $49,999 | 13 (15.3%) | 0 (0.0%) |
| $50,000 to $74,999 | 12 (14.1%) | 1 (14.3%) |
| $75,000 to $99,999 | 8 (9.4%) | 0 (0.0%) |
| $100,000 to $149,999 | 14 (16.5%) | 0 (0.0%) |
| $150,000 or more | 18 (21.2%) | 0 (0.0%) |
| Total | 85 (100.0%) | 7 (100.0%) |
Monthly Housing Cost Tiers in Alpine Village
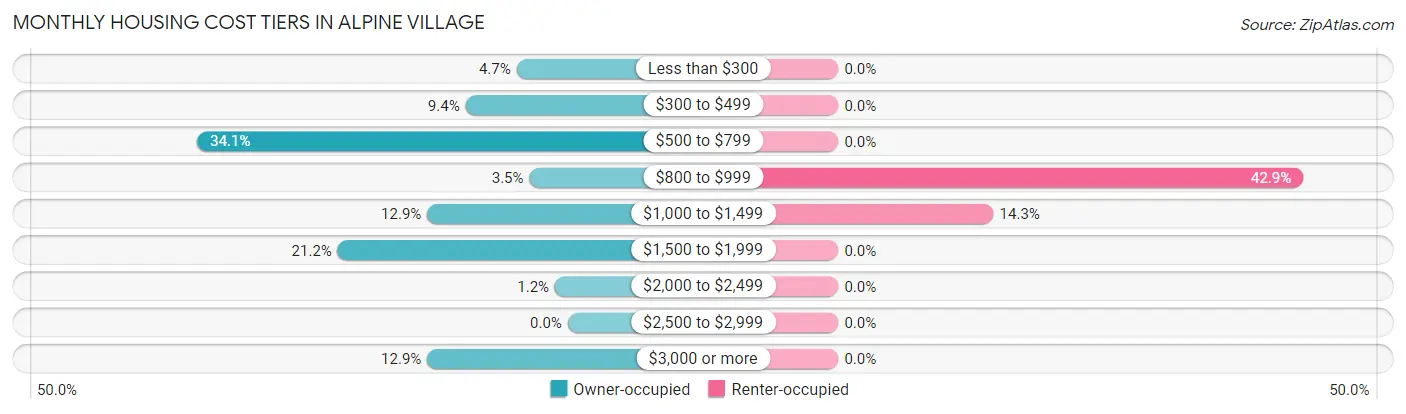
| Monthly Cost | Owner-occupied | Renter-occupied |
| Less than $300 | 4 (4.7%) | 0 (0.0%) |
| $300 to $499 | 8 (9.4%) | 0 (0.0%) |
| $500 to $799 | 29 (34.1%) | 0 (0.0%) |
| $800 to $999 | 3 (3.5%) | 3 (42.9%) |
| $1,000 to $1,499 | 11 (12.9%) | 1 (14.3%) |
| $1,500 to $1,999 | 18 (21.2%) | 0 (0.0%) |
| $2,000 to $2,499 | 1 (1.2%) | 0 (0.0%) |
| $2,500 to $2,999 | 0 (0.0%) | 0 (0.0%) |
| $3,000 or more | 11 (12.9%) | 0 (0.0%) |
| Total | 85 (100.0%) | 7 (100.0%) |
Physical Housing Characteristics in Alpine Village
Housing Structures in Alpine Village
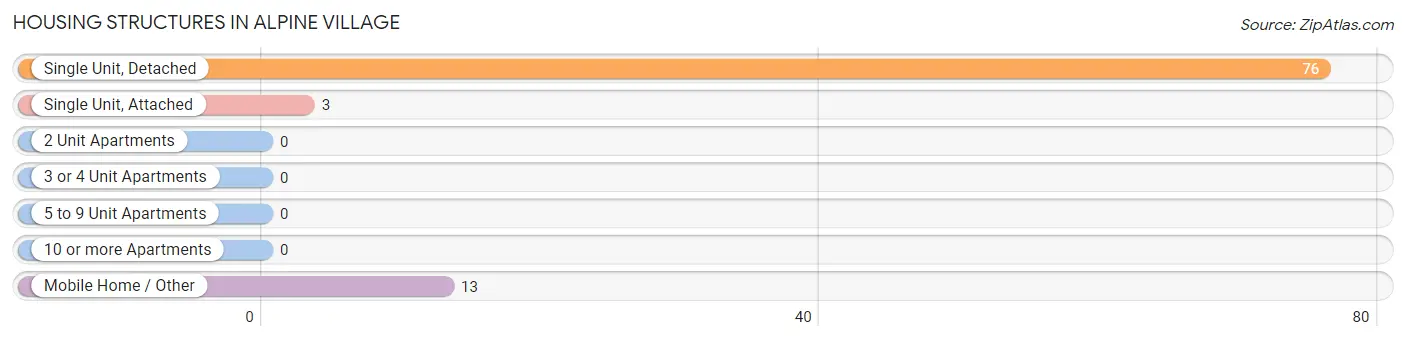
| Structure Type | # Housing Units | % Housing Units |
| Single Unit, Detached | 76 | 82.6% |
| Single Unit, Attached | 3 | 3.3% |
| 2 Unit Apartments | 0 | 0.0% |
| 3 or 4 Unit Apartments | 0 | 0.0% |
| 5 to 9 Unit Apartments | 0 | 0.0% |
| 10 or more Apartments | 0 | 0.0% |
| Mobile Home / Other | 13 | 14.1% |
| Total | 92 | 100.0% |
Housing Structures by Occupancy in Alpine Village
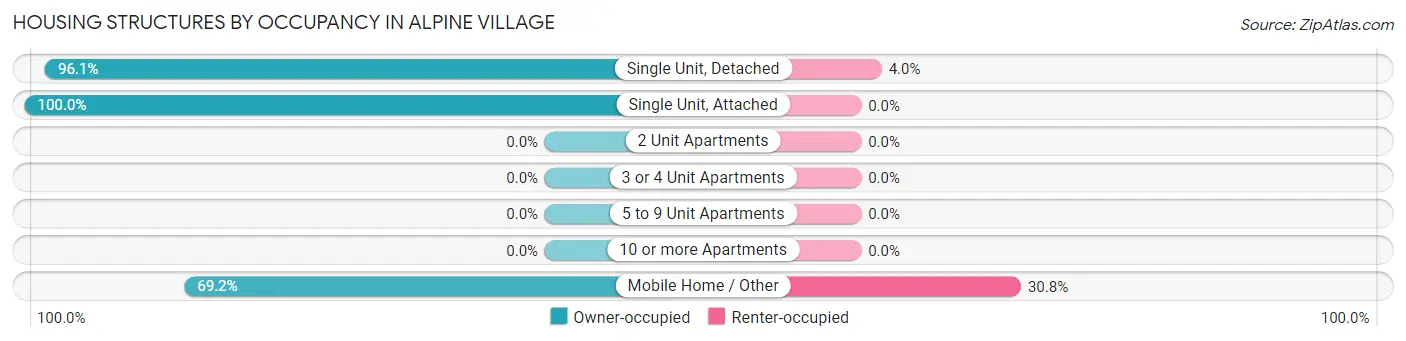
| Structure Type | Owner-occupied | Renter-occupied |
| Single Unit, Detached | 73 (96.1%) | 3 (4.0%) |
| Single Unit, Attached | 3 (100.0%) | 0 (0.0%) |
| 2 Unit Apartments | 0 (0.0%) | 0 (0.0%) |
| 3 or 4 Unit Apartments | 0 (0.0%) | 0 (0.0%) |
| 5 to 9 Unit Apartments | 0 (0.0%) | 0 (0.0%) |
| 10 or more Apartments | 0 (0.0%) | 0 (0.0%) |
| Mobile Home / Other | 9 (69.2%) | 4 (30.8%) |
| Total | 85 (92.4%) | 7 (7.6%) |
Housing Structures by Number of Rooms in Alpine Village
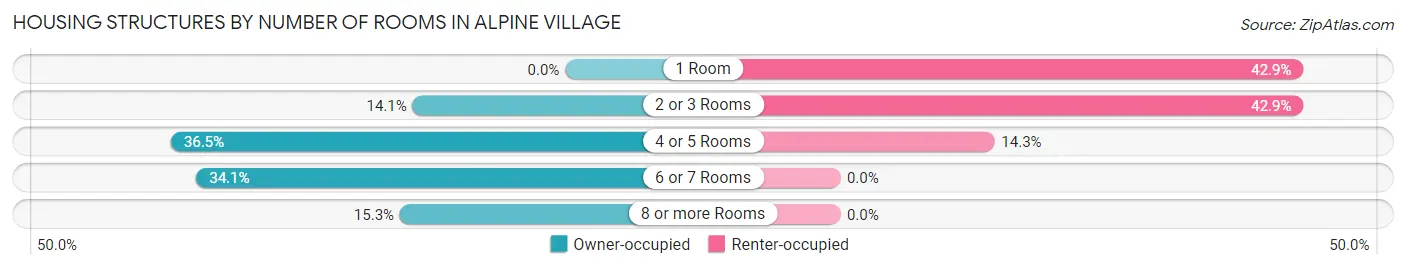
| Number of Rooms | Owner-occupied | Renter-occupied |
| 1 Room | 0 (0.0%) | 3 (42.9%) |
| 2 or 3 Rooms | 12 (14.1%) | 3 (42.9%) |
| 4 or 5 Rooms | 31 (36.5%) | 1 (14.3%) |
| 6 or 7 Rooms | 29 (34.1%) | 0 (0.0%) |
| 8 or more Rooms | 13 (15.3%) | 0 (0.0%) |
| Total | 85 (100.0%) | 7 (100.0%) |
Housing Structure by Heating Type in Alpine Village
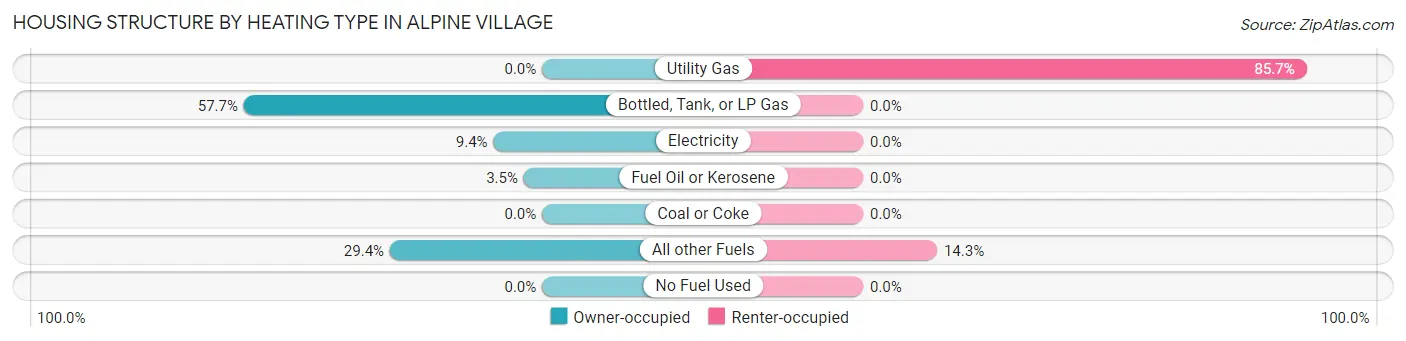
| Heating Type | Owner-occupied | Renter-occupied |
| Utility Gas | 0 (0.0%) | 6 (85.7%) |
| Bottled, Tank, or LP Gas | 49 (57.7%) | 0 (0.0%) |
| Electricity | 8 (9.4%) | 0 (0.0%) |
| Fuel Oil or Kerosene | 3 (3.5%) | 0 (0.0%) |
| Coal or Coke | 0 (0.0%) | 0 (0.0%) |
| All other Fuels | 25 (29.4%) | 1 (14.3%) |
| No Fuel Used | 0 (0.0%) | 0 (0.0%) |
| Total | 85 (100.0%) | 7 (100.0%) |
Household Vehicle Usage in Alpine Village
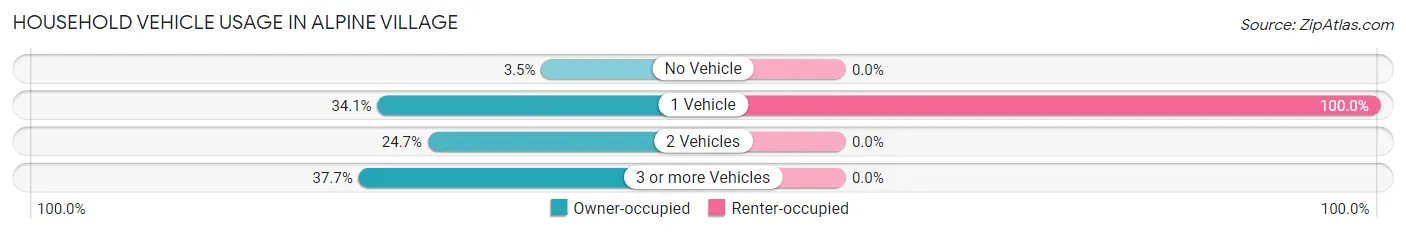
| Vehicles per Household | Owner-occupied | Renter-occupied |
| No Vehicle | 3 (3.5%) | 0 (0.0%) |
| 1 Vehicle | 29 (34.1%) | 7 (100.0%) |
| 2 Vehicles | 21 (24.7%) | 0 (0.0%) |
| 3 or more Vehicles | 32 (37.7%) | 0 (0.0%) |
| Total | 85 (100.0%) | 7 (100.0%) |
Real Estate & Mortgages in Alpine Village
Real Estate and Mortgage Overview in Alpine Village
| Characteristic | Without Mortgage | With Mortgage |
| Housing Units | 61 | 24 |
| Median Property Value | $475,000 | $385,700 |
| Median Household Income | - | - |
| Monthly Housing Costs | $684 | $8 |
| Real Estate Taxes | $3,667 | $0 |
Property Value by Mortgage Status in Alpine Village
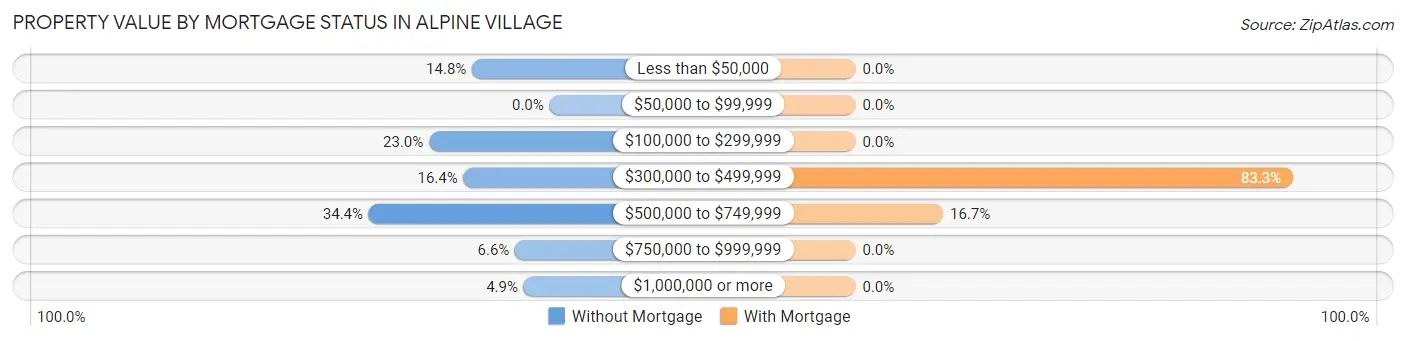
| Property Value | Without Mortgage | With Mortgage |
| Less than $50,000 | 9 (14.7%) | 0 (0.0%) |
| $50,000 to $99,999 | 0 (0.0%) | 0 (0.0%) |
| $100,000 to $299,999 | 14 (23.0%) | 0 (0.0%) |
| $300,000 to $499,999 | 10 (16.4%) | 20 (83.3%) |
| $500,000 to $749,999 | 21 (34.4%) | 4 (16.7%) |
| $750,000 to $999,999 | 4 (6.6%) | 0 (0.0%) |
| $1,000,000 or more | 3 (4.9%) | 0 (0.0%) |
| Total | 61 (100.0%) | 24 (100.0%) |
Household Income by Mortgage Status in Alpine Village
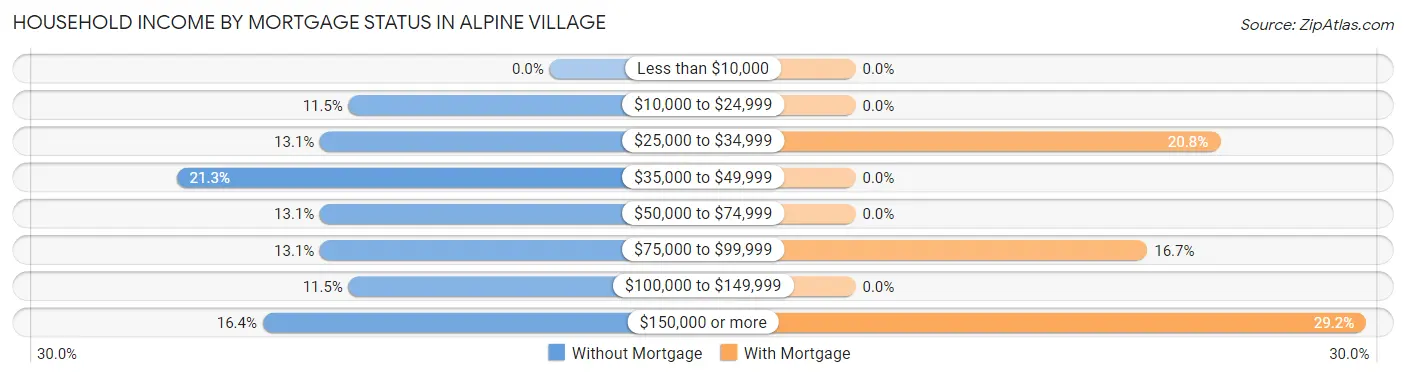
| Household Income | Without Mortgage | With Mortgage |
| Less than $10,000 | 0 (0.0%) | 0 (0.0%) |
| $10,000 to $24,999 | 7 (11.5%) | 0 (0.0%) |
| $25,000 to $34,999 | 8 (13.1%) | 5 (20.8%) |
| $35,000 to $49,999 | 13 (21.3%) | 0 (0.0%) |
| $50,000 to $74,999 | 8 (13.1%) | 0 (0.0%) |
| $75,000 to $99,999 | 8 (13.1%) | 4 (16.7%) |
| $100,000 to $149,999 | 7 (11.5%) | 0 (0.0%) |
| $150,000 or more | 10 (16.4%) | 7 (29.2%) |
| Total | 61 (100.0%) | 24 (100.0%) |
Property Value to Household Income Ratio in Alpine Village
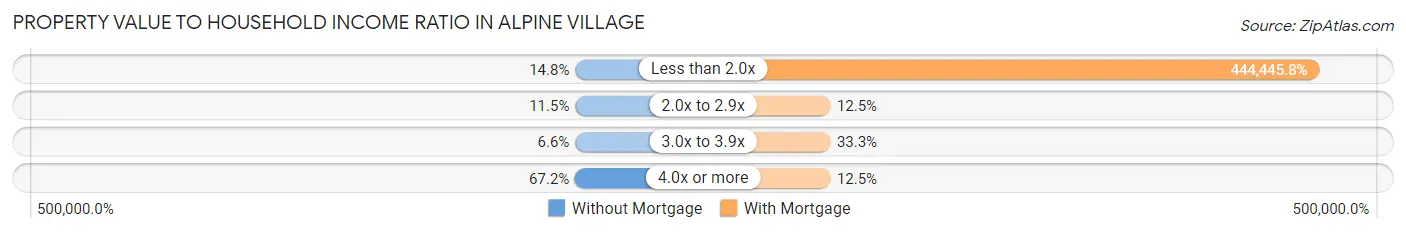
| Value-to-Income Ratio | Without Mortgage | With Mortgage |
| Less than 2.0x | 9 (14.7%) | 106,667 (444,445.8%) |
| 2.0x to 2.9x | 7 (11.5%) | 3 (12.5%) |
| 3.0x to 3.9x | 4 (6.6%) | 8 (33.3%) |
| 4.0x or more | 41 (67.2%) | 3 (12.5%) |
| Total | 61 (100.0%) | 24 (100.0%) |
Real Estate Taxes by Mortgage Status in Alpine Village
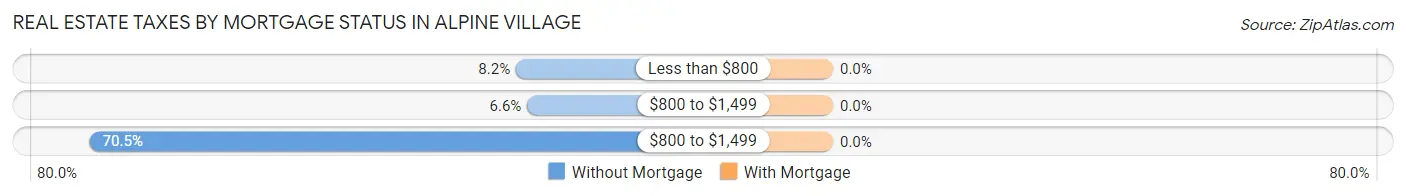
| Property Taxes | Without Mortgage | With Mortgage |
| Less than $800 | 5 (8.2%) | 0 (0.0%) |
| $800 to $1,499 | 4 (6.6%) | 0 (0.0%) |
| $800 to $1,499 | 43 (70.5%) | 0 (0.0%) |
| Total | 61 (100.0%) | 24 (100.0%) |
Health & Disability in Alpine Village
Health Insurance Coverage by Age in Alpine Village
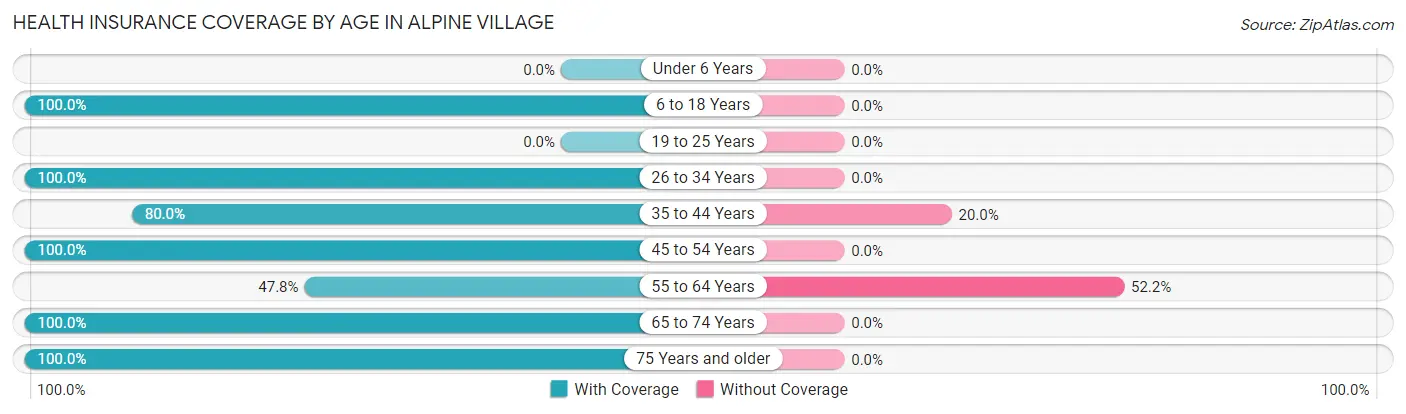
| Age Bracket | With Coverage | Without Coverage |
| Under 6 Years | 0 (0.0%) | 0 (0.0%) |
| 6 to 18 Years | 63 (100.0%) | 0 (0.0%) |
| 19 to 25 Years | 0 (0.0%) | 0 (0.0%) |
| 26 to 34 Years | 12 (100.0%) | 0 (0.0%) |
| 35 to 44 Years | 4 (80.0%) | 1 (20.0%) |
| 45 to 54 Years | 6 (100.0%) | 0 (0.0%) |
| 55 to 64 Years | 33 (47.8%) | 36 (52.2%) |
| 65 to 74 Years | 48 (100.0%) | 0 (0.0%) |
| 75 Years and older | 17 (100.0%) | 0 (0.0%) |
| Total | 183 (83.2%) | 37 (16.8%) |
Health Insurance Coverage by Citizenship Status in Alpine Village
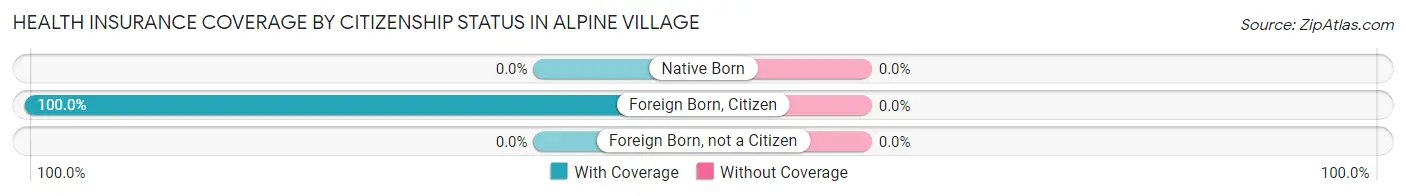
| Citizenship Status | With Coverage | Without Coverage |
| Native Born | 0 (0.0%) | 0 (0.0%) |
| Foreign Born, Citizen | 63 (100.0%) | 0 (0.0%) |
| Foreign Born, not a Citizen | 0 (0.0%) | 0 (0.0%) |
Health Insurance Coverage by Household Income in Alpine Village
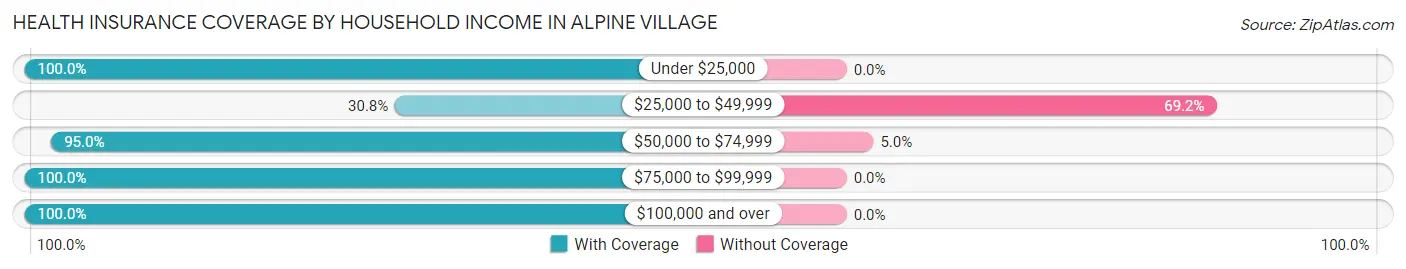
| Household Income | With Coverage | Without Coverage |
| Under $25,000 | 18 (100.0%) | 0 (0.0%) |
| $25,000 to $49,999 | 16 (30.8%) | 36 (69.2%) |
| $50,000 to $74,999 | 19 (95.0%) | 1 (5.0%) |
| $75,000 to $99,999 | 13 (100.0%) | 0 (0.0%) |
| $100,000 and over | 117 (100.0%) | 0 (0.0%) |
Public vs Private Health Insurance Coverage by Age in Alpine Village
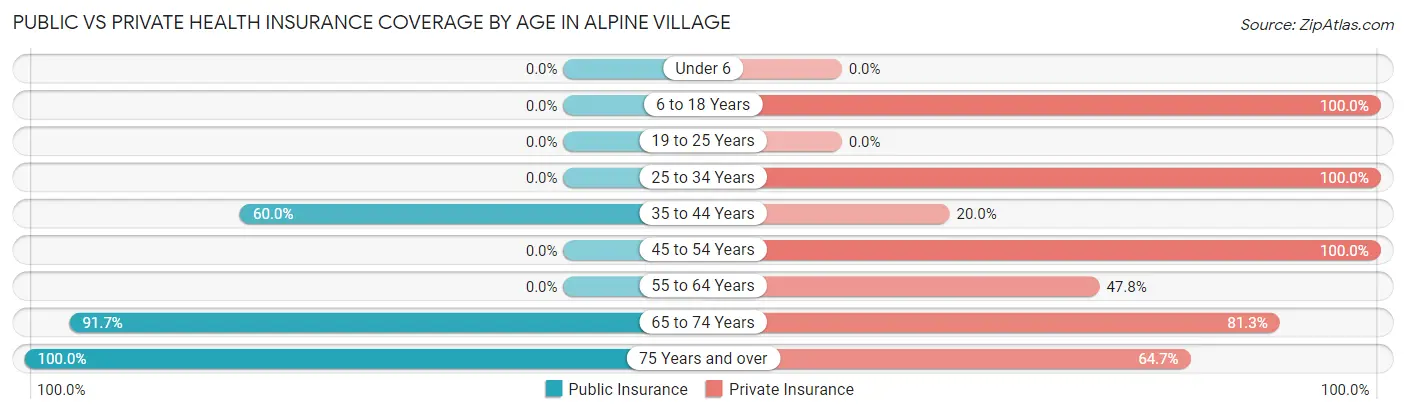
| Age Bracket | Public Insurance | Private Insurance |
| Under 6 | 0 (0.0%) | 0 (0.0%) |
| 6 to 18 Years | 0 (0.0%) | 63 (100.0%) |
| 19 to 25 Years | 0 (0.0%) | 0 (0.0%) |
| 25 to 34 Years | 0 (0.0%) | 12 (100.0%) |
| 35 to 44 Years | 3 (60.0%) | 1 (20.0%) |
| 45 to 54 Years | 0 (0.0%) | 6 (100.0%) |
| 55 to 64 Years | 0 (0.0%) | 33 (47.8%) |
| 65 to 74 Years | 44 (91.7%) | 39 (81.2%) |
| 75 Years and over | 17 (100.0%) | 11 (64.7%) |
| Total | 64 (29.1%) | 165 (75.0%) |
Disability Status by Sex by Age in Alpine Village
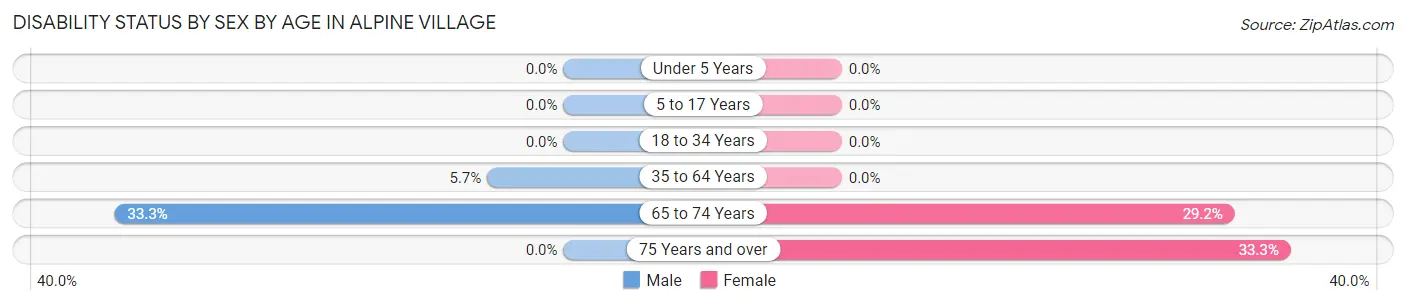
| Age Bracket | Male | Female |
| Under 5 Years | 0 (0.0%) | 0 (0.0%) |
| 5 to 17 Years | 0 (0.0%) | 0 (0.0%) |
| 18 to 34 Years | 0 (0.0%) | 0 (0.0%) |
| 35 to 64 Years | 3 (5.7%) | 0 (0.0%) |
| 65 to 74 Years | 8 (33.3%) | 7 (29.2%) |
| 75 Years and over | 0 (0.0%) | 3 (33.3%) |
Disability Class by Sex by Age in Alpine Village
Disability Class: Hearing Difficulty
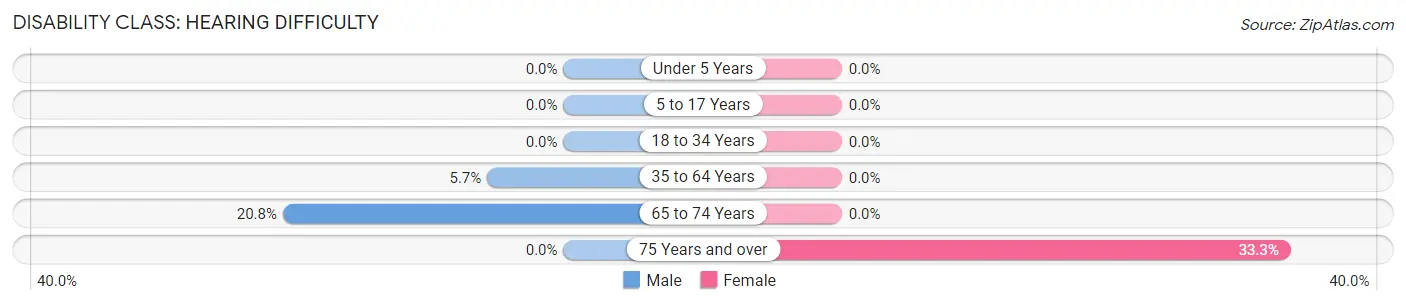
| Age Bracket | Male | Female |
| Under 5 Years | 0 (0.0%) | 0 (0.0%) |
| 5 to 17 Years | 0 (0.0%) | 0 (0.0%) |
| 18 to 34 Years | 0 (0.0%) | 0 (0.0%) |
| 35 to 64 Years | 3 (5.7%) | 0 (0.0%) |
| 65 to 74 Years | 5 (20.8%) | 0 (0.0%) |
| 75 Years and over | 0 (0.0%) | 3 (33.3%) |
Disability Class: Vision Difficulty
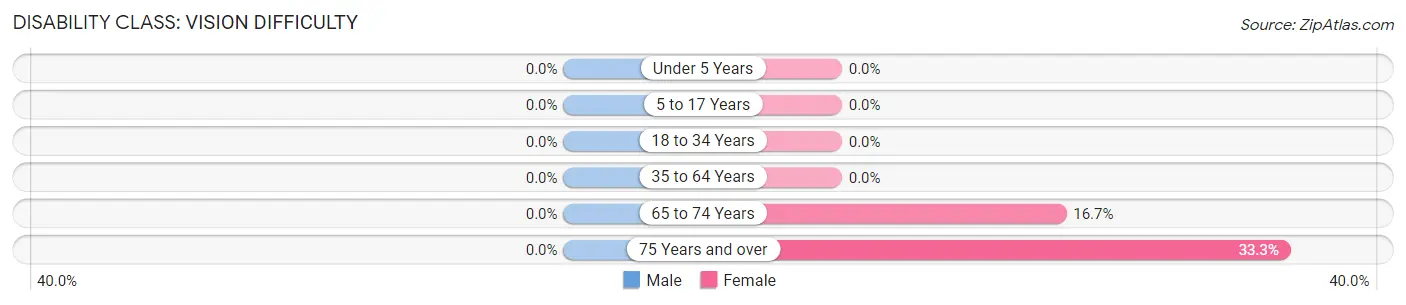
| Age Bracket | Male | Female |
| Under 5 Years | 0 (0.0%) | 0 (0.0%) |
| 5 to 17 Years | 0 (0.0%) | 0 (0.0%) |
| 18 to 34 Years | 0 (0.0%) | 0 (0.0%) |
| 35 to 64 Years | 0 (0.0%) | 0 (0.0%) |
| 65 to 74 Years | 0 (0.0%) | 4 (16.7%) |
| 75 Years and over | 0 (0.0%) | 3 (33.3%) |
Disability Class: Cognitive Difficulty
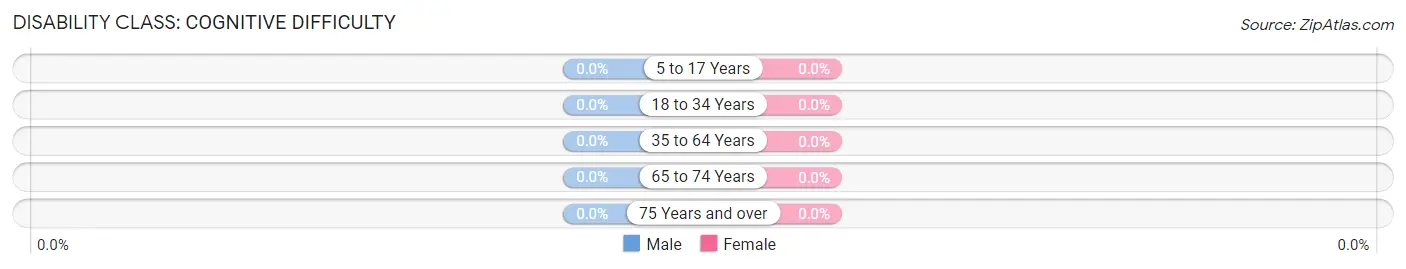
| Age Bracket | Male | Female |
| 5 to 17 Years | 0 (0.0%) | 0 (0.0%) |
| 18 to 34 Years | 0 (0.0%) | 0 (0.0%) |
| 35 to 64 Years | 0 (0.0%) | 0 (0.0%) |
| 65 to 74 Years | 0 (0.0%) | 0 (0.0%) |
| 75 Years and over | 0 (0.0%) | 0 (0.0%) |
Disability Class: Ambulatory Difficulty
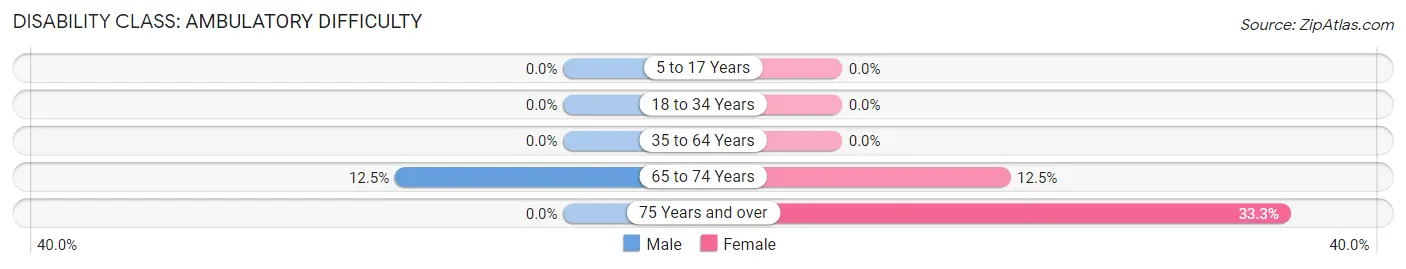
| Age Bracket | Male | Female |
| 5 to 17 Years | 0 (0.0%) | 0 (0.0%) |
| 18 to 34 Years | 0 (0.0%) | 0 (0.0%) |
| 35 to 64 Years | 0 (0.0%) | 0 (0.0%) |
| 65 to 74 Years | 3 (12.5%) | 3 (12.5%) |
| 75 Years and over | 0 (0.0%) | 3 (33.3%) |
Disability Class: Self-Care Difficulty
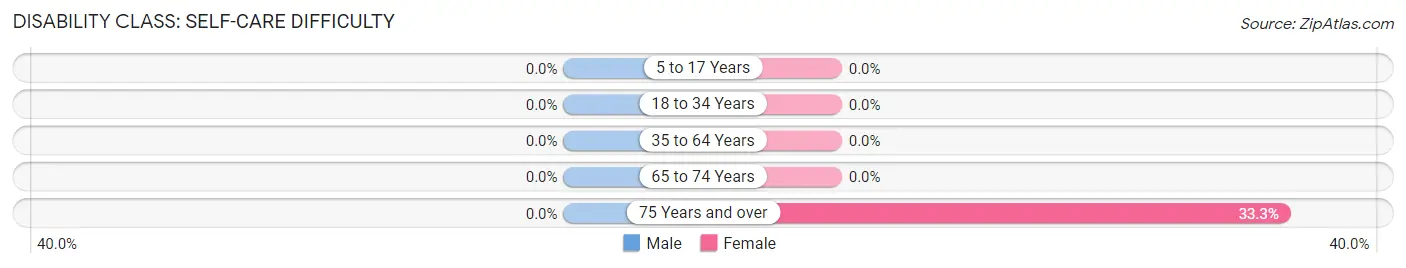
| Age Bracket | Male | Female |
| 5 to 17 Years | 0 (0.0%) | 0 (0.0%) |
| 18 to 34 Years | 0 (0.0%) | 0 (0.0%) |
| 35 to 64 Years | 0 (0.0%) | 0 (0.0%) |
| 65 to 74 Years | 0 (0.0%) | 0 (0.0%) |
| 75 Years and over | 0 (0.0%) | 3 (33.3%) |
Technology Access in Alpine Village
Computing Device Access in Alpine Village
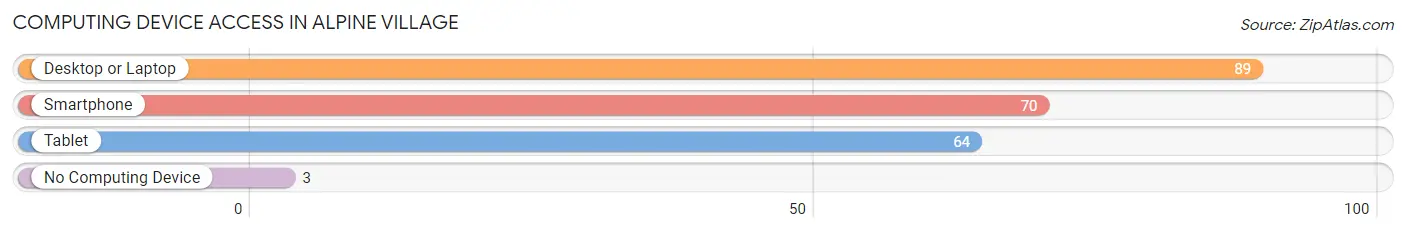
| Device Type | # Households | % Households |
| Desktop or Laptop | 89 | 96.7% |
| Smartphone | 70 | 76.1% |
| Tablet | 64 | 69.6% |
| No Computing Device | 3 | 3.3% |
| Total | 92 | 100.0% |
Internet Access in Alpine Village
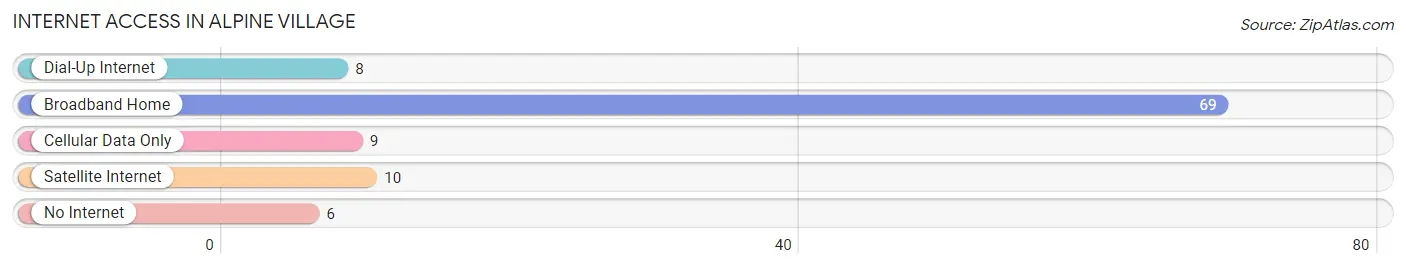
| Internet Type | # Households | % Households |
| Dial-Up Internet | 8 | 8.7% |
| Broadband Home | 69 | 75.0% |
| Cellular Data Only | 9 | 9.8% |
| Satellite Internet | 10 | 10.9% |
| No Internet | 6 | 6.5% |
| Total | 92 | 100.0% |
Alpine Village Summary
Alpine Village is a small unincorporated community located in Los Angeles County, California. It is situated in the San Gabriel Mountains, approximately 25 miles northeast of downtown Los Angeles. The village is surrounded by the Angeles National Forest and is home to a population of approximately 1,000 people.
History
Alpine Village was founded in the late 19th century by German immigrants who were looking for a place to settle and start a new life. The village was originally known as “Alpine” and was home to a small population of German-speaking settlers. The village was officially incorporated in 1909 and was renamed “Alpine Village” in 1910.
The village was a popular destination for tourists and outdoor enthusiasts in the early 20th century. It was home to a number of resorts, including the Alpine Inn, which was built in 1910 and is still in operation today. The village also had a post office, a general store, and a school.
In the 1950s, the village began to decline as the population shifted to larger cities. The village was eventually annexed by the City of Los Angeles in the 1970s.
Geography
Alpine Village is located in the San Gabriel Mountains, approximately 25 miles northeast of downtown Los Angeles. The village is situated at an elevation of 3,000 feet and is surrounded by the Angeles National Forest. The village is located in a valley and is bordered by the San Gabriel River to the north and the San Gabriel Mountains to the south.
The climate in Alpine Village is mild and temperate, with temperatures ranging from the low 40s in the winter to the high 80s in the summer. The village receives an average of 15 inches of precipitation per year, with most of it falling in the winter months.
Economy
Alpine Village is a small, rural community with a limited economy. The village is home to a number of small businesses, including a general store, a post office, and a few restaurants. The village also has a few small tourist attractions, including the Alpine Inn and the Alpine Museum.
The village is also home to a number of outdoor recreation activities, including hiking, camping, and fishing. The village is also a popular destination for snow sports in the winter months.
Demographics
As of the 2010 census, the population of Alpine Village was 1,000 people. The racial makeup of the village was 94.2% White, 0.7% African American, 0.3% Native American, 0.7% Asian, 0.1% Pacific Islander, and 3.9% from other races. The median household income in the village was $45,000, and the median age was 44.
Conclusion
Alpine Village is a small, rural community located in Los Angeles County, California. The village was founded in the late 19th century by German immigrants and was officially incorporated in 1909. The village is situated in the San Gabriel Mountains and is surrounded by the Angeles National Forest. The village has a population of approximately 1,000 people and is home to a number of small businesses, tourist attractions, and outdoor recreation activities.
Common Questions
What is Per Capita Income in Alpine Village?
Per Capita income in Alpine Village is $47,888.
What is the Median Family Income in Alpine Village?
Median Family Income in Alpine Village is $106,250.
What is the Median Household income in Alpine Village?
Median Household Income in Alpine Village is $68,333.
What is Income or Wage Gap in Alpine Village?
Income or Wage Gap in Alpine Village is 81.4%.
Women in Alpine Village earn 18.6 cents for every dollar earned by a man.
What is Inequality or Gini Index in Alpine Village?
Inequality or Gini Index in Alpine Village is 0.55.
What is the Total Population of Alpine Village?
Total Population of Alpine Village is 220.
What is the Total Male Population of Alpine Village?
Total Male Population of Alpine Village is 149.
What is the Total Female Population of Alpine Village?
Total Female Population of Alpine Village is 71.
What is the Ratio of Males per 100 Females in Alpine Village?
There are 209.86 Males per 100 Females in Alpine Village.
What is the Ratio of Females per 100 Males in Alpine Village?
There are 47.65 Females per 100 Males in Alpine Village.
What is the Median Population Age in Alpine Village?
Median Population Age in Alpine Village is 56.7 Years.
What is the Average Family Size in Alpine Village
Average Family Size in Alpine Village is 3.5 People.
What is the Average Household Size in Alpine Village
Average Household Size in Alpine Village is 2.4 People.
How Large is the Labor Force in Alpine Village?
There are 113 People in the Labor Forcein in Alpine Village.
What is the Percentage of People in the Labor Force in Alpine Village?
52.3% of People are in the Labor Force in Alpine Village.
What is the Unemployment Rate in Alpine Village?
Unemployment Rate in Alpine Village is 4.4%.