Cities with the Largest South African Community in California
RELATED REPORTS & OPTIONS
South African
California
Compare Cities
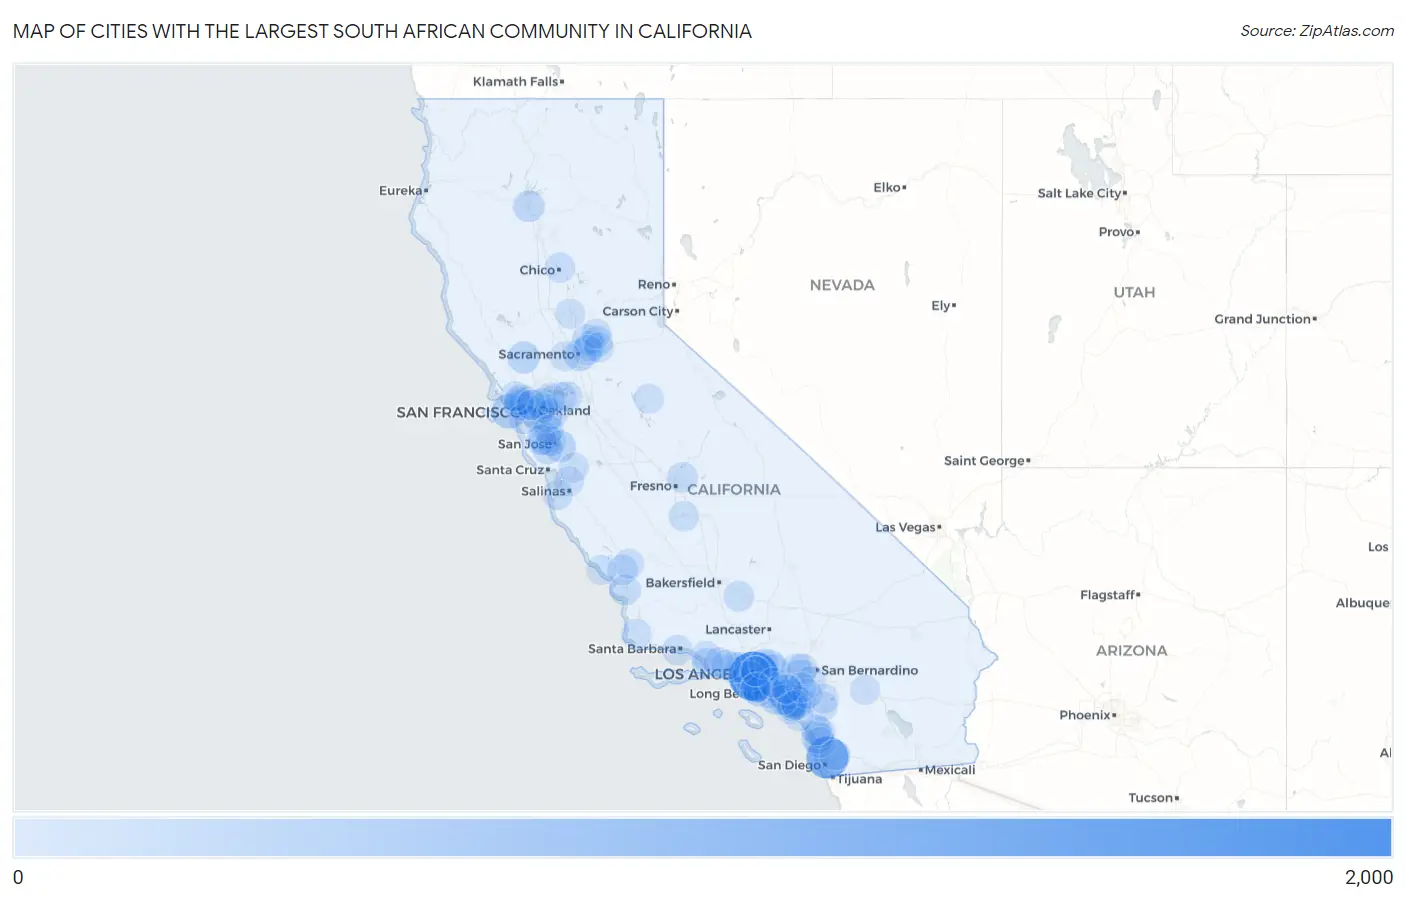
Map of Cities with the Largest South African Community in California
0
2,000
Cities with the Largest South African Community in California
| City | South African | vs State | vs National | |
| 1. | Los Angeles | 1,852 | 12,663(14.63%)#1 | 79,446(2.33%)#2 |
| 2. | San Diego | 1,136 | 12,663(8.97%)#2 | 79,446(1.43%)#3 |
| 3. | Irvine | 612 | 12,663(4.83%)#3 | 79,446(0.77%)#6 |
| 4. | San Francisco | 431 | 12,663(3.40%)#4 | 79,446(0.54%)#16 |
| 5. | Carlsbad | 225 | 12,663(1.78%)#5 | 79,446(0.28%)#29 |
| 6. | Mountain View | 223 | 12,663(1.76%)#6 | 79,446(0.28%)#30 |
| 7. | Sacramento | 215 | 12,663(1.70%)#7 | 79,446(0.27%)#33 |
| 8. | Huntington Beach | 207 | 12,663(1.63%)#8 | 79,446(0.26%)#35 |
| 9. | St Helena | 206 | 12,663(1.63%)#9 | 79,446(0.26%)#39 |
| 10. | San Jose | 201 | 12,663(1.59%)#10 | 79,446(0.25%)#40 |
| 11. | Oakland | 195 | 12,663(1.54%)#11 | 79,446(0.25%)#41 |
| 12. | Castro Valley | 170 | 12,663(1.34%)#12 | 79,446(0.21%)#51 |
| 13. | Redding | 166 | 12,663(1.31%)#13 | 79,446(0.21%)#54 |
| 14. | Temple City | 156 | 12,663(1.23%)#14 | 79,446(0.20%)#60 |
| 15. | Oxnard | 146 | 12,663(1.15%)#15 | 79,446(0.18%)#71 |
| 16. | Lake Forest | 141 | 12,663(1.11%)#16 | 79,446(0.18%)#74 |
| 17. | Agoura Hills | 141 | 12,663(1.11%)#17 | 79,446(0.18%)#75 |
| 18. | Berkeley | 137 | 12,663(1.08%)#18 | 79,446(0.17%)#79 |
| 19. | Long Beach | 133 | 12,663(1.05%)#19 | 79,446(0.17%)#81 |
| 20. | Lafayette | 123 | 12,663(0.97%)#20 | 79,446(0.15%)#93 |
| 21. | Roseville | 120 | 12,663(0.95%)#21 | 79,446(0.15%)#98 |
| 22. | Bakersfield Country Club | 120 | 12,663(0.95%)#22 | 79,446(0.15%)#99 |
| 23. | Santa Ana | 107 | 12,663(0.84%)#23 | 79,446(0.13%)#116 |
| 24. | Manhattan Beach | 107 | 12,663(0.84%)#24 | 79,446(0.13%)#120 |
| 25. | Ontario | 105 | 12,663(0.83%)#25 | 79,446(0.13%)#126 |
| 26. | Pasadena | 104 | 12,663(0.82%)#26 | 79,446(0.13%)#130 |
| 27. | Vista | 98 | 12,663(0.77%)#27 | 79,446(0.12%)#138 |
| 28. | Encinitas | 97 | 12,663(0.77%)#28 | 79,446(0.12%)#142 |
| 29. | San Ramon | 96 | 12,663(0.76%)#29 | 79,446(0.12%)#145 |
| 30. | Santee | 96 | 12,663(0.76%)#30 | 79,446(0.12%)#146 |
| 31. | Rancho Santa Margarita | 95 | 12,663(0.75%)#31 | 79,446(0.12%)#150 |
| 32. | Saratoga | 94 | 12,663(0.74%)#32 | 79,446(0.12%)#151 |
| 33. | North Tustin | 93 | 12,663(0.73%)#33 | 79,446(0.12%)#154 |
| 34. | San Luis Obispo | 87 | 12,663(0.69%)#34 | 79,446(0.11%)#163 |
| 35. | Tiburon | 86 | 12,663(0.68%)#35 | 79,446(0.11%)#167 |
| 36. | Bear Valley Springs | 86 | 12,663(0.68%)#36 | 79,446(0.11%)#168 |
| 37. | Santa Monica | 85 | 12,663(0.67%)#37 | 79,446(0.11%)#169 |
| 38. | Citrus Heights | 81 | 12,663(0.64%)#38 | 79,446(0.10%)#184 |
| 39. | Clovis | 77 | 12,663(0.61%)#39 | 79,446(0.10%)#195 |
| 40. | Antioch | 77 | 12,663(0.61%)#40 | 79,446(0.10%)#196 |
| 41. | Granite Bay | 77 | 12,663(0.61%)#41 | 79,446(0.10%)#200 |
| 42. | Templeton | 77 | 12,663(0.61%)#42 | 79,446(0.10%)#201 |
| 43. | Lomita | 74 | 12,663(0.58%)#43 | 79,446(0.09%)#208 |
| 44. | Santa Barbara | 72 | 12,663(0.57%)#44 | 79,446(0.09%)#217 |
| 45. | Mill Valley | 70 | 12,663(0.55%)#45 | 79,446(0.09%)#224 |
| 46. | Oceanside | 67 | 12,663(0.53%)#46 | 79,446(0.08%)#230 |
| 47. | San Buenaventura Ventura | 65 | 12,663(0.51%)#47 | 79,446(0.08%)#234 |
| 48. | Tamalpais Homestead Valley | 64 | 12,663(0.51%)#48 | 79,446(0.08%)#247 |
| 49. | Larkspur | 62 | 12,663(0.49%)#49 | 79,446(0.08%)#253 |
| 50. | Upland | 59 | 12,663(0.47%)#50 | 79,446(0.07%)#264 |
| 51. | Calabasas | 58 | 12,663(0.46%)#51 | 79,446(0.07%)#270 |
| 52. | Camarillo | 56 | 12,663(0.44%)#52 | 79,446(0.07%)#281 |
| 53. | Riverside | 55 | 12,663(0.43%)#53 | 79,446(0.07%)#285 |
| 54. | Buena Park | 55 | 12,663(0.43%)#54 | 79,446(0.07%)#288 |
| 55. | Santa Clara | 54 | 12,663(0.43%)#55 | 79,446(0.07%)#292 |
| 56. | Palo Alto | 53 | 12,663(0.42%)#56 | 79,446(0.07%)#297 |
| 57. | West Hollywood | 53 | 12,663(0.42%)#57 | 79,446(0.07%)#300 |
| 58. | Torrance | 52 | 12,663(0.41%)#58 | 79,446(0.07%)#304 |
| 59. | Daly City | 52 | 12,663(0.41%)#59 | 79,446(0.07%)#305 |
| 60. | Rancho Cucamonga | 50 | 12,663(0.39%)#60 | 79,446(0.06%)#314 |
| 61. | Glendale | 49 | 12,663(0.39%)#61 | 79,446(0.06%)#317 |
| 62. | Hanford | 48 | 12,663(0.38%)#62 | 79,446(0.06%)#321 |
| 63. | Carmichael | 47 | 12,663(0.37%)#63 | 79,446(0.06%)#329 |
| 64. | Moraga | 46 | 12,663(0.36%)#64 | 79,446(0.06%)#338 |
| 65. | Laguna Woods | 45 | 12,663(0.36%)#65 | 79,446(0.06%)#344 |
| 66. | Fremont | 44 | 12,663(0.35%)#66 | 79,446(0.06%)#347 |
| 67. | Chico | 44 | 12,663(0.35%)#67 | 79,446(0.06%)#348 |
| 68. | Monterey | 43 | 12,663(0.34%)#68 | 79,446(0.05%)#353 |
| 69. | Murrieta | 42 | 12,663(0.33%)#69 | 79,446(0.05%)#359 |
| 70. | Lompoc | 41 | 12,663(0.32%)#70 | 79,446(0.05%)#374 |
| 71. | Laguna Beach | 39 | 12,663(0.31%)#71 | 79,446(0.05%)#398 |
| 72. | Orange | 38 | 12,663(0.30%)#72 | 79,446(0.05%)#402 |
| 73. | Thousand Oaks | 38 | 12,663(0.30%)#73 | 79,446(0.05%)#404 |
| 74. | Concord | 38 | 12,663(0.30%)#74 | 79,446(0.05%)#405 |
| 75. | Menifee | 38 | 12,663(0.30%)#75 | 79,446(0.05%)#407 |
| 76. | Fairfax | 38 | 12,663(0.30%)#76 | 79,446(0.05%)#410 |
| 77. | Folsom | 37 | 12,663(0.29%)#77 | 79,446(0.05%)#414 |
| 78. | Yuba City | 36 | 12,663(0.28%)#78 | 79,446(0.05%)#424 |
| 79. | San Clemente | 36 | 12,663(0.28%)#79 | 79,446(0.05%)#425 |
| 80. | Tuolumne City | 36 | 12,663(0.28%)#80 | 79,446(0.05%)#432 |
| 81. | Penryn | 36 | 12,663(0.28%)#81 | 79,446(0.05%)#433 |
| 82. | Aliso Viejo | 35 | 12,663(0.28%)#82 | 79,446(0.04%)#436 |
| 83. | Temescal Valley | 35 | 12,663(0.28%)#83 | 79,446(0.04%)#441 |
| 84. | Costa Mesa | 34 | 12,663(0.27%)#84 | 79,446(0.04%)#448 |
| 85. | Albany | 34 | 12,663(0.27%)#85 | 79,446(0.04%)#454 |
| 86. | Beverly Hills | 32 | 12,663(0.25%)#86 | 79,446(0.04%)#474 |
| 87. | El Paso De Robles Paso Robles | 32 | 12,663(0.25%)#87 | 79,446(0.04%)#475 |
| 88. | Santa Fe Springs | 32 | 12,663(0.25%)#88 | 79,446(0.04%)#477 |
| 89. | Mission Viejo | 31 | 12,663(0.24%)#89 | 79,446(0.04%)#482 |
| 90. | Corona | 30 | 12,663(0.24%)#90 | 79,446(0.04%)#492 |
| 91. | Gilroy | 30 | 12,663(0.24%)#91 | 79,446(0.04%)#496 |
| 92. | Oakley | 30 | 12,663(0.24%)#92 | 79,446(0.04%)#498 |
| 93. | Spring Valley Cdp San Diego County | 30 | 12,663(0.24%)#93 | 79,446(0.04%)#499 |
| 94. | Davis | 29 | 12,663(0.23%)#94 | 79,446(0.04%)#508 |
| 95. | Cathedral City | 29 | 12,663(0.23%)#95 | 79,446(0.04%)#509 |
| 96. | Anaheim | 28 | 12,663(0.22%)#96 | 79,446(0.04%)#521 |
| 97. | Prunedale | 28 | 12,663(0.22%)#97 | 79,446(0.04%)#530 |
| 98. | Cambria | 28 | 12,663(0.22%)#98 | 79,446(0.04%)#536 |
| 99. | Redondo Beach | 27 | 12,663(0.21%)#99 | 79,446(0.03%)#547 |
| 100. | Eastern Goleta Valley | 27 | 12,663(0.21%)#100 | 79,446(0.03%)#549 |
Common Questions
What are the Top 10 Cities with the Largest South African Community in California?
Top 10 Cities with the Largest South African Community in California are:
#1
1,852
#2
1,136
#3
612
#4
431
#5
225
#6
223
#7
215
#8
207
#9
206
#10
201
What city has the Largest South African Community in California?
Los Angeles has the Largest South African Community in California with 1,852.
What is the Total South African Population in the State of California?
Total South African Population in California is 12,663.
What is the Total South African Population in the United States?
Total South African Population in the United States is 79,446.