Cities with the Highest Percentage of Bhutanese Population in California
RELATED REPORTS & OPTIONS
Bhutanese
California
Compare Cities
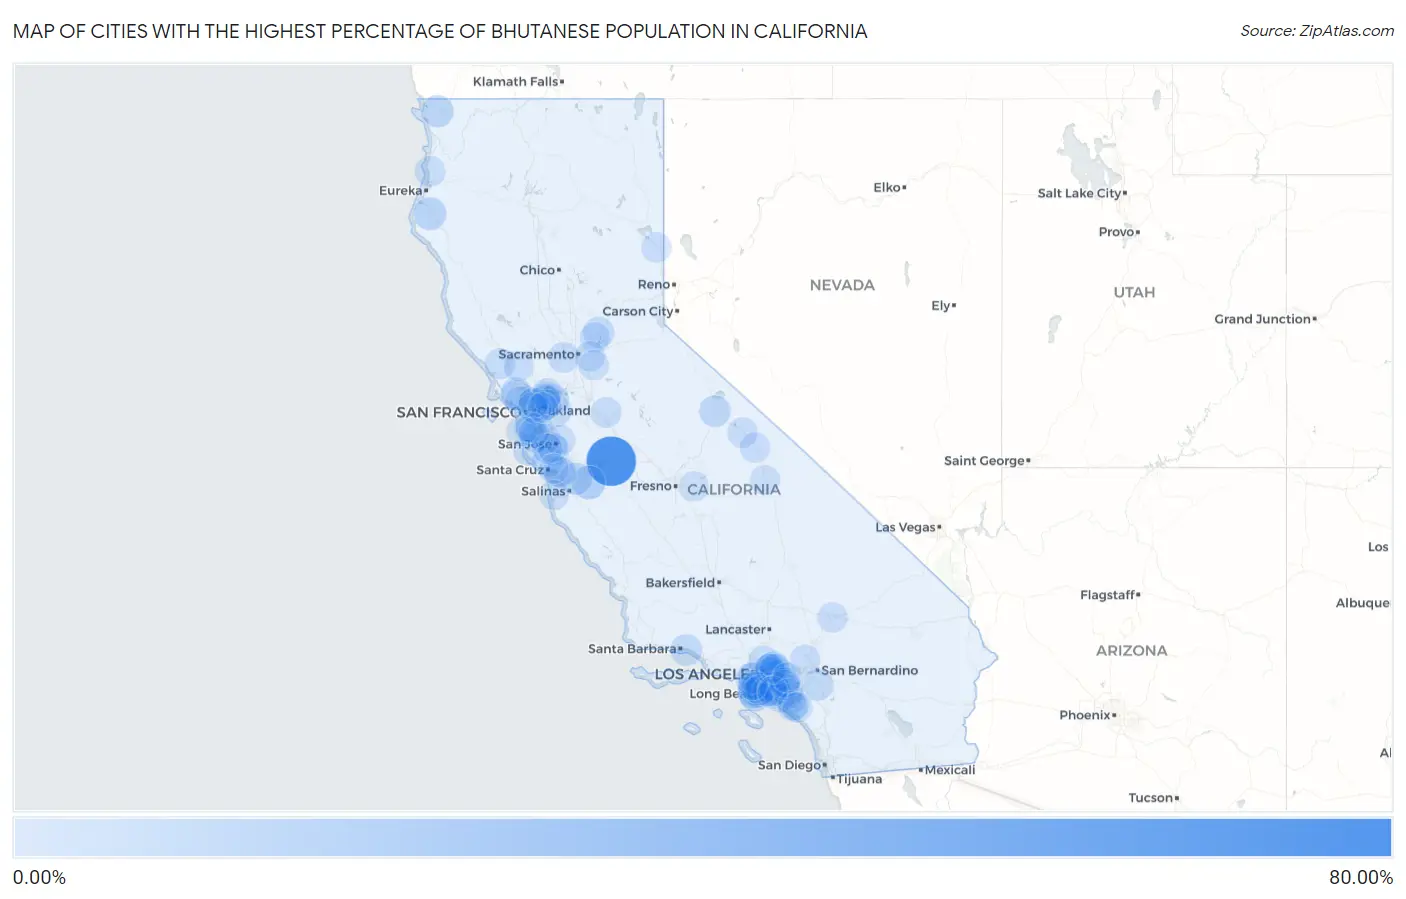
Map of Cities with the Highest Percentage of Bhutanese Population in California
0.00%
80.00%
Cities with the Highest Percentage of Bhutanese Population in California
| City | Bhutanese | vs State | vs National | |
| 1. | Volta | 64.04% | 1.22%(+62.8)#1 | 0.49%(+63.6)#1 |
| 2. | Torrance | 13.74% | 1.22%(+12.5)#2 | 0.49%(+13.3)#97 |
| 3. | Tres Pinos | 13.32% | 1.22%(+12.1)#3 | 0.49%(+12.8)#103 |
| 4. | Acalanes Ridge | 10.93% | 1.22%(+9.71)#4 | 0.49%(+10.4)#125 |
| 5. | Rancho Palos Verdes | 10.82% | 1.22%(+9.60)#5 | 0.49%(+10.3)#128 |
| 6. | Scotia | 10.20% | 1.22%(+8.98)#6 | 0.49%(+9.71)#138 |
| 7. | Gardena | 9.21% | 1.22%(+7.99)#7 | 0.49%(+8.73)#150 |
| 8. | Palos Verdes Estates | 8.78% | 1.22%(+7.56)#8 | 0.49%(+8.30)#160 |
| 9. | Gasquet | 8.74% | 1.22%(+7.52)#9 | 0.49%(+8.26)#161 |
| 10. | San Juan Bautista | 8.40% | 1.22%(+7.18)#10 | 0.49%(+7.91)#165 |
| 11. | June Lake | 7.28% | 1.22%(+6.06)#11 | 0.49%(+6.80)#190 |
| 12. | South San Gabriel | 7.24% | 1.22%(+6.02)#12 | 0.49%(+6.76)#193 |
| 13. | Summerland | 7.22% | 1.22%(+6.00)#13 | 0.49%(+6.73)#194 |
| 14. | Rose Hills | 7.14% | 1.22%(+5.92)#14 | 0.49%(+6.65)#196 |
| 15. | March Arb | 6.89% | 1.22%(+5.67)#15 | 0.49%(+6.41)#200 |
| 16. | Marina Del Rey | 6.71% | 1.22%(+5.49)#16 | 0.49%(+6.22)#206 |
| 17. | Monterey Park | 6.45% | 1.22%(+5.23)#17 | 0.49%(+5.96)#216 |
| 18. | Industry | 6.41% | 1.22%(+5.19)#18 | 0.49%(+5.92)#217 |
| 19. | Lomita | 6.31% | 1.22%(+5.09)#19 | 0.49%(+5.82)#225 |
| 20. | Rolling Hills Estates | 6.18% | 1.22%(+4.96)#20 | 0.49%(+5.70)#228 |
| 21. | Pescadero | 6.02% | 1.22%(+4.80)#21 | 0.49%(+5.53)#231 |
| 22. | Newcastle | 6.00% | 1.22%(+4.78)#22 | 0.49%(+5.51)#233 |
| 23. | Zayante | 5.99% | 1.22%(+4.77)#23 | 0.49%(+5.50)#234 |
| 24. | Highlands | 5.93% | 1.22%(+4.71)#24 | 0.49%(+5.45)#236 |
| 25. | La Crescenta Montrose | 5.82% | 1.22%(+4.60)#25 | 0.49%(+5.33)#238 |
| 26. | South Pasadena | 5.62% | 1.22%(+4.40)#26 | 0.49%(+5.14)#244 |
| 27. | Culver City | 5.57% | 1.22%(+4.35)#27 | 0.49%(+5.09)#248 |
| 28. | Cambrian Park | 5.49% | 1.22%(+4.27)#28 | 0.49%(+5.00)#255 |
| 29. | Albany | 5.36% | 1.22%(+4.14)#29 | 0.49%(+4.88)#261 |
| 30. | Villa Park | 5.19% | 1.22%(+3.97)#30 | 0.49%(+4.71)#271 |
| 31. | Camino Tassajara | 5.16% | 1.22%(+3.94)#31 | 0.49%(+4.67)#272 |
| 32. | Mountain Meadows | 5.12% | 1.22%(+3.90)#32 | 0.49%(+4.63)#277 |
| 33. | Aptos Hills Larkin Valley | 5.10% | 1.22%(+3.88)#33 | 0.49%(+4.61)#278 |
| 34. | University Of California Davis | 5.01% | 1.22%(+3.79)#34 | 0.49%(+4.52)#280 |
| 35. | Redondo Beach | 4.82% | 1.22%(+3.60)#35 | 0.49%(+4.34)#288 |
| 36. | La Palma | 4.77% | 1.22%(+3.55)#36 | 0.49%(+4.29)#291 |
| 37. | San Pasqual | 4.71% | 1.22%(+3.49)#37 | 0.49%(+4.22)#294 |
| 38. | Graton | 4.67% | 1.22%(+3.45)#38 | 0.49%(+4.18)#296 |
| 39. | Clayton | 4.65% | 1.22%(+3.43)#39 | 0.49%(+4.16)#298 |
| 40. | Foster City | 4.61% | 1.22%(+3.39)#40 | 0.49%(+4.12)#300 |
| 41. | Rancho Mission Viejo | 4.42% | 1.22%(+3.20)#41 | 0.49%(+3.93)#313 |
| 42. | Baywood Park | 4.33% | 1.22%(+3.11)#42 | 0.49%(+3.84)#321 |
| 43. | Lucas Valley Marinwood | 4.31% | 1.22%(+3.09)#43 | 0.49%(+3.82)#323 |
| 44. | Clyde | 4.30% | 1.22%(+3.08)#44 | 0.49%(+3.81)#324 |
| 45. | Escalon | 4.29% | 1.22%(+3.07)#45 | 0.49%(+3.80)#325 |
| 46. | Sleepy Hollow | 4.28% | 1.22%(+3.06)#46 | 0.49%(+3.80)#326 |
| 47. | Cerritos | 4.24% | 1.22%(+3.02)#47 | 0.49%(+3.75)#331 |
| 48. | Cypress | 4.22% | 1.22%(+3.00)#48 | 0.49%(+3.73)#332 |
| 49. | East Foothills | 4.17% | 1.22%(+2.95)#49 | 0.49%(+3.68)#336 |
| 50. | Lytle Creek | 4.17% | 1.22%(+2.95)#50 | 0.49%(+3.68)#337 |
| 51. | Woodside | 4.11% | 1.22%(+2.89)#51 | 0.49%(+3.62)#341 |
| 52. | Loomis | 4.00% | 1.22%(+2.78)#52 | 0.49%(+3.51)#349 |
| 53. | Freedom | 3.99% | 1.22%(+2.77)#53 | 0.49%(+3.50)#351 |
| 54. | Paradise | 3.83% | 1.22%(+2.60)#54 | 0.49%(+3.34)#360 |
| 55. | Castle Hill | 3.76% | 1.22%(+2.54)#55 | 0.49%(+3.27)#363 |
| 56. | Sierra Madre | 3.70% | 1.22%(+2.48)#56 | 0.49%(+3.22)#370 |
| 57. | Westhaven Moonstone | 3.70% | 1.22%(+2.48)#57 | 0.49%(+3.21)#371 |
| 58. | Irvine | 3.61% | 1.22%(+2.39)#58 | 0.49%(+3.12)#374 |
| 59. | Wilkerson | 3.56% | 1.22%(+2.34)#59 | 0.49%(+3.07)#379 |
| 60. | California Polytechnic State University | 3.51% | 1.22%(+2.29)#60 | 0.49%(+3.02)#388 |
| 61. | Piedmont | 3.38% | 1.22%(+2.16)#61 | 0.49%(+2.89)#401 |
| 62. | Mather | 3.35% | 1.22%(+2.13)#62 | 0.49%(+2.87)#402 |
| 63. | Doyle | 3.31% | 1.22%(+2.09)#63 | 0.49%(+2.82)#409 |
| 64. | Kenwood | 3.28% | 1.22%(+2.06)#64 | 0.49%(+2.80)#411 |
| 65. | La Canada Flintridge | 3.24% | 1.22%(+2.02)#65 | 0.49%(+2.76)#415 |
| 66. | Barstow | 3.23% | 1.22%(+2.01)#66 | 0.49%(+2.74)#420 |
| 67. | Fountain Valley | 3.22% | 1.22%(+2.00)#67 | 0.49%(+2.74)#421 |
| 68. | Laguna Hills | 3.22% | 1.22%(+2.00)#68 | 0.49%(+2.73)#423 |
| 69. | Green Valley Cdp Solano County | 3.22% | 1.22%(+2.00)#69 | 0.49%(+2.73)#424 |
| 70. | Signal Hill | 3.21% | 1.22%(+1.99)#70 | 0.49%(+2.72)#425 |
| 71. | West Carson | 3.20% | 1.22%(+1.98)#71 | 0.49%(+2.71)#427 |
| 72. | Mountain View | 3.10% | 1.22%(+1.88)#72 | 0.49%(+2.62)#437 |
| 73. | San Marino | 3.09% | 1.22%(+1.87)#73 | 0.49%(+2.60)#438 |
| 74. | Minkler | 3.07% | 1.22%(+1.85)#74 | 0.49%(+2.59)#440 |
| 75. | Seal Beach | 3.05% | 1.22%(+1.83)#75 | 0.49%(+2.56)#444 |
| 76. | Campbell | 3.01% | 1.22%(+1.79)#76 | 0.49%(+2.52)#458 |
| 77. | Wilton | 3.00% | 1.22%(+1.78)#77 | 0.49%(+2.51)#460 |
| 78. | Placentia | 2.97% | 1.22%(+1.75)#78 | 0.49%(+2.48)#466 |
| 79. | Moss Beach | 2.94% | 1.22%(+1.72)#79 | 0.49%(+2.45)#468 |
| 80. | Arcadia | 2.94% | 1.22%(+1.71)#80 | 0.49%(+2.45)#469 |
| 81. | Hillsborough | 2.90% | 1.22%(+1.68)#81 | 0.49%(+2.41)#475 |
| 82. | Saratoga | 2.90% | 1.22%(+1.68)#82 | 0.49%(+2.41)#476 |
| 83. | Pacheco | 2.88% | 1.22%(+1.66)#83 | 0.49%(+2.39)#478 |
| 84. | Pleasant Hill | 2.88% | 1.22%(+1.65)#84 | 0.49%(+2.39)#479 |
| 85. | Manhattan Beach | 2.83% | 1.22%(+1.61)#85 | 0.49%(+2.35)#487 |
| 86. | Independence | 2.82% | 1.22%(+1.60)#86 | 0.49%(+2.34)#488 |
| 87. | Pacific Grove | 2.82% | 1.22%(+1.60)#87 | 0.49%(+2.33)#489 |
| 88. | North Tustin | 2.81% | 1.22%(+1.59)#88 | 0.49%(+2.33)#494 |
| 89. | Seacliff | 2.79% | 1.22%(+1.57)#89 | 0.49%(+2.30)#498 |
| 90. | Emeryville | 2.78% | 1.22%(+1.56)#90 | 0.49%(+2.29)#501 |
| 91. | Brea | 2.78% | 1.22%(+1.55)#91 | 0.49%(+2.29)#506 |
| 92. | Aliso Viejo | 2.77% | 1.22%(+1.55)#92 | 0.49%(+2.29)#507 |
| 93. | San Mateo | 2.77% | 1.22%(+1.55)#93 | 0.49%(+2.28)#509 |
| 94. | San Carlos | 2.75% | 1.22%(+1.52)#94 | 0.49%(+2.26)#512 |
| 95. | Corte Madera | 2.73% | 1.22%(+1.51)#95 | 0.49%(+2.24)#519 |
| 96. | Rossmoor | 2.73% | 1.22%(+1.51)#96 | 0.49%(+2.24)#521 |
| 97. | Kensington | 2.71% | 1.22%(+1.49)#97 | 0.49%(+2.22)#523 |
| 98. | Diamond Bar | 2.68% | 1.22%(+1.46)#98 | 0.49%(+2.19)#527 |
| 99. | Ladera Ranch | 2.66% | 1.22%(+1.44)#99 | 0.49%(+2.18)#531 |
| 100. | Moraga | 2.66% | 1.22%(+1.44)#100 | 0.49%(+2.18)#532 |
Common Questions
What are the Top 10 Cities with the Highest Percentage of Bhutanese Population in California?
Top 10 Cities with the Highest Percentage of Bhutanese Population in California are:
#1
64.04%
#2
13.74%
#3
13.32%
#4
10.93%
#5
10.82%
#6
10.20%
#7
9.21%
#8
8.78%
#9
8.74%
#10
8.40%
What city has the Highest Percentage of Bhutanese Population in California?
Volta has the Highest Percentage of Bhutanese Population in California with 64.04%.
What is the Percentage of Bhutanese Population in the State of California?
Percentage of Bhutanese Population in California is 1.22%.
What is the Percentage of Bhutanese Population in the United States?
Percentage of Bhutanese Population in the United States is 0.49%.