Cities with the Lowest Poverty Level Among Married Couples in California
RELATED REPORTS & OPTIONS
Lowest Poverty | Married Couple
California
Compare Cities
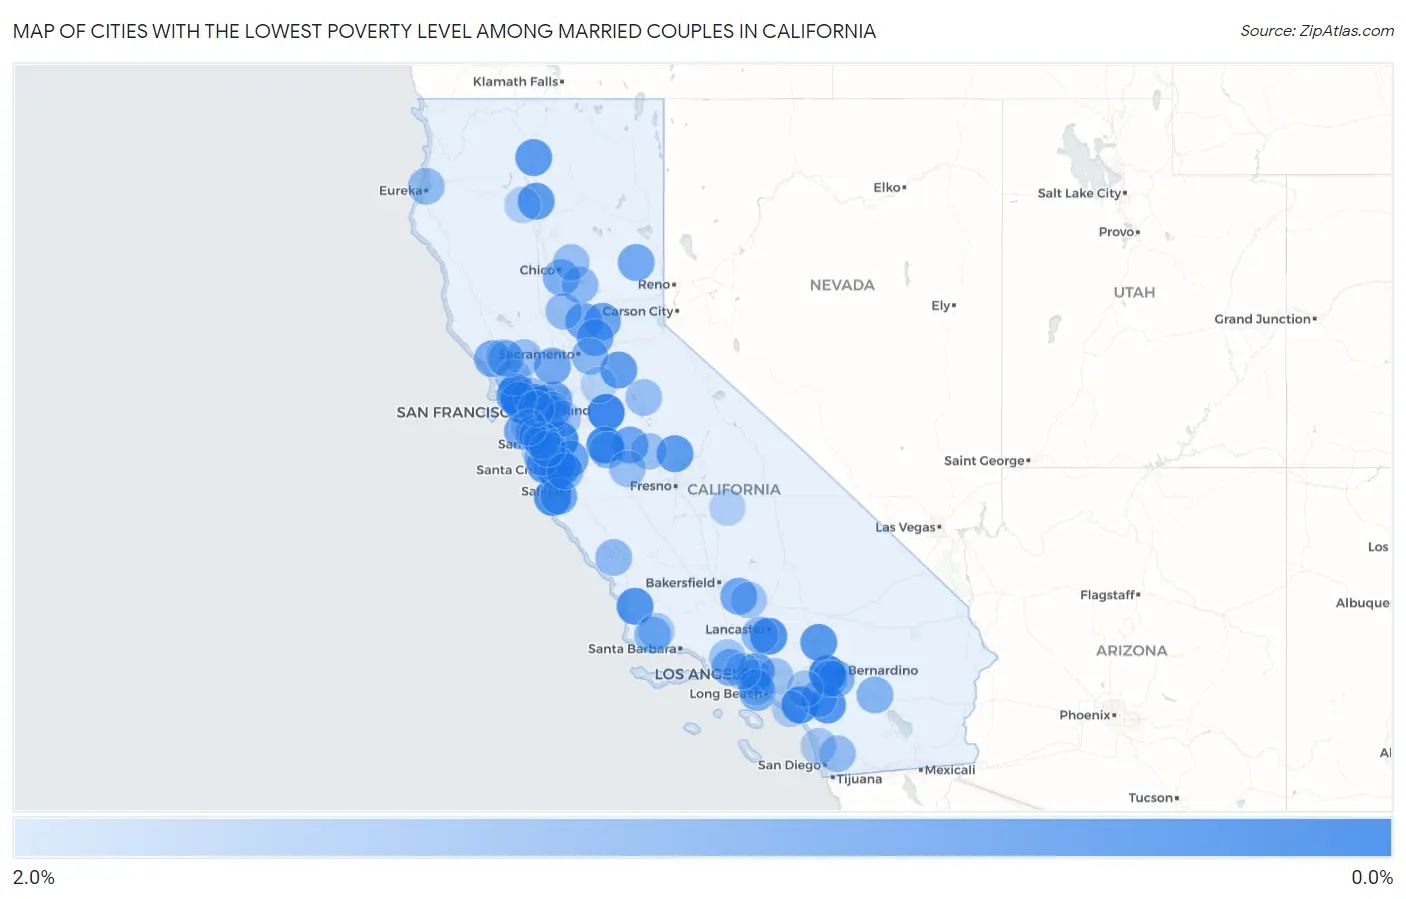
Map of Cities with the Lowest Poverty Level Among Married Couples in California
2.0%
0.0%
Cities with the Lowest Poverty Level Among Married Couples in California
| City | Married Couples Poverty | vs State | vs National | |
| 1. | Mentone | 0.36% | 5.1%(-4.76)#1 | 4.5%(-4.10)#109 |
| 2. | Escalon | 0.40% | 5.1%(-4.73)#2 | 4.5%(-4.07)#137 |
| 3. | East Foothills | 0.44% | 5.1%(-4.69)#3 | 4.5%(-4.03)#179 |
| 4. | Tiburon | 0.47% | 5.1%(-4.65)#4 | 4.5%(-3.99)#216 |
| 5. | Coto De Caza | 0.50% | 5.1%(-4.62)#5 | 4.5%(-3.96)#242 |
| 6. | Newman | 0.51% | 5.1%(-4.61)#6 | 4.5%(-3.95)#255 |
| 7. | Monte Sereno | 0.54% | 5.1%(-4.58)#7 | 4.5%(-3.92)#287 |
| 8. | Fairfax | 0.55% | 5.1%(-4.57)#8 | 4.5%(-3.91)#306 |
| 9. | Del Monte Forest | 0.56% | 5.1%(-4.56)#9 | 4.5%(-3.90)#325 |
| 10. | Corralitos | 0.57% | 5.1%(-4.55)#10 | 4.5%(-3.89)#345 |
| 11. | Orinda | 0.59% | 5.1%(-4.53)#11 | 4.5%(-3.87)#364 |
| 12. | Desert View Highlands | 0.59% | 5.1%(-4.53)#12 | 4.5%(-3.87)#368 |
| 13. | Lucas Valley Marinwood | 0.61% | 5.1%(-4.52)#13 | 4.5%(-3.86)#385 |
| 14. | Nipomo | 0.62% | 5.1%(-4.50)#14 | 4.5%(-3.84)#402 |
| 15. | Soquel | 0.64% | 5.1%(-4.48)#15 | 4.5%(-3.82)#434 |
| 16. | French Valley | 0.66% | 5.1%(-4.46)#16 | 4.5%(-3.80)#466 |
| 17. | Kensington | 0.66% | 5.1%(-4.46)#17 | 4.5%(-3.80)#468 |
| 18. | Spring Valley Lake | 0.68% | 5.1%(-4.44)#18 | 4.5%(-3.78)#503 |
| 19. | Belvedere | 0.71% | 5.1%(-4.41)#19 | 4.5%(-3.75)#550 |
| 20. | Dunsmuir | 0.71% | 5.1%(-4.41)#20 | 4.5%(-3.75)#551 |
| 21. | Atherton | 0.72% | 5.1%(-4.40)#21 | 4.5%(-3.74)#564 |
| 22. | Bella Vista | 0.73% | 5.1%(-4.39)#22 | 4.5%(-3.73)#576 |
| 23. | Yosemite Lakes | 0.73% | 5.1%(-4.39)#23 | 4.5%(-3.73)#585 |
| 24. | Jackson | 0.75% | 5.1%(-4.37)#24 | 4.5%(-3.71)#613 |
| 25. | Felton | 0.79% | 5.1%(-4.34)#25 | 4.5%(-3.68)#712 |
| 26. | West Hollywood | 0.81% | 5.1%(-4.31)#26 | 4.5%(-3.65)#778 |
| 27. | Clayton | 0.82% | 5.1%(-4.31)#27 | 4.5%(-3.65)#786 |
| 28. | San Anselmo | 0.82% | 5.1%(-4.30)#28 | 4.5%(-3.64)#790 |
| 29. | Rio Del Mar | 0.84% | 5.1%(-4.28)#29 | 4.5%(-3.62)#850 |
| 30. | Morgan Hill | 0.86% | 5.1%(-4.26)#30 | 4.5%(-3.60)#884 |
| 31. | Mcswain | 0.87% | 5.1%(-4.26)#31 | 4.5%(-3.60)#895 |
| 32. | Wheatland | 0.88% | 5.1%(-4.24)#32 | 4.5%(-3.58)#913 |
| 33. | Lake Of The Pines | 0.88% | 5.1%(-4.24)#33 | 4.5%(-3.58)#920 |
| 34. | Bear Valley Springs | 0.90% | 5.1%(-4.22)#34 | 4.5%(-3.56)#963 |
| 35. | Loomis | 0.91% | 5.1%(-4.21)#35 | 4.5%(-3.55)#986 |
| 36. | El Granada | 0.92% | 5.1%(-4.20)#36 | 4.5%(-3.54)#1,007 |
| 37. | Hartley | 0.92% | 5.1%(-4.20)#37 | 4.5%(-3.54)#1,012 |
| 38. | Day Valley | 0.93% | 5.1%(-4.20)#38 | 4.5%(-3.53)#1,026 |
| 39. | Madera Ranchos | 0.93% | 5.1%(-4.19)#39 | 4.5%(-3.53)#1,033 |
| 40. | Del Rey Oaks | 0.93% | 5.1%(-4.19)#40 | 4.5%(-3.53)#1,034 |
| 41. | La Canada Flintridge | 0.95% | 5.1%(-4.17)#41 | 4.5%(-3.51)#1,075 |
| 42. | Portola | 0.95% | 5.1%(-4.17)#42 | 4.5%(-3.51)#1,083 |
| 43. | Guerneville | 0.97% | 5.1%(-4.16)#43 | 4.5%(-3.50)#1,119 |
| 44. | Canyon Lake | 1.0% | 5.1%(-4.11)#44 | 4.5%(-3.45)#1,236 |
| 45. | Durham | 1.0% | 5.1%(-4.10)#45 | 4.5%(-3.44)#1,271 |
| 46. | Rolling Hills Estates | 1.0% | 5.1%(-4.08)#46 | 4.5%(-3.42)#1,294 |
| 47. | Lafayette | 1.1% | 5.1%(-4.07)#47 | 4.5%(-3.41)#1,322 |
| 48. | Westlake Village | 1.1% | 5.1%(-4.06)#48 | 4.5%(-3.40)#1,343 |
| 49. | Cherry Valley | 1.1% | 5.1%(-4.04)#49 | 4.5%(-3.38)#1,385 |
| 50. | Boulder Creek | 1.1% | 5.1%(-4.02)#50 | 4.5%(-3.36)#1,421 |
| 51. | Bermuda Dunes | 1.1% | 5.1%(-4.01)#51 | 4.5%(-3.35)#1,449 |
| 52. | San Carlos | 1.1% | 5.1%(-4.00)#52 | 4.5%(-3.34)#1,475 |
| 53. | Newark | 1.1% | 5.1%(-3.99)#53 | 4.5%(-3.33)#1,502 |
| 54. | Buellton | 1.1% | 5.1%(-3.98)#54 | 4.5%(-3.32)#1,545 |
| 55. | Interlaken | 1.2% | 5.1%(-3.96)#55 | 4.5%(-3.30)#1,584 |
| 56. | Mather | 1.2% | 5.1%(-3.96)#56 | 4.5%(-3.30)#1,585 |
| 57. | Eastern Goleta Valley | 1.2% | 5.1%(-3.96)#57 | 4.5%(-3.30)#1,601 |
| 58. | Gustine | 1.2% | 5.1%(-3.94)#58 | 4.5%(-3.28)#1,627 |
| 59. | Leona Valley | 1.2% | 5.1%(-3.94)#59 | 4.5%(-3.28)#1,632 |
| 60. | Kelly Ridge | 1.2% | 5.1%(-3.93)#60 | 4.5%(-3.27)#1,669 |
| 61. | Lake Nacimiento | 1.2% | 5.1%(-3.91)#61 | 4.5%(-3.25)#1,716 |
| 62. | Sutter | 1.2% | 5.1%(-3.90)#62 | 4.5%(-3.24)#1,740 |
| 63. | Manila | 1.2% | 5.1%(-3.90)#63 | 4.5%(-3.23)#1,746 |
| 64. | Windsor | 1.2% | 5.1%(-3.89)#64 | 4.5%(-3.23)#1,760 |
| 65. | Culver City | 1.2% | 5.1%(-3.88)#65 | 4.5%(-3.22)#1,774 |
| 66. | West Menlo Park | 1.3% | 5.1%(-3.87)#66 | 4.5%(-3.21)#1,804 |
| 67. | Eucalyptus Hills | 1.3% | 5.1%(-3.86)#67 | 4.5%(-3.20)#1,827 |
| 68. | Magalia | 1.3% | 5.1%(-3.84)#68 | 4.5%(-3.18)#1,878 |
| 69. | East Sonora | 1.3% | 5.1%(-3.83)#69 | 4.5%(-3.17)#1,903 |
| 70. | St Helena | 1.3% | 5.1%(-3.83)#70 | 4.5%(-3.17)#1,909 |
| 71. | Le Grand | 1.3% | 5.1%(-3.83)#71 | 4.5%(-3.17)#1,915 |
| 72. | San Ramon | 1.3% | 5.1%(-3.83)#72 | 4.5%(-3.16)#1,927 |
| 73. | Dos Palos | 1.3% | 5.1%(-3.81)#73 | 4.5%(-3.15)#1,970 |
| 74. | Tara Hills | 1.3% | 5.1%(-3.79)#74 | 4.5%(-3.13)#2,012 |
| 75. | Palo Alto | 1.3% | 5.1%(-3.79)#75 | 4.5%(-3.13)#2,028 |
| 76. | Livermore | 1.3% | 5.1%(-3.78)#76 | 4.5%(-3.12)#2,042 |
| 77. | Calimesa | 1.3% | 5.1%(-3.78)#77 | 4.5%(-3.12)#2,057 |
| 78. | San Miguel Cdp Contra Costa County | 1.3% | 5.1%(-3.77)#78 | 4.5%(-3.11)#2,066 |
| 79. | Rose Hills | 1.4% | 5.1%(-3.76)#79 | 4.5%(-3.10)#2,093 |
| 80. | El Cerrito | 1.4% | 5.1%(-3.75)#80 | 4.5%(-3.09)#2,114 |
| 81. | Moorpark | 1.4% | 5.1%(-3.75)#81 | 4.5%(-3.09)#2,132 |
| 82. | Tehachapi | 1.4% | 5.1%(-3.75)#82 | 4.5%(-3.09)#2,142 |
| 83. | Los Altos Hills | 1.4% | 5.1%(-3.74)#83 | 4.5%(-3.08)#2,164 |
| 84. | Petaluma | 1.4% | 5.1%(-3.72)#84 | 4.5%(-3.06)#2,204 |
| 85. | Los Olivos | 1.4% | 5.1%(-3.70)#85 | 4.5%(-3.04)#2,247 |
| 86. | Las Flores Cdp Orange County | 1.4% | 5.1%(-3.69)#86 | 4.5%(-3.03)#2,277 |
| 87. | Solana Beach | 1.5% | 5.1%(-3.67)#87 | 4.5%(-3.01)#2,351 |
| 88. | Saratoga | 1.5% | 5.1%(-3.65)#88 | 4.5%(-2.99)#2,415 |
| 89. | Redondo Beach | 1.5% | 5.1%(-3.65)#89 | 4.5%(-2.99)#2,418 |
| 90. | Larkfield Wikiup | 1.5% | 5.1%(-3.64)#90 | 4.5%(-2.98)#2,425 |
| 91. | Topanga | 1.5% | 5.1%(-3.64)#91 | 4.5%(-2.98)#2,437 |
| 92. | Laguna Beach | 1.5% | 5.1%(-3.63)#92 | 4.5%(-2.97)#2,444 |
| 93. | Shasta | 1.5% | 5.1%(-3.62)#93 | 4.5%(-2.96)#2,468 |
| 94. | Lake Shastina | 1.5% | 5.1%(-3.62)#94 | 4.5%(-2.96)#2,482 |
| 95. | Danville | 1.5% | 5.1%(-3.62)#95 | 4.5%(-2.96)#2,484 |
| 96. | Three Rivers | 1.5% | 5.1%(-3.61)#96 | 4.5%(-2.95)#2,506 |
| 97. | Kentfield | 1.5% | 5.1%(-3.61)#97 | 4.5%(-2.95)#2,530 |
| 98. | Piedmont | 1.5% | 5.1%(-3.60)#98 | 4.5%(-2.94)#2,540 |
| 99. | Lockeford | 1.6% | 5.1%(-3.56)#99 | 4.5%(-2.90)#2,647 |
| 100. | Hillsborough | 1.6% | 5.1%(-3.54)#100 | 4.5%(-2.88)#2,678 |
Common Questions
What are the Top 10 Cities with the Lowest Poverty Level Among Married Couples in California?
Top 10 Cities with the Lowest Poverty Level Among Married Couples in California are:
#1
0.36%
#2
0.40%
#3
0.44%
#4
0.47%
#5
0.50%
#6
0.51%
#7
0.54%
#8
0.55%
#9
0.56%
#10
0.57%
What city has the Lowest Poverty Level Among Married Couples in California?
Mentone has the Lowest Poverty Level Among Married Couples in California with 0.36%.
What is the Poverty Level Among Married Couples in the State of California?
Poverty Level Among Married Couples in California is 5.1%.
What is the Poverty Level Among Married Couples in the United States?
Poverty Level Among Married Couples in the United States is 4.5%.