Cities with the Highest Percentage of Indonesian Population in California
RELATED REPORTS & OPTIONS
Indonesian
California
Compare Cities
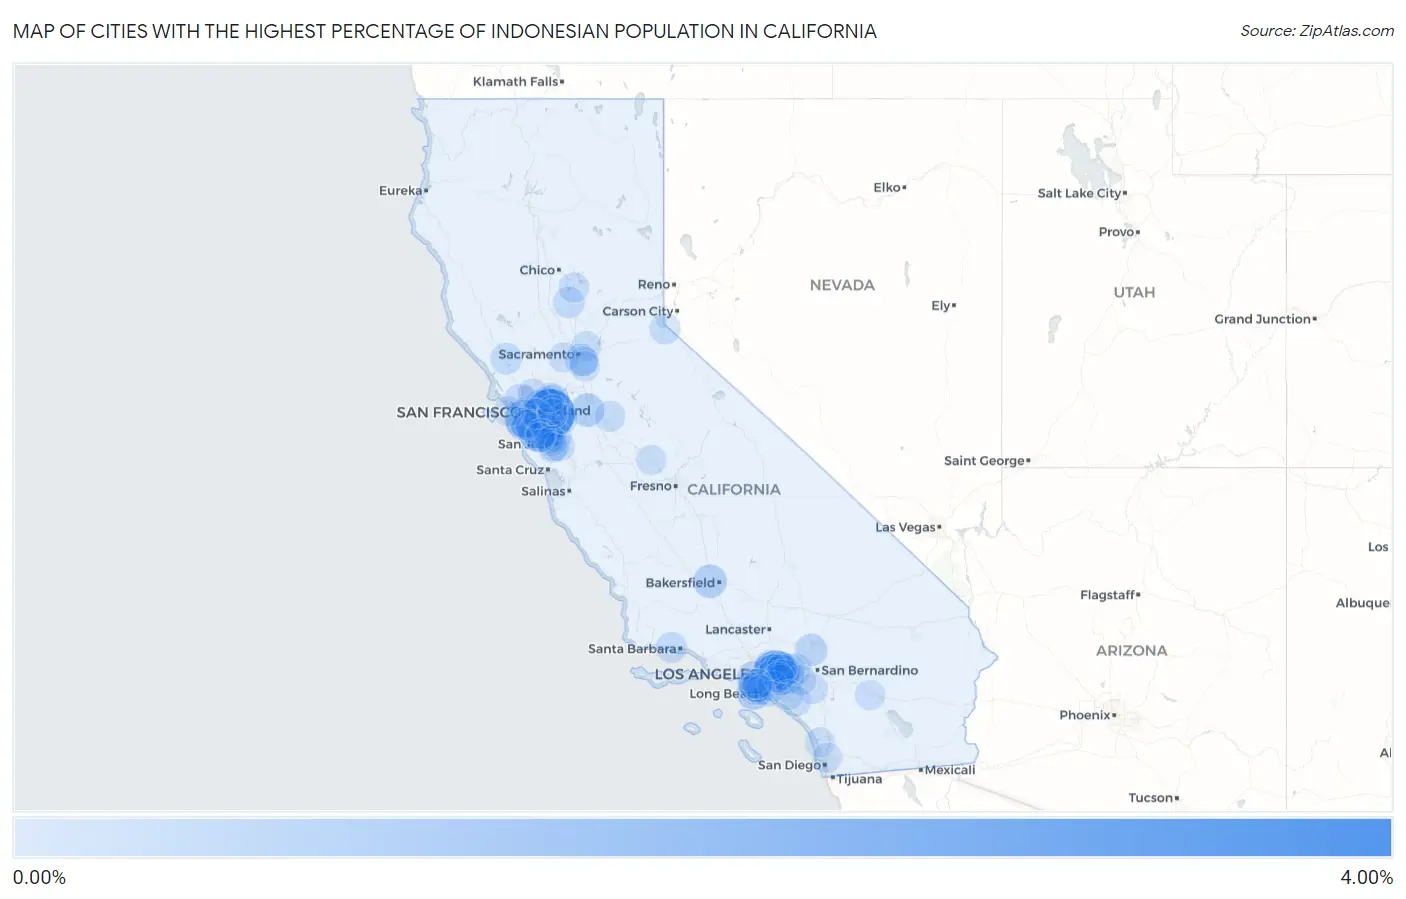
Map of Cities with the Highest Percentage of Indonesian Population in California
0.00%
4.00%
Cities with the Highest Percentage of Indonesian Population in California
| City | Indonesian | vs State | vs National | |
| 1. | Norris Canyon | 3.25% | 0.060%(+3.19)#1 | 0.066%(+3.18)#42 |
| 2. | North El Monte | 1.63% | 0.060%(+1.57)#2 | 0.066%(+1.57)#93 |
| 3. | Daly City | 1.33% | 0.060%(+1.27)#3 | 0.066%(+1.26)#113 |
| 4. | South San Gabriel | 1.26% | 0.060%(+1.20)#4 | 0.066%(+1.19)#117 |
| 5. | Mayflower Village | 1.02% | 0.060%(+0.958)#5 | 0.066%(+0.952)#135 |
| 6. | North Fair Oaks | 1.01% | 0.060%(+0.954)#6 | 0.066%(+0.947)#137 |
| 7. | Rosemead | 0.90% | 0.060%(+0.836)#7 | 0.066%(+0.829)#152 |
| 8. | Union City | 0.78% | 0.060%(+0.725)#8 | 0.066%(+0.718)#165 |
| 9. | Palos Verdes Estates | 0.75% | 0.060%(+0.689)#9 | 0.066%(+0.683)#170 |
| 10. | Monterey Park | 0.71% | 0.060%(+0.654)#10 | 0.066%(+0.648)#179 |
| 11. | Fremont | 0.71% | 0.060%(+0.649)#11 | 0.066%(+0.643)#181 |
| 12. | Lawndale | 0.63% | 0.060%(+0.574)#12 | 0.066%(+0.568)#190 |
| 13. | Lathrop | 0.63% | 0.060%(+0.568)#13 | 0.066%(+0.562)#191 |
| 14. | Rosedale | 0.62% | 0.060%(+0.561)#14 | 0.066%(+0.555)#194 |
| 15. | Diamond Bar | 0.57% | 0.060%(+0.513)#15 | 0.066%(+0.506)#204 |
| 16. | Alhambra | 0.54% | 0.060%(+0.484)#16 | 0.066%(+0.477)#214 |
| 17. | South San Francisco | 0.53% | 0.060%(+0.474)#17 | 0.066%(+0.468)#220 |
| 18. | San Gabriel | 0.52% | 0.060%(+0.463)#18 | 0.066%(+0.457)#224 |
| 19. | Baldwin Park | 0.52% | 0.060%(+0.462)#19 | 0.066%(+0.456)#225 |
| 20. | Culver City | 0.52% | 0.060%(+0.461)#20 | 0.066%(+0.454)#226 |
| 21. | Parkway | 0.47% | 0.060%(+0.408)#21 | 0.066%(+0.402)#243 |
| 22. | Charter Oak | 0.45% | 0.060%(+0.390)#22 | 0.066%(+0.384)#252 |
| 23. | Torrance | 0.44% | 0.060%(+0.376)#23 | 0.066%(+0.370)#254 |
| 24. | San Marino | 0.43% | 0.060%(+0.375)#24 | 0.066%(+0.368)#255 |
| 25. | Oak Hills | 0.43% | 0.060%(+0.374)#25 | 0.066%(+0.368)#256 |
| 26. | Pacifica | 0.43% | 0.060%(+0.374)#26 | 0.066%(+0.368)#257 |
| 27. | West Covina | 0.43% | 0.060%(+0.371)#27 | 0.066%(+0.365)#259 |
| 28. | Covina | 0.43% | 0.060%(+0.370)#28 | 0.066%(+0.364)#260 |
| 29. | Rowland Heights | 0.38% | 0.060%(+0.324)#29 | 0.066%(+0.318)#278 |
| 30. | South El Monte | 0.37% | 0.060%(+0.311)#30 | 0.066%(+0.305)#285 |
| 31. | Atherton | 0.35% | 0.060%(+0.291)#31 | 0.066%(+0.285)#295 |
| 32. | Walnut Creek | 0.32% | 0.060%(+0.257)#32 | 0.066%(+0.251)#314 |
| 33. | Larkfield Wikiup | 0.31% | 0.060%(+0.253)#33 | 0.066%(+0.246)#318 |
| 34. | Burbank | 0.31% | 0.060%(+0.246)#34 | 0.066%(+0.240)#322 |
| 35. | Temple City | 0.30% | 0.060%(+0.245)#35 | 0.066%(+0.238)#325 |
| 36. | Larkspur | 0.30% | 0.060%(+0.241)#36 | 0.066%(+0.235)#327 |
| 37. | Clayton | 0.30% | 0.060%(+0.239)#37 | 0.066%(+0.232)#328 |
| 38. | East San Gabriel | 0.29% | 0.060%(+0.232)#38 | 0.066%(+0.225)#334 |
| 39. | University Of California-Santa Barbara | 0.29% | 0.060%(+0.229)#39 | 0.066%(+0.223)#337 |
| 40. | Live Oak | 0.28% | 0.060%(+0.222)#40 | 0.066%(+0.216)#343 |
| 41. | El Monte | 0.28% | 0.060%(+0.218)#41 | 0.066%(+0.212)#349 |
| 42. | Monrovia | 0.28% | 0.060%(+0.217)#42 | 0.066%(+0.210)#352 |
| 43. | Montebello | 0.26% | 0.060%(+0.205)#43 | 0.066%(+0.198)#361 |
| 44. | Goleta | 0.26% | 0.060%(+0.204)#44 | 0.066%(+0.198)#362 |
| 45. | San Carlos | 0.26% | 0.060%(+0.203)#45 | 0.066%(+0.197)#363 |
| 46. | South Lake Tahoe | 0.23% | 0.060%(+0.175)#46 | 0.066%(+0.168)#382 |
| 47. | Signal Hill | 0.21% | 0.060%(+0.155)#47 | 0.066%(+0.148)#397 |
| 48. | Upland | 0.21% | 0.060%(+0.147)#48 | 0.066%(+0.141)#403 |
| 49. | Riverbank | 0.21% | 0.060%(+0.146)#49 | 0.066%(+0.140)#405 |
| 50. | Arcadia | 0.20% | 0.060%(+0.142)#50 | 0.066%(+0.135)#411 |
| 51. | Vincent | 0.20% | 0.060%(+0.137)#51 | 0.066%(+0.131)#413 |
| 52. | San Leandro | 0.20% | 0.060%(+0.137)#52 | 0.066%(+0.130)#414 |
| 53. | Duarte | 0.18% | 0.060%(+0.125)#53 | 0.066%(+0.119)#429 |
| 54. | Alameda | 0.18% | 0.060%(+0.121)#54 | 0.066%(+0.115)#435 |
| 55. | Hayward | 0.17% | 0.060%(+0.115)#55 | 0.066%(+0.109)#442 |
| 56. | San Bruno | 0.17% | 0.060%(+0.114)#56 | 0.066%(+0.108)#443 |
| 57. | Milpitas | 0.17% | 0.060%(+0.111)#57 | 0.066%(+0.105)#449 |
| 58. | Newark | 0.17% | 0.060%(+0.111)#58 | 0.066%(+0.105)#450 |
| 59. | Walnut | 0.16% | 0.060%(+0.096)#59 | 0.066%(+0.090)#465 |
| 60. | Orinda | 0.15% | 0.060%(+0.095)#60 | 0.066%(+0.088)#468 |
| 61. | Hercules | 0.15% | 0.060%(+0.094)#61 | 0.066%(+0.088)#469 |
| 62. | San Mateo | 0.15% | 0.060%(+0.094)#62 | 0.066%(+0.088)#470 |
| 63. | Valinda | 0.15% | 0.060%(+0.091)#63 | 0.066%(+0.084)#475 |
| 64. | La Habra Heights | 0.14% | 0.060%(+0.083)#64 | 0.066%(+0.077)#483 |
| 65. | Campbell | 0.14% | 0.060%(+0.081)#65 | 0.066%(+0.074)#486 |
| 66. | Lake Mathews | 0.14% | 0.060%(+0.079)#66 | 0.066%(+0.073)#488 |
| 67. | Sunnyvale | 0.14% | 0.060%(+0.076)#67 | 0.066%(+0.070)#493 |
| 68. | Santa Clara | 0.14% | 0.060%(+0.076)#68 | 0.066%(+0.069)#494 |
| 69. | Oroville | 0.13% | 0.060%(+0.069)#69 | 0.066%(+0.062)#500 |
| 70. | Redondo Beach | 0.12% | 0.060%(+0.065)#70 | 0.066%(+0.059)#506 |
| 71. | Artesia | 0.12% | 0.060%(+0.064)#71 | 0.066%(+0.057)#512 |
| 72. | Foothill Farms | 0.12% | 0.060%(+0.063)#72 | 0.066%(+0.056)#513 |
| 73. | University Of California Davis | 0.12% | 0.060%(+0.062)#73 | 0.066%(+0.056)#516 |
| 74. | Pasadena | 0.12% | 0.060%(+0.062)#74 | 0.066%(+0.056)#517 |
| 75. | Benton Park | 0.12% | 0.060%(+0.060)#75 | 0.066%(+0.054)#519 |
| 76. | Eastvale | 0.12% | 0.060%(+0.060)#76 | 0.066%(+0.053)#520 |
| 77. | Chowchilla | 0.12% | 0.060%(+0.058)#77 | 0.066%(+0.051)#527 |
| 78. | Palm Desert | 0.11% | 0.060%(+0.052)#78 | 0.066%(+0.045)#534 |
| 79. | Lake Forest | 0.11% | 0.060%(+0.052)#79 | 0.066%(+0.045)#535 |
| 80. | San Francisco | 0.11% | 0.060%(+0.050)#80 | 0.066%(+0.044)#538 |
| 81. | San Jose | 0.11% | 0.060%(+0.047)#81 | 0.066%(+0.041)#543 |
| 82. | Millbrae | 0.11% | 0.060%(+0.046)#82 | 0.066%(+0.039)#548 |
| 83. | Tustin | 0.10% | 0.060%(+0.044)#83 | 0.066%(+0.037)#554 |
| 84. | La Verne | 0.10% | 0.060%(+0.043)#84 | 0.066%(+0.037)#555 |
| 85. | Oakland | 0.10% | 0.060%(+0.043)#85 | 0.066%(+0.036)#557 |
| 86. | El Segundo | 0.100% | 0.060%(+0.040)#86 | 0.066%(+0.034)#560 |
| 87. | Hacienda Heights | 0.099% | 0.060%(+0.040)#87 | 0.066%(+0.033)#562 |
| 88. | West Carson | 0.099% | 0.060%(+0.039)#88 | 0.066%(+0.033)#564 |
| 89. | Livermore | 0.099% | 0.060%(+0.039)#89 | 0.066%(+0.033)#565 |
| 90. | Danville | 0.090% | 0.060%(+0.030)#90 | 0.066%(+0.024)#579 |
| 91. | Encinitas | 0.089% | 0.060%(+0.029)#91 | 0.066%(+0.023)#581 |
| 92. | San Diego | 0.089% | 0.060%(+0.029)#92 | 0.066%(+0.023)#582 |
| 93. | Azusa | 0.089% | 0.060%(+0.029)#93 | 0.066%(+0.023)#583 |
| 94. | Menlo Park | 0.087% | 0.060%(+0.028)#94 | 0.066%(+0.021)#586 |
| 95. | Hawthorne | 0.085% | 0.060%(+0.026)#95 | 0.066%(+0.019)#592 |
| 96. | Elk Grove | 0.083% | 0.060%(+0.023)#96 | 0.066%(+0.017)#599 |
| 97. | San Ramon | 0.082% | 0.060%(+0.023)#97 | 0.066%(+0.017)#601 |
| 98. | Florin | 0.082% | 0.060%(+0.023)#98 | 0.066%(+0.016)#603 |
| 99. | Stanford | 0.081% | 0.060%(+0.022)#99 | 0.066%(+0.015)#607 |
| 100. | Concord | 0.081% | 0.060%(+0.021)#100 | 0.066%(+0.015)#610 |
Common Questions
What are the Top 10 Cities with the Highest Percentage of Indonesian Population in California?
Top 10 Cities with the Highest Percentage of Indonesian Population in California are:
#1
3.25%
#2
1.63%
#3
1.33%
#4
1.26%
#5
1.02%
#6
1.01%
#7
0.90%
#8
0.78%
#9
0.75%
#10
0.71%
What city has the Highest Percentage of Indonesian Population in California?
Norris Canyon has the Highest Percentage of Indonesian Population in California with 3.25%.
What is the Percentage of Indonesian Population in the State of California?
Percentage of Indonesian Population in California is 0.060%.
What is the Percentage of Indonesian Population in the United States?
Percentage of Indonesian Population in the United States is 0.066%.