Cities with the Highest Percentage of Immigrants from Pakistan in California
RELATED REPORTS & OPTIONS
Pakistan
California
Compare Cities
Map of Cities with the Highest Percentage of Immigrants from Pakistan in California
0.00%
4.00%
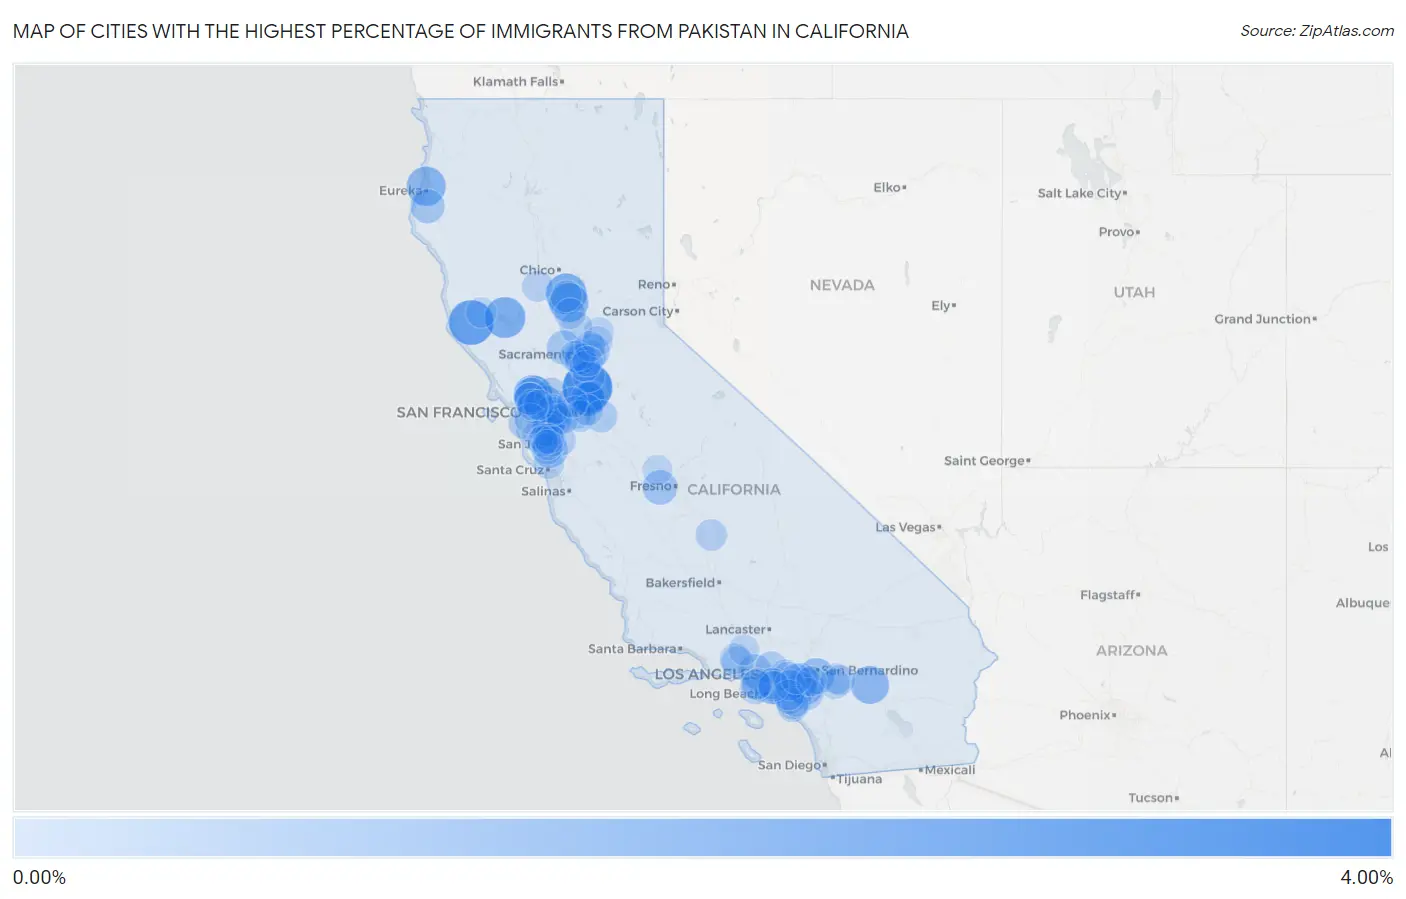
Cities with the Highest Percentage of Immigrants from Pakistan in California
| City | Pakistan | vs State | vs National | |
| 1. | Lodi | 3.70% | 0.13%(+3.58)#-1 | 0.12%(+3.58)#0 |
| 2. | Boonville | 2.81% | 0.13%(+2.69)#0 | 0.12%(+2.70)#1 |
| 3. | Lucerne | 2.11% | 0.13%(+1.98)#1 | 0.12%(+1.99)#2 |
| 4. | Biggs | 2.10% | 0.13%(+1.98)#2 | 0.12%(+1.98)#3 |
| 5. | Live Oak | 1.83% | 0.13%(+1.71)#3 | 0.12%(+1.71)#4 |
| 6. | Manila | 1.81% | 0.13%(+1.68)#4 | 0.12%(+1.69)#5 |
| 7. | Sky Valley | 1.60% | 0.13%(+1.48)#5 | 0.12%(+1.48)#6 |
| 8. | Hercules | 1.49% | 0.13%(+1.37)#8 | 0.12%(+1.37)#174 |
| 9. | Home Gardens | 1.47% | 0.13%(+1.35)#9 | 0.12%(+1.36)#175 |
| 10. | Artesia | 1.29% | 0.13%(+1.17)#10 | 0.12%(+1.17)#176 |
| 11. | Highgrove | 1.27% | 0.13%(+1.15)#11 | 0.12%(+1.15)#177 |
| 12. | Saranap | 1.27% | 0.13%(+1.15)#12 | 0.12%(+1.15)#178 |
| 13. | Monte Sereno | 1.19% | 0.13%(+1.06)#13 | 0.12%(+1.07)#179 |
| 14. | Rodeo | 1.16% | 0.13%(+1.03)#14 | 0.12%(+1.04)#180 |
| 15. | Norris Canyon | 1.15% | 0.13%(+1.03)#15 | 0.12%(+1.03)#181 |
| 16. | El Sobrante Cdp Contra Costa County | 1.09% | 0.13%(+0.965)#16 | 0.12%(+0.972)#182 |
| 17. | Kerman | 0.99% | 0.13%(+0.863)#17 | 0.12%(+0.870)#183 |
| 18. | Pinole | 0.96% | 0.13%(+0.835)#21 | 0.12%(+0.842)#303 |
| 19. | Gold River | 0.95% | 0.13%(+0.823)#22 | 0.12%(+0.829)#304 |
| 20. | Fortuna | 0.92% | 0.13%(+0.792)#23 | 0.12%(+0.799)#305 |
| 21. | Stockton | 0.91% | 0.13%(+0.785)#24 | 0.12%(+0.791)#306 |
| 22. | Country Club | 0.91% | 0.13%(+0.783)#25 | 0.12%(+0.790)#307 |
| 23. | Eastvale | 0.89% | 0.13%(+0.765)#26 | 0.12%(+0.772)#308 |
| 24. | Woodland | 0.87% | 0.13%(+0.747)#27 | 0.12%(+0.753)#309 |
| 25. | Beverly Hills | 0.86% | 0.13%(+0.739)#28 | 0.12%(+0.745)#310 |
| 26. | San Bruno | 0.75% | 0.13%(+0.624)#29 | 0.12%(+0.631)#311 |
| 27. | La Palma | 0.75% | 0.13%(+0.622)#30 | 0.12%(+0.628)#312 |
| 28. | August | 0.70% | 0.13%(+0.579)#31 | 0.12%(+0.585)#313 |
| 29. | Mountain House | 0.69% | 0.13%(+0.565)#32 | 0.12%(+0.572)#314 |
| 30. | San Ramon | 0.68% | 0.13%(+0.556)#88 | 0.12%(+0.563)#856 |
| 31. | Fremont | 0.67% | 0.13%(+0.542)#98 | 0.12%(+0.549)#928 |
| 32. | Parkway | 0.63% | 0.13%(+0.509)#99 | 0.12%(+0.515)#929 |
| 33. | Bell Canyon | 0.62% | 0.13%(+0.497)#100 | 0.12%(+0.503)#930 |
| 34. | Salida | 0.61% | 0.13%(+0.487)#101 | 0.12%(+0.494)#931 |
| 35. | San Pablo | 0.57% | 0.13%(+0.448)#111 | 0.12%(+0.455)#1,013 |
| 36. | Mather | 0.57% | 0.13%(+0.447)#112 | 0.12%(+0.454)#1,014 |
| 37. | San Pasqual | 0.57% | 0.13%(+0.443)#113 | 0.12%(+0.450)#1,015 |
| 38. | Dublin | 0.56% | 0.13%(+0.437)#114 | 0.12%(+0.444)#1,016 |
| 39. | Bay Point | 0.56% | 0.13%(+0.432)#115 | 0.12%(+0.438)#1,017 |
| 40. | Rio Oso | 0.54% | 0.13%(+0.418)#116 | 0.12%(+0.425)#1,018 |
| 41. | Galt | 0.53% | 0.13%(+0.403)#117 | 0.12%(+0.410)#1,019 |
| 42. | Newark | 0.53% | 0.13%(+0.401)#118 | 0.12%(+0.408)#1,020 |
| 43. | Temescal Valley | 0.52% | 0.13%(+0.399)#119 | 0.12%(+0.405)#1,021 |
| 44. | Union City | 0.52% | 0.13%(+0.397)#120 | 0.12%(+0.403)#1,022 |
| 45. | Richmond | 0.51% | 0.13%(+0.389)#121 | 0.12%(+0.396)#1,023 |
| 46. | Tracy | 0.50% | 0.13%(+0.378)#122 | 0.12%(+0.384)#1,024 |
| 47. | Aliso Viejo | 0.48% | 0.13%(+0.352)#123 | 0.12%(+0.359)#1,025 |
| 48. | Pleasanton | 0.48% | 0.13%(+0.352)#132 | 0.12%(+0.359)#1,131 |
| 49. | East Foothills | 0.47% | 0.13%(+0.346)#133 | 0.12%(+0.353)#1,132 |
| 50. | West Menlo Park | 0.47% | 0.13%(+0.345)#134 | 0.12%(+0.351)#1,133 |
| 51. | Poplar Cotton Center | 0.47% | 0.13%(+0.344)#135 | 0.12%(+0.350)#1,134 |
| 52. | Lemon Hill | 0.47% | 0.13%(+0.340)#136 | 0.12%(+0.347)#1,135 |
| 53. | Corona | 0.46% | 0.13%(+0.333)#145 | 0.12%(+0.340)#1,185 |
| 54. | Gridley | 0.46% | 0.13%(+0.331)#146 | 0.12%(+0.338)#1,186 |
| 55. | Livermore | 0.42% | 0.13%(+0.290)#147 | 0.12%(+0.296)#1,187 |
| 56. | Laguna Woods | 0.41% | 0.13%(+0.287)#148 | 0.12%(+0.294)#1,188 |
| 57. | Sacramento | 0.41% | 0.13%(+0.284)#149 | 0.12%(+0.291)#1,189 |
| 58. | Torrance | 0.41% | 0.13%(+0.284)#150 | 0.12%(+0.290)#1,190 |
| 59. | Irvine | 0.41% | 0.13%(+0.282)#151 | 0.12%(+0.289)#1,191 |
| 60. | Danville | 0.41% | 0.13%(+0.280)#152 | 0.12%(+0.286)#1,192 |
| 61. | Emeryville | 0.40% | 0.13%(+0.272)#153 | 0.12%(+0.278)#1,193 |
| 62. | Walnut | 0.39% | 0.13%(+0.268)#154 | 0.12%(+0.274)#1,194 |
| 63. | Diamond Bar | 0.38% | 0.13%(+0.256)#155 | 0.12%(+0.262)#1,195 |
| 64. | Saratoga | 0.37% | 0.13%(+0.248)#156 | 0.12%(+0.255)#1,196 |
| 65. | Lathrop | 0.37% | 0.13%(+0.246)#157 | 0.12%(+0.252)#1,197 |
| 66. | Willows | 0.37% | 0.13%(+0.245)#158 | 0.12%(+0.252)#1,198 |
| 67. | Norwalk | 0.37% | 0.13%(+0.240)#159 | 0.12%(+0.246)#1,199 |
| 68. | West Sacramento | 0.35% | 0.13%(+0.225)#160 | 0.12%(+0.232)#1,200 |
| 69. | Yuba City | 0.35% | 0.13%(+0.224)#161 | 0.12%(+0.231)#1,201 |
| 70. | Brisbane | 0.34% | 0.13%(+0.211)#162 | 0.12%(+0.217)#1,202 |
| 71. | Berkeley | 0.34% | 0.13%(+0.211)#163 | 0.12%(+0.217)#1,203 |
| 72. | Hawthorne | 0.34% | 0.13%(+0.210)#164 | 0.12%(+0.217)#1,204 |
| 73. | Newcastle | 0.33% | 0.13%(+0.208)#165 | 0.12%(+0.214)#1,205 |
| 74. | Elk Grove | 0.33% | 0.13%(+0.203)#166 | 0.12%(+0.210)#1,206 |
| 75. | Simi Valley | 0.33% | 0.13%(+0.199)#167 | 0.12%(+0.206)#1,207 |
| 76. | Lake Forest | 0.32% | 0.13%(+0.196)#168 | 0.12%(+0.202)#1,208 |
| 77. | Mountain View | 0.31% | 0.13%(+0.189)#169 | 0.12%(+0.195)#1,209 |
| 78. | Stevenson Ranch | 0.31% | 0.13%(+0.182)#170 | 0.12%(+0.189)#1,210 |
| 79. | Yorba Linda | 0.30% | 0.13%(+0.177)#171 | 0.12%(+0.184)#1,211 |
| 80. | Cherry Valley | 0.30% | 0.13%(+0.175)#172 | 0.12%(+0.182)#1,212 |
| 81. | Discovery Bay | 0.30% | 0.13%(+0.174)#173 | 0.12%(+0.180)#1,213 |
| 82. | Tustin | 0.30% | 0.13%(+0.174)#174 | 0.12%(+0.180)#1,214 |
| 83. | Cerritos | 0.30% | 0.13%(+0.170)#175 | 0.12%(+0.177)#1,215 |
| 84. | Scotts Valley | 0.29% | 0.13%(+0.169)#176 | 0.12%(+0.175)#1,216 |
| 85. | Banning | 0.29% | 0.13%(+0.162)#177 | 0.12%(+0.168)#1,217 |
| 86. | Chino | 0.29% | 0.13%(+0.161)#178 | 0.12%(+0.168)#1,218 |
| 87. | Santa Clara | 0.29% | 0.13%(+0.160)#179 | 0.12%(+0.167)#1,219 |
| 88. | Citrus Heights | 0.28% | 0.13%(+0.159)#180 | 0.12%(+0.166)#1,220 |
| 89. | Lawndale | 0.28% | 0.13%(+0.157)#181 | 0.12%(+0.163)#1,221 |
| 90. | Ukiah | 0.27% | 0.13%(+0.147)#182 | 0.12%(+0.154)#1,222 |
| 91. | Granite Bay | 0.27% | 0.13%(+0.140)#183 | 0.12%(+0.147)#1,223 |
| 92. | Vineyard | 0.26% | 0.13%(+0.139)#184 | 0.12%(+0.146)#1,224 |
| 93. | Sunnyvale | 0.26% | 0.13%(+0.136)#185 | 0.12%(+0.142)#1,225 |
| 94. | Los Altos Hills | 0.26% | 0.13%(+0.135)#186 | 0.12%(+0.142)#1,226 |
| 95. | Orinda | 0.25% | 0.13%(+0.121)#187 | 0.12%(+0.127)#1,227 |
| 96. | Beaumont | 0.24% | 0.13%(+0.115)#188 | 0.12%(+0.122)#1,228 |
| 97. | Riverside | 0.24% | 0.13%(+0.111)#189 | 0.12%(+0.117)#1,229 |
| 98. | Sonoma State University | 0.23% | 0.13%(+0.109)#190 | 0.12%(+0.115)#1,230 |
| 99. | Cupertino | 0.23% | 0.13%(+0.107)#191 | 0.12%(+0.114)#1,231 |
| 100. | Madera | 0.22% | 0.13%(+0.098)#192 | 0.12%(+0.104)#1,232 |
Common Questions
What are the Top 10 Cities with the Highest Percentage of Immigrants from Pakistan in California?
Top 10 Cities with the Highest Percentage of Immigrants from Pakistan in California are:
#1
3.70%
#2
2.81%
#3
2.11%
#4
2.10%
#5
1.83%
#6
1.81%
#7
1.60%
#8
1.49%
#9
1.47%
#10
1.29%
What city has the Highest Percentage of Immigrants from Pakistan in California?
Lodi has the Highest Percentage of Immigrants from Pakistan in California with 3.70%.
What is the Percentage of Immigrants from Pakistan in the State of California?
Percentage of Immigrants from Pakistan in California is 0.13%.
What is the Percentage of Immigrants from Pakistan in the United States?
Percentage of Immigrants from Pakistan in the United States is 0.12%.