Cities with the Most Immigrants from Guatemala in California
RELATED REPORTS & OPTIONS
Guatemala
California
Compare Cities
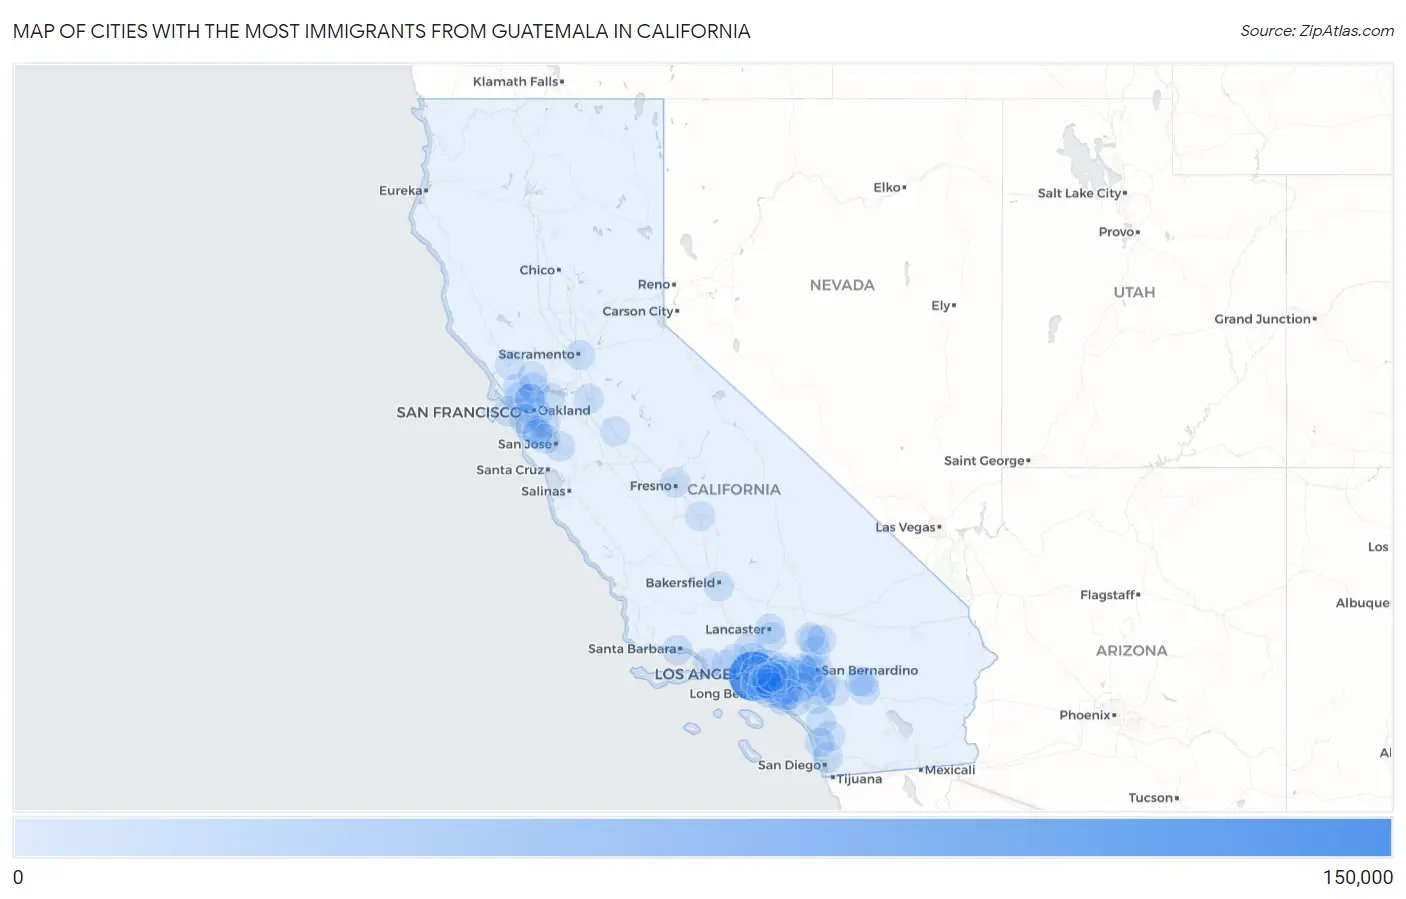
Map of Cities with the Most Immigrants from Guatemala in California
0
150,000
Cities with the Most Immigrants from Guatemala in California
| City | Guatemala | vs State | vs National | |
| 1. | Los Angeles | 118,257 | 290,436(40.72%)#1 | 1,051,999(11.24%)#1 |
| 2. | Oakland | 8,622 | 290,436(2.97%)#2 | 1,051,999(0.82%)#5 |
| 3. | San Rafael | 4,026 | 290,436(1.39%)#3 | 1,051,999(0.38%)#22 |
| 4. | San Francisco | 3,718 | 290,436(1.28%)#4 | 1,051,999(0.35%)#24 |
| 5. | Riverside | 3,208 | 290,436(1.10%)#5 | 1,051,999(0.30%)#28 |
| 6. | Long Beach | 3,190 | 290,436(1.10%)#6 | 1,051,999(0.30%)#29 |
| 7. | Inglewood | 2,909 | 290,436(1.00%)#7 | 1,051,999(0.28%)#35 |
| 8. | Santa Ana | 2,845 | 290,436(0.98%)#8 | 1,051,999(0.27%)#37 |
| 9. | Anaheim | 2,823 | 290,436(0.97%)#9 | 1,051,999(0.27%)#38 |
| 10. | San Diego | 2,819 | 290,436(0.97%)#10 | 1,051,999(0.27%)#39 |
| 11. | Palmdale | 2,805 | 290,436(0.97%)#11 | 1,051,999(0.27%)#40 |
| 12. | Santa Clarita | 2,570 | 290,436(0.88%)#12 | 1,051,999(0.24%)#42 |
| 13. | San Mateo | 2,339 | 290,436(0.81%)#13 | 1,051,999(0.22%)#48 |
| 14. | Richmond | 2,321 | 290,436(0.80%)#14 | 1,051,999(0.22%)#50 |
| 15. | Westmont | 2,168 | 290,436(0.75%)#15 | 1,051,999(0.21%)#58 |
| 16. | Hawthorne | 2,164 | 290,436(0.75%)#16 | 1,051,999(0.21%)#59 |
| 17. | East Los Angeles | 2,034 | 290,436(0.70%)#17 | 1,051,999(0.19%)#64 |
| 18. | Fontana | 1,968 | 290,436(0.68%)#18 | 1,051,999(0.19%)#67 |
| 19. | Downey | 1,928 | 290,436(0.66%)#19 | 1,051,999(0.18%)#68 |
| 20. | Escondido | 1,911 | 290,436(0.66%)#20 | 1,051,999(0.18%)#71 |
| 21. | San Jose | 1,879 | 290,436(0.65%)#21 | 1,051,999(0.18%)#72 |
| 22. | Florence Graham | 1,863 | 290,436(0.64%)#22 | 1,051,999(0.18%)#74 |
| 23. | Pomona | 1,752 | 290,436(0.60%)#23 | 1,051,999(0.17%)#79 |
| 24. | South Gate | 1,743 | 290,436(0.60%)#24 | 1,051,999(0.17%)#80 |
| 25. | Moreno Valley | 1,694 | 290,436(0.58%)#25 | 1,051,999(0.16%)#86 |
| 26. | Hayward | 1,672 | 290,436(0.58%)#26 | 1,051,999(0.16%)#87 |
| 27. | Novato | 1,556 | 290,436(0.54%)#27 | 1,051,999(0.15%)#90 |
| 28. | Bakersfield | 1,498 | 290,436(0.52%)#28 | 1,051,999(0.14%)#98 |
| 29. | Norwalk | 1,485 | 290,436(0.51%)#29 | 1,051,999(0.14%)#100 |
| 30. | Lawndale | 1,469 | 290,436(0.51%)#30 | 1,051,999(0.14%)#102 |
| 31. | Lake Elsinore | 1,458 | 290,436(0.50%)#31 | 1,051,999(0.14%)#104 |
| 32. | San Bernardino | 1,439 | 290,436(0.50%)#32 | 1,051,999(0.14%)#106 |
| 33. | Gardena | 1,428 | 290,436(0.49%)#33 | 1,051,999(0.14%)#107 |
| 34. | Stockton | 1,313 | 290,436(0.45%)#34 | 1,051,999(0.12%)#115 |
| 35. | Huntington Park | 1,302 | 290,436(0.45%)#35 | 1,051,999(0.12%)#118 |
| 36. | El Monte | 1,287 | 290,436(0.44%)#36 | 1,051,999(0.12%)#120 |
| 37. | Compton | 1,280 | 290,436(0.44%)#37 | 1,051,999(0.12%)#121 |
| 38. | Pasadena | 1,271 | 290,436(0.44%)#38 | 1,051,999(0.12%)#122 |
| 39. | Willowbrook | 1,252 | 290,436(0.43%)#39 | 1,051,999(0.12%)#127 |
| 40. | Ontario | 1,205 | 290,436(0.41%)#40 | 1,051,999(0.11%)#132 |
| 41. | Santa Barbara | 1,151 | 290,436(0.40%)#41 | 1,051,999(0.11%)#140 |
| 42. | Fallbrook | 1,144 | 290,436(0.39%)#42 | 1,051,999(0.11%)#142 |
| 43. | Redwood City | 1,135 | 290,436(0.39%)#43 | 1,051,999(0.11%)#144 |
| 44. | Lancaster | 1,131 | 290,436(0.39%)#44 | 1,051,999(0.11%)#147 |
| 45. | San Fernando | 1,061 | 290,436(0.37%)#45 | 1,051,999(0.10%)#155 |
| 46. | Garden Grove | 1,053 | 290,436(0.36%)#46 | 1,051,999(0.10%)#156 |
| 47. | Lynwood | 1,052 | 290,436(0.36%)#47 | 1,051,999(0.10%)#157 |
| 48. | Rialto | 1,039 | 290,436(0.36%)#48 | 1,051,999(0.10%)#158 |
| 49. | Daly City | 1,026 | 290,436(0.35%)#49 | 1,051,999(0.10%)#161 |
| 50. | Sacramento | 1,007 | 290,436(0.35%)#50 | 1,051,999(0.10%)#165 |
| 51. | Costa Mesa | 1,004 | 290,436(0.35%)#51 | 1,051,999(0.10%)#166 |
| 52. | Cathedral City | 964 | 290,436(0.33%)#52 | 1,051,999(0.09%)#176 |
| 53. | Orange | 960 | 290,436(0.33%)#53 | 1,051,999(0.09%)#178 |
| 54. | Lennox | 912 | 290,436(0.31%)#54 | 1,051,999(0.09%)#182 |
| 55. | Baldwin Park | 893 | 290,436(0.31%)#55 | 1,051,999(0.08%)#183 |
| 56. | Glendale | 833 | 290,436(0.29%)#56 | 1,051,999(0.08%)#198 |
| 57. | Vallejo | 809 | 290,436(0.28%)#57 | 1,051,999(0.08%)#206 |
| 58. | Perris | 802 | 290,436(0.28%)#58 | 1,051,999(0.08%)#208 |
| 59. | Victorville | 794 | 290,436(0.27%)#59 | 1,051,999(0.08%)#210 |
| 60. | Jurupa Valley | 787 | 290,436(0.27%)#60 | 1,051,999(0.07%)#214 |
| 61. | Bellflower | 780 | 290,436(0.27%)#61 | 1,051,999(0.07%)#216 |
| 62. | Hesperia | 767 | 290,436(0.26%)#62 | 1,051,999(0.07%)#218 |
| 63. | Carson | 760 | 290,436(0.26%)#63 | 1,051,999(0.07%)#220 |
| 64. | Simi Valley | 700 | 290,436(0.24%)#64 | 1,051,999(0.07%)#234 |
| 65. | Azusa | 698 | 290,436(0.24%)#65 | 1,051,999(0.07%)#236 |
| 66. | Bell Gardens | 680 | 290,436(0.23%)#66 | 1,051,999(0.06%)#245 |
| 67. | Fresno | 679 | 290,436(0.23%)#67 | 1,051,999(0.06%)#246 |
| 68. | West Covina | 672 | 290,436(0.23%)#68 | 1,051,999(0.06%)#252 |
| 69. | Mountain View | 667 | 290,436(0.23%)#69 | 1,051,999(0.06%)#255 |
| 70. | La Habra | 662 | 290,436(0.23%)#70 | 1,051,999(0.06%)#259 |
| 71. | San Pablo | 597 | 290,436(0.21%)#71 | 1,051,999(0.06%)#291 |
| 72. | Concord | 592 | 290,436(0.20%)#72 | 1,051,999(0.06%)#295 |
| 73. | La Puente | 584 | 290,436(0.20%)#73 | 1,051,999(0.06%)#299 |
| 74. | Corona | 577 | 290,436(0.20%)#74 | 1,051,999(0.05%)#304 |
| 75. | North Fair Oaks | 566 | 290,436(0.19%)#75 | 1,051,999(0.05%)#310 |
| 76. | Rancho Cucamonga | 559 | 290,436(0.19%)#76 | 1,051,999(0.05%)#312 |
| 77. | West Rancho Dominguez | 555 | 290,436(0.19%)#77 | 1,051,999(0.05%)#314 |
| 78. | Whittier | 554 | 290,436(0.19%)#78 | 1,051,999(0.05%)#315 |
| 79. | Maywood | 534 | 290,436(0.18%)#79 | 1,051,999(0.05%)#325 |
| 80. | Rowland Heights | 533 | 290,436(0.18%)#80 | 1,051,999(0.05%)#326 |
| 81. | Cudahy | 524 | 290,436(0.18%)#81 | 1,051,999(0.05%)#333 |
| 82. | Santa Rosa | 522 | 290,436(0.18%)#82 | 1,051,999(0.05%)#334 |
| 83. | Lake Forest | 513 | 290,436(0.18%)#83 | 1,051,999(0.05%)#337 |
| 84. | Tustin | 511 | 290,436(0.18%)#84 | 1,051,999(0.05%)#338 |
| 85. | Thousand Oaks | 508 | 290,436(0.17%)#85 | 1,051,999(0.05%)#342 |
| 86. | Encinitas | 508 | 290,436(0.17%)#86 | 1,051,999(0.05%)#344 |
| 87. | Oxnard | 505 | 290,436(0.17%)#87 | 1,051,999(0.05%)#345 |
| 88. | Apple Valley | 501 | 290,436(0.17%)#88 | 1,051,999(0.05%)#348 |
| 89. | Turlock | 486 | 290,436(0.17%)#89 | 1,051,999(0.05%)#352 |
| 90. | Garnet | 486 | 290,436(0.17%)#90 | 1,051,999(0.05%)#353 |
| 91. | Visalia | 485 | 290,436(0.17%)#91 | 1,051,999(0.05%)#355 |
| 92. | Lakewood | 484 | 290,436(0.17%)#92 | 1,051,999(0.05%)#356 |
| 93. | Desert Hot Springs | 471 | 290,436(0.16%)#93 | 1,051,999(0.04%)#363 |
| 94. | Paramount | 452 | 290,436(0.16%)#94 | 1,051,999(0.04%)#370 |
| 95. | Montebello | 435 | 290,436(0.15%)#95 | 1,051,999(0.04%)#381 |
| 96. | West Hollywood | 432 | 290,436(0.15%)#96 | 1,051,999(0.04%)#383 |
| 97. | Napa | 416 | 290,436(0.14%)#97 | 1,051,999(0.04%)#387 |
| 98. | San Jacinto | 415 | 290,436(0.14%)#98 | 1,051,999(0.04%)#388 |
| 99. | Adelanto | 414 | 290,436(0.14%)#99 | 1,051,999(0.04%)#390 |
| 100. | Pico Rivera | 412 | 290,436(0.14%)#100 | 1,051,999(0.04%)#391 |
Common Questions
What are the Top 10 Cities with the Most Immigrants from Guatemala in California?
Top 10 Cities with the Most Immigrants from Guatemala in California are:
#1
118,257
#2
8,622
#3
4,026
#4
3,718
#5
3,208
#6
3,190
#7
2,909
#8
2,845
#9
2,823
#10
2,819
What city has the Most Immigrants from Guatemala in California?
Los Angeles has the Most Immigrants from Guatemala in California with 118,257.
What is the Total Immigrants from Guatemala in the State of California?
Total Immigrants from Guatemala in California is 290,436.
What is the Total Immigrants from Guatemala in the United States?
Total Immigrants from Guatemala in the United States is 1,051,999.